. 2022 Dec 15:2022:4994815.
doi: 10.1155/2022/4994815. eCollection 2022.

Identification of Signature Genes in the PD-1 Relative Gastric Cancer Using a Combined Analysis of Gene Expression and Methylation Data

Affiliations

Identification of Signature Genes in the PD-1 Relative Gastric Cancer Using a Combined Analysis of Gene Expression and Methylation Data

Han Yu et al. J Oncol. .

Abstract

Background: The morbidity and mortality rates for gastric cancer (GC) rank second among all cancers, indicating the serious threat it poses to human health, as well as human life. This study aims to identify the pathways and genes as well as investigate the molecular mechanisms of tumor-related genes in gastric cancer (GC).

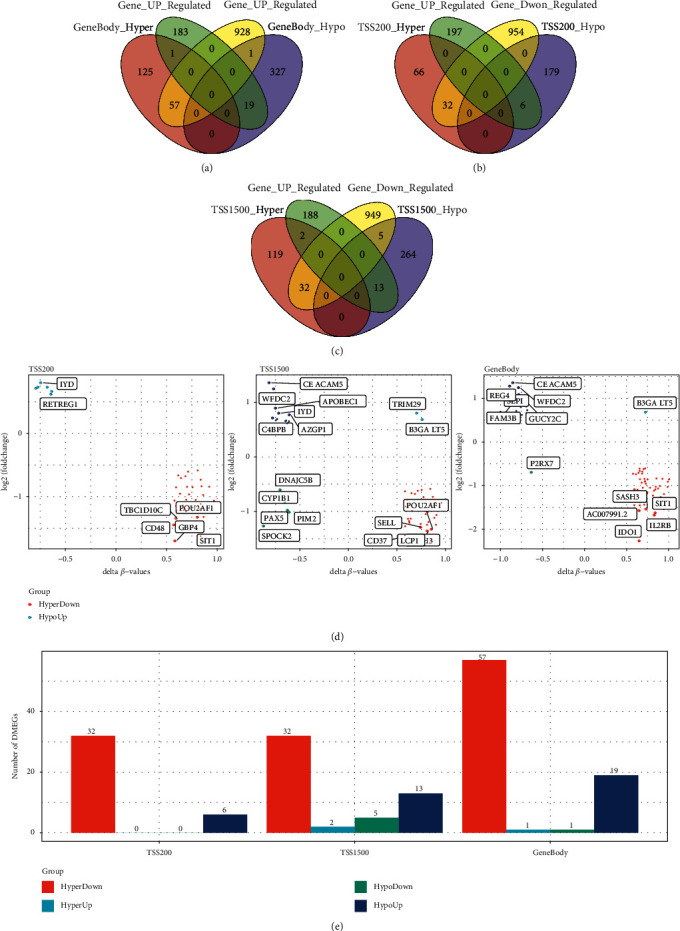
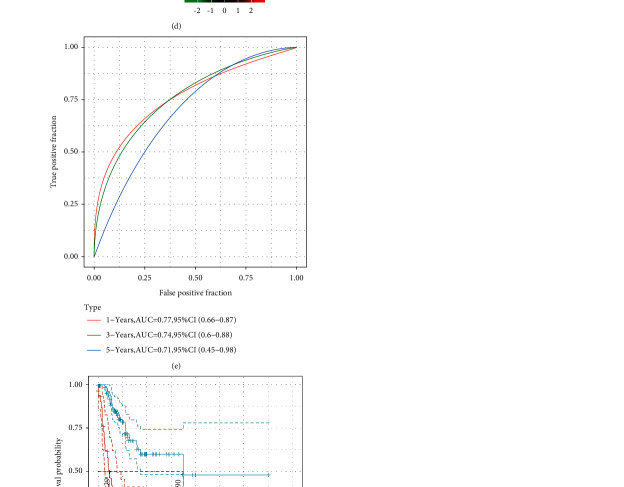
Method: We compared differentially expressed genes (DEGs) and differentially methylated genes (DMGs) in gastric cancer and normal tissue samples using The Cancer Genome Atlas (TCGA) data. The Kyoto Encyclopedia of Gene and Genome (KEGG) and the Gene Ontology (GO) enrichment analysis' pathway annotations were conducted on DMGs and DEGs using a clusterProfiler R package to identify the important functions, as well as the biological processes and pathways involved. The intersection of the two was chosen and defined as differentially methylated and expressed genes (DMEGs). For DMEGs, we used the principal component analysis (PCA) to differentiate gastric cancer from adjacent samples. The linear discriminant analysis method was applied to categorize the samples using DMEGs methylation data and DMEGs expression profiles data and was validated using the leave-one-out cross-validation (LOOCV) method. We plotted the ROC curve for the classification and calculated the AUC (area under the ROC curve) value for a more intuitive view of the classification effect. We also used the NetworkAnalyst 3.0 tool to analyze DMEGs, using DrugBank to acquire information on protein-drug interactions and generate a network map of gene-drug interactions.

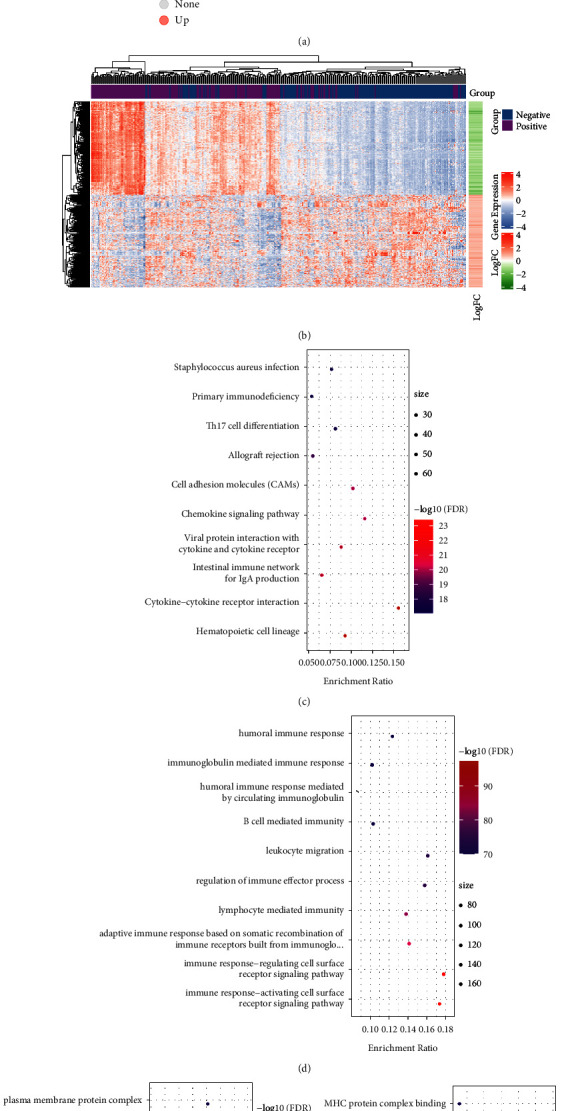
Results: We identified a total of 971 DMGs in 188 PD-1 negative and 187 PD-1 positive gastric cancer samples obtained from TCGA. The KEGG and GO enrichment analysis showed the involvement of the regulation of ion transmembrane transport, collagen-containing extracellular matrix, cell-cell junction, and peptidase regulator activity. We simultaneously obtained 1,189 DEGs, out of which 986 were downregulated, while 203 were upregulated in tumors. The enriched analysis of the GO's and KEGG's pathways indicated that the most significant pathways included an intestinal immune network for IgA production, Staphylococcus aureus infection, cytokine-cytokine receptor interaction, and viral protein interaction with cytokine and cytokine receptor, which have previously been linked with gastric cancer. The compound DB01830 can bind well to the active site of the LCK protein and shows good stability, thus making it a potential inhibitor of the LCK protein. To observe the relationship between DMEGs' expression and prognosis, we observed 10 genes, among which were TRIM29, TSPAN8, EOMES, PPP1R16B, SELL, PCED1B, IYD, JPH1, CEACAM5, and RP11-44K6.2. Their high expressions were related to high risks. Besides, those genes were validated in different internal and external validation sets.

Conclusion: These results may provide potential molecular biological therapy for PD-1 negative gastric cancer.


Conflict of interest statement

The authors declare that the research was conducted in the absence of any commercial or financial relationships that could be construed as potential conflicts of interest.

Figures

Figure 1
Figure 1
(a) The expression of PD-1 in tumor samples and normal samples, (b) violin plots of the scores difference of immune cell cytolytic activity (CYT) in tumor samples and normal samples, and (c) seven different immune T cell scores obtained by ssGSEA from tumor and normal tissue samples. P < 0.05, ∗∗P < 0.01, and ∗∗∗P < 0.001.
Figure 2
Figure 2
(a) The volcano plots of differential methylation in the gene body, TSS200, and TSS1500; (b) the histograms of differential methylation in three regions; (c) the Venn diagram of hypermethylation in three regions; (d) the Venn diagram of demethylation in three regions; and (e) the KEGG and GO functional enrichment analysis of differential methylation genes, where blue to red indicates FDR from large to small, and dots from small to large represent an increasing number of genes.
Figure 3
Figure 3
(a) The volcano plots of DEGs, (b) the heat map of DEGs, (c) the KEGG enrichment result of DEGs, (d) the GO BP enrichment result of DEGs, (e) the GO CC enrichment result of DEGs, and (f) the GO MF enrichment result of DEGs. The colors of CDEF, from blue to red, represent the FDR from large to small; the dots' sizes represent the enrichment result of the number of genes, while dots from small to large represent an increasing number of genes.
Figure 4
Figure 4
(a) The Venn diagram of DEGs and DMGs in the GeneBody region; (b) the Venn diagram of DEGs and DMGs in the TSS200 region; (c) the Venn diagram of DEGs and DMGs in the TSS1500 region; (d) the quadrant plots of DEGs and DMGs genes in the TSS200, TSS1500, and GeneBody regions; and (e) the histogram of four regulation modes of DEGs and DMGs in the TSS200, TS1500, and GeneBody regions.
Figure 5
Figure 5
(a) The distribution of DMEGs in the genome, (b) the PCA analysis of gene expression and methylation of DMEGs, (c) the ROC curves of predicting tumor and normal samples based on the linear discriminant classification model constructed by the DMEGs gene expression profiles and methylation data, and (d) the KEGG pathway and GO enrichment analysis of DMEGs, in which distinct colors denote different pathways, and connections denote genes associated with pathways.
Figure 6
Figure 6
(a) 3D structure of the LCK protein, (b) binding diagram of the LCK protein to the compound DB01830, (c) 2D interaction diagram of the LCK protein with the compound DB01830, and (d) RMSD value of the compound DB01830 during 100 ns molecular dynamics simulation. Note: The amino acid residues in the protein were shown as steel blue sticks, and the heteroatoms on the residues were shown by element type. The compound DB01830 was displayed as a magenta stick.
Figure 7
Figure 7
(a) The frequency of 1,000 lasso regression in each gene combination; (b) the variation coefficients trajectory of each gene with different lambda; (c) the standard deviation distribution of models with different lambda; (d) the survival time and status, RiskScore, and expression of 10 genes in the training set; (e) the AUC and ROC curve of 10-gene signature categories in the training set; and (f) the KM 10-gene signature survival distribution curve in the training set.
Figure 8
Figure 8
(a) The survival status and time, RiskScore, and expression of 10 genes in the training set; (b) the AUC and ROC curve of 10-gene signature categories in the training set; and (c) the KM 10-gene signature survival distribution curve in the training set.
Figure 9
Figure 9
(a) The survival time and status, RiskScore, and expression of 10 genes in the PD-I negative samples from TCGA; (b) the AUC and ROC curve of 10-gene signature categories in the verification set; and (c) the KM 10-gene signature survival distribution curve in the PD-1 negative samples from TCGA.
Figure 10
Figure 10
(a) The survival time and status, RiskScore, and expression of 10 genes in the PD-I negative samples from GSE84437; (b) the AUC and ROC curve of 10-gene signature categories in the verification set; (c) the KM 10-gene signature survival distribution curve in GSE84437.

References

    1. Siegel R. L., Miller K. D., Fuchs H. E., Jemal A. Cancer statistics, 2021. CA: A Cancer Journal for Clinicians . 2021;71(1):7–33. doi: 10.3322/caac.21654. - DOI - PubMed
    1. Cao M., Li H., Sun D., Chen W. Cancer burden of major cancers in China: a need for sustainable actions. Cancer Communications . 2020;40(5):205–210. doi: 10.1002/cac2.12025. - DOI - PMC - PubMed
    1. Zheng R. S., Sun K. X., Zhang S. W., et al. [Report of cancer epidemiology in China, 2015] Zhonghua Zhongliu Zazhi . 2019;41(1):19–28. doi: 10.3760/cma.j.issn.0253-3766.2019.01.005. - DOI - PubMed
    1. Katai H., Ishikawa T., Akazawa K., et al. Five-year survival analysis of surgically resected gastric cancer cases in Japan: a retrospective analysis of more than 100, 000 patients from the nationwide registry of the Japanese Gastric Cancer Association (2001-2007) Gastric Cancer . 2018;21(1):144–154. doi: 10.1007/s10120-017-0716-7. - DOI - PubMed
    1. Ramakrishnan R., Gabrilovich D. I. Novel mechanism of synergistic effects of conventional chemotherapy and immune therapy of cancer. Cancer Immunol Immunother . 2013;62(3):405–410. doi: 10.1007/s00262-012-1390-6. - DOI - PMC - PubMed

LinkOut - more resources