

doi: 10.1140/epjd/s10053-022-00558-5.
Epub 2022 Dec 19.
Field and intensity correlations: the Siegert relation from stars to quantum emitters
Affiliations
- PMID: 36568919
- PMCID: PMC9763155
- DOI: 10.1140/epjd/s10053-022-00558-5
Item in Clipboard
Field and intensity correlations: the Siegert relation from stars to quantum emitters
Eur Phys J D At Mol Opt Phys.
2022.
Abstract
The Siegert relation relates field and intensity temporal correlations. After a historical review of the Siegert relation and the Hanbury Brown and Twiss effect, we discuss the validity of this relation in two different domains. We first show that this relation can be used in astrophysics to determine the fundamental parameters of stars, and that it is especially important for the observation with stellar emission lines. Second, we check the validity of this relation for moving quantum scatterers illuminated by a strong driving field.
© The Author(s) 2022.
Figures

Simplified outline of an intensity interferometer for radio waves (a) and optical frequencies (b) taken from Ref. [13], with and the two mirrors, and the photocatodes of the two photomultipliers and and the two arials
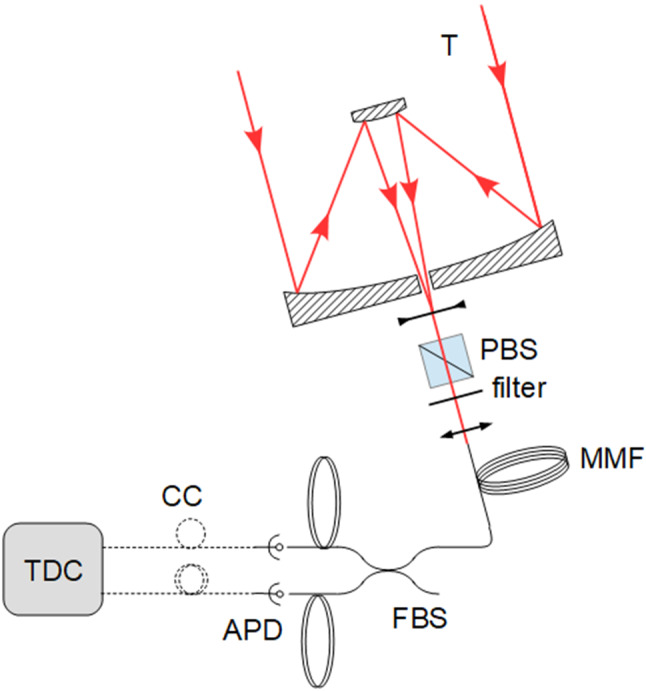
Experimental setup to measure the temporal intensity correlation for light coming from stars. See text for details. T: telescope, PBS: Polarizing Beam Splitter, MMF: multimode fiber, FBS: fibered beamsplitter, APD: avalanche photodiodes, CC: coaxial cables, TDC: time-to-digital convertor
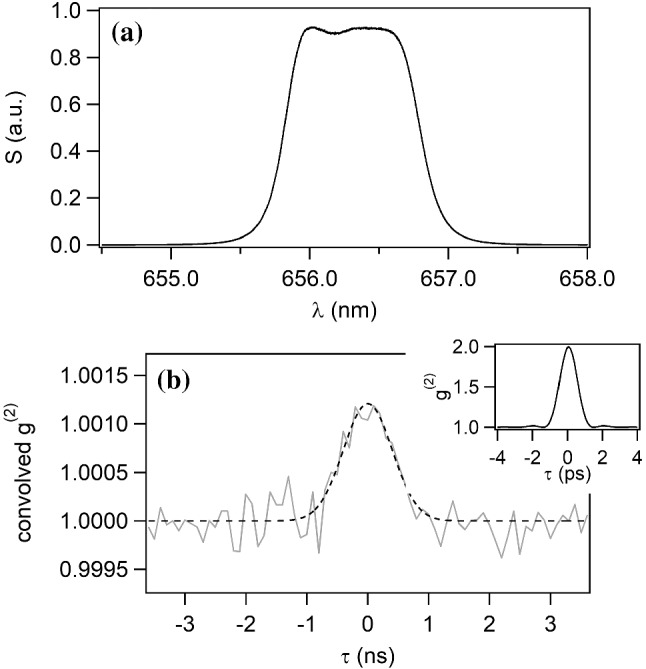
a Spectrum of the light coming from an halogen lamp injected in a monomode fiber (artificial star) and transmitted by a narrow filter, showing a spectral bandwidth of about 1 nm. b Gray line: temporal function measured on the artificial star. Dashed line: Theoretical function, calculated from the spectrum assuming the Siegert relation, convolved by the electronic time response. Inset: theoretical function calculated from the transmitted spectrum, assuming the Siegert relation and an infinite electronic response bandwidth
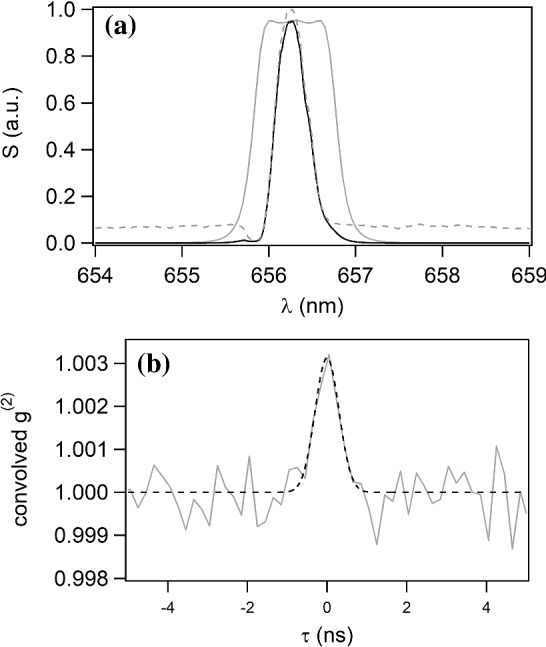
a Gray line: H filter transmission. Dashed grey line: spectrum emitted by P Cygni as reported in the AAVSO database [45] on August 8th 2020. Black line: spectrum of P Cygni transmitted by the filter. b Grey line: temporal function measured on P Cygni between 3 August 2020 and 9 August 2020. Dashed line: Theoretical function, calculated from the spectrum assuming the Siegert relation and convolved by the electronic time response
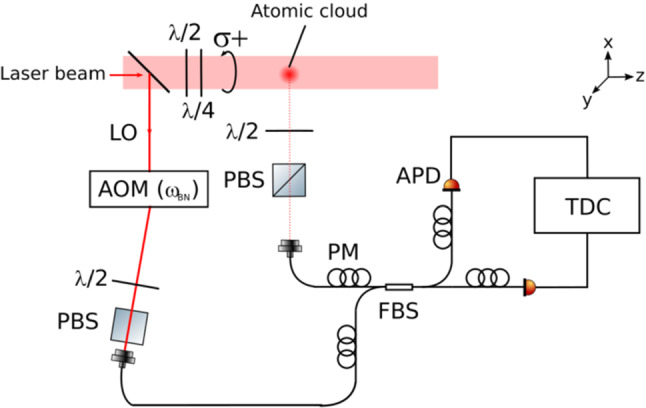
Experimental setup to simultaneously measure and of the light scattered by quantum scatterers. A cold atomic cloud is illuminated by a laser beam circularly polarized thanks to and plates. The scattered light is collected by a polarization-maintaining (PM) single-mode fiber after polarization selection with a and a polarizing beam splitter (PBS). The light is split with a fibered beam splitter (FBS) and its two outputs illuminate two avalanche photodiodes (APDs). Each photon arrival is time-tagged by a time-to-digital converter (TDC) and the correlations are computed by a computer. Finally, a local oscillator (LO), derived from the same laser that illuminates the scattering medium and frequency-shifted by an acousto-optical modulator (AOM), is injected in the second input of the FBS

Fourier transform of the temporal intensity correlation function of the scattered light beating with the LO. The saturation parameter of the probe beam was set to 60. The curve close to the DC value corresponds to the Fourier transform of , while the frequency shifted curve corresponds to the Fourier transform of . Inset: temporal intensity correlation function of the scattered light beating with the LO
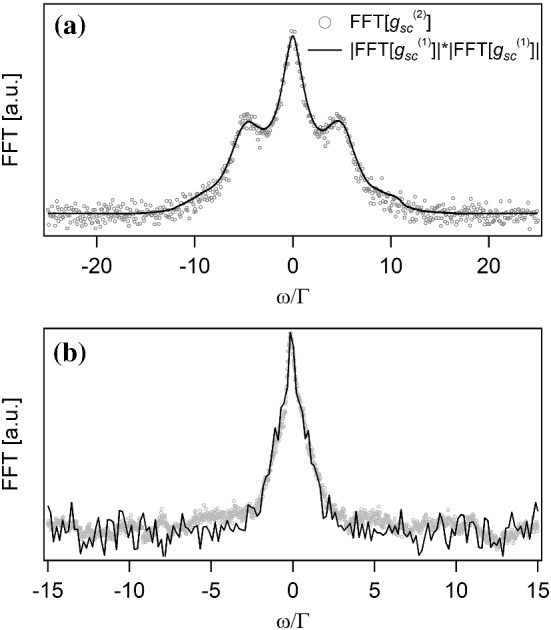
Siegert relation for light scattered by quantum scatterers a in the high saturation limit () and b in the intermediate regime (). Open grey circles: Fourier transform of the intensity correlation ; plain black curve: self-convolution of the Fourier transform of the electric field correlation
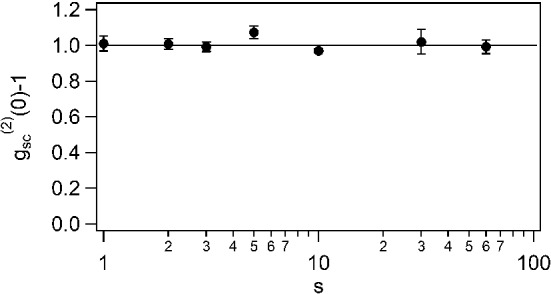
Contrast of the bunching peak for saturation parameters larger than one. The black line set at corresponds to the expected value if the Siegert relation is valid
References
-
- Wiener N. Generalized harmonic analysis. Acta Math. 1930;55:117–258. doi: 10.1007/BF02546511. - DOI
-
- Khintchine A. Korrelationstheorie der stationären stochastischen prozesse. Math. Ann. 1934;109(1):604–615. doi: 10.1007/BF01449156. - DOI
-
- Glauber RJ. The quantum theory of optical coherence. Phys. Rev. 1963;130:2529. doi: 10.1103/PhysRev.130.2529. - DOI
-
- Siegert AJF. On the fluctuations in signals returned by many independently moving scatterers. Report: Radiation laboratory, Massachusetts Insitute of Technology; 1943.
-
- G. Maret, P.E. Wolf, Multiple light scattering from disordered media. The effect of brownian motion of scatterers. Zeitschrift für Physik B Condensed Matter. 65(4), 409–413 (1987). 10.1007/BF01303762
LinkOut - more resources
Full Text Sources