

Probiotic effects on immunity and microbiome in HIV-1 discordant patients
- PMID: 36569851
- PMCID: PMC9774487
- DOI: 10.3389/fimmu.2022.1066036
Probiotic effects on immunity and microbiome in HIV-1 discordant patients
Abstract
Background: Some HIV-1 infected patients are unable to completely recover normal CD4+ T-cell (CD4+) counts after achieving HIV-1 suppression with combined Antiretroviral Therapy (cART), hence being classified as immuno-discordant. The human microbiome plays a crucial role in maintaining immune homeostasis and is a potential target towards immune reconstitution.
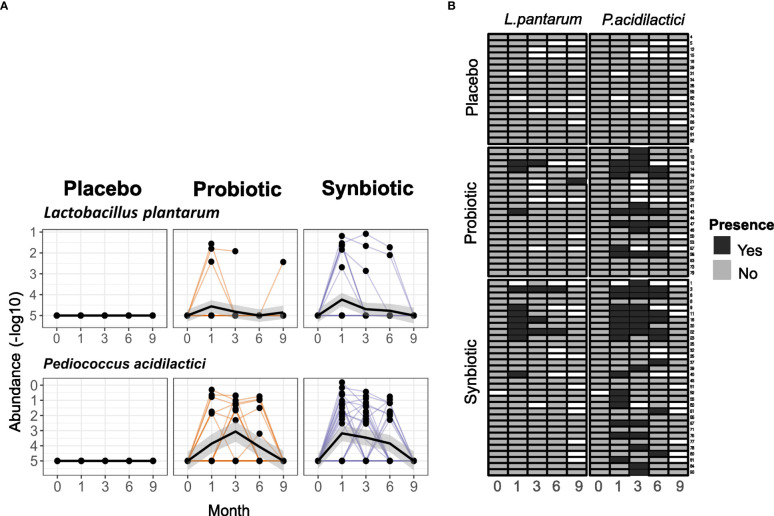
Setting: RECOVER (NCT03542786) was a double-blind placebo-controlled clinical trial designed to evaluate if the novel probiotic i3.1 (AB-Biotics, Sant Cugat del Vallès, Spain) was able to improve immune reconstitution in HIV-1 infected immuno-discordant patients with stable cART and CD4+ counts <500 cells/mm3. The mixture consisted of two strains of L. plantarum and one of P. acidilactici, given with or without a fiber-based prebiotic.
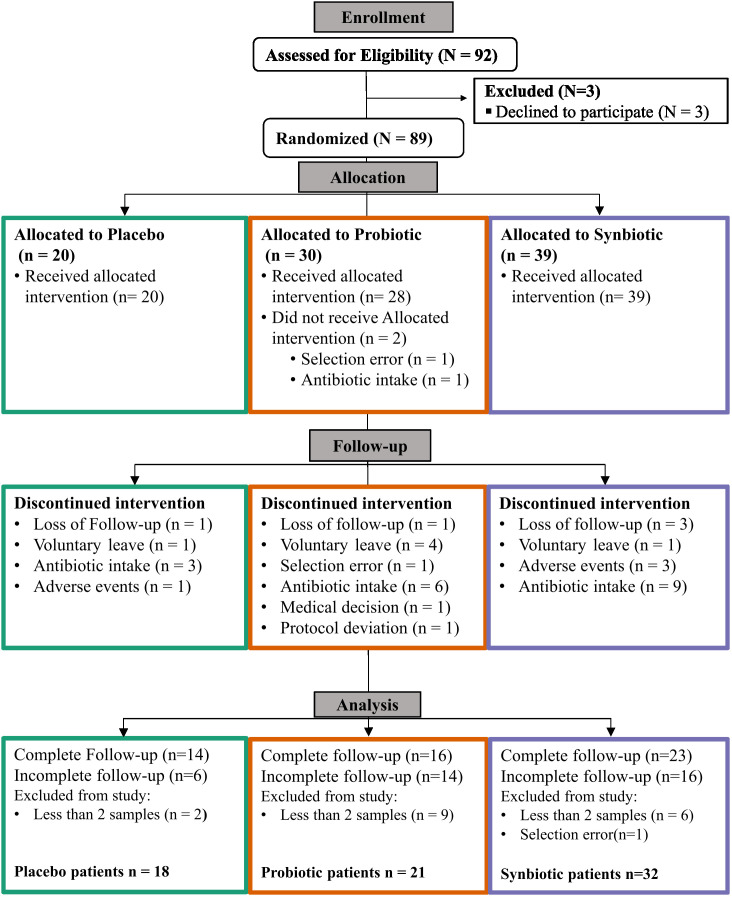
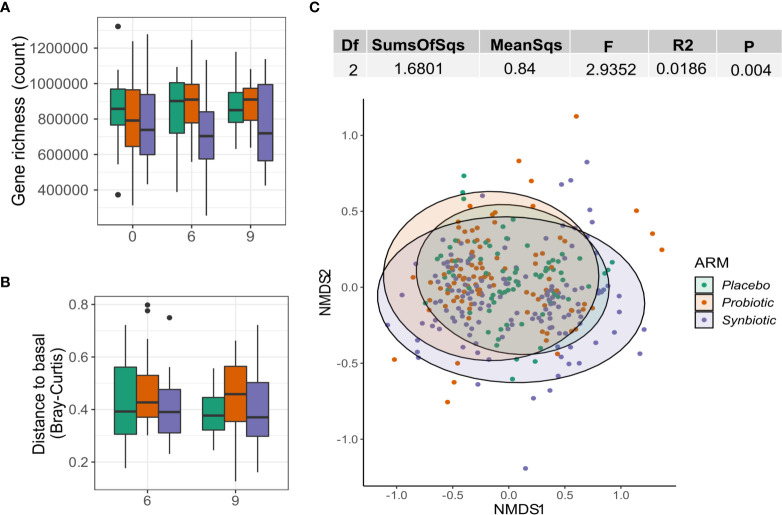
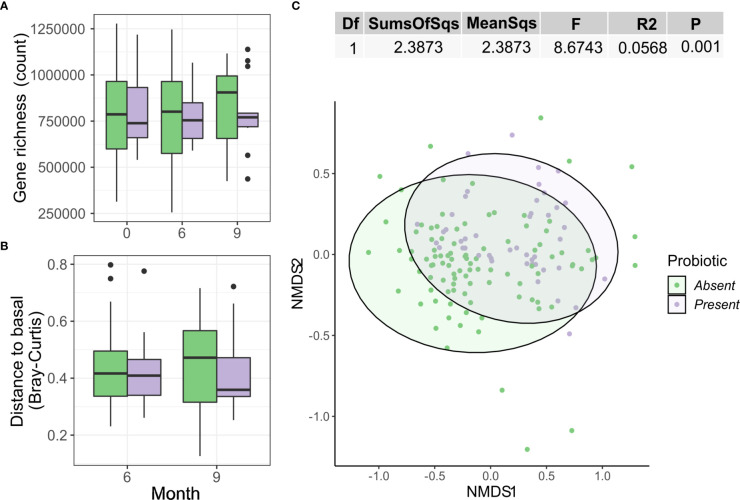
Methods: 71 patients were randomized 1:2:2 to Placebo, Probiotic or probiotic + prebiotic (Synbiotic), and were followed over 6 months + 3-month washout period, in which changes on systemic immune status and gut microbiome were evaluated. Primary endpoints were safety and tolerability of the investigational product. Secondary endpoints were changes on CD4+ and CD8+ T-cell (CD8+) counts, inflammation markers and faecal microbiome structure, defined by alpha diversity (Gene Richness), beta diversity (Bray-Curtis) and functional profile. Comparisons across/within groups were performed using standard/paired Wilcoxon test, respectively.
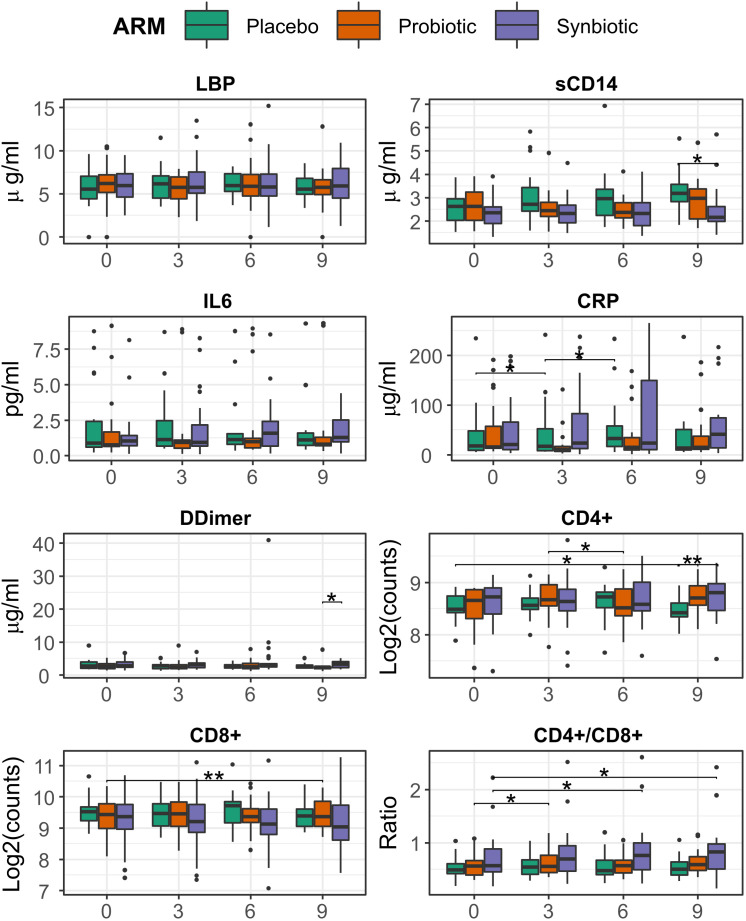
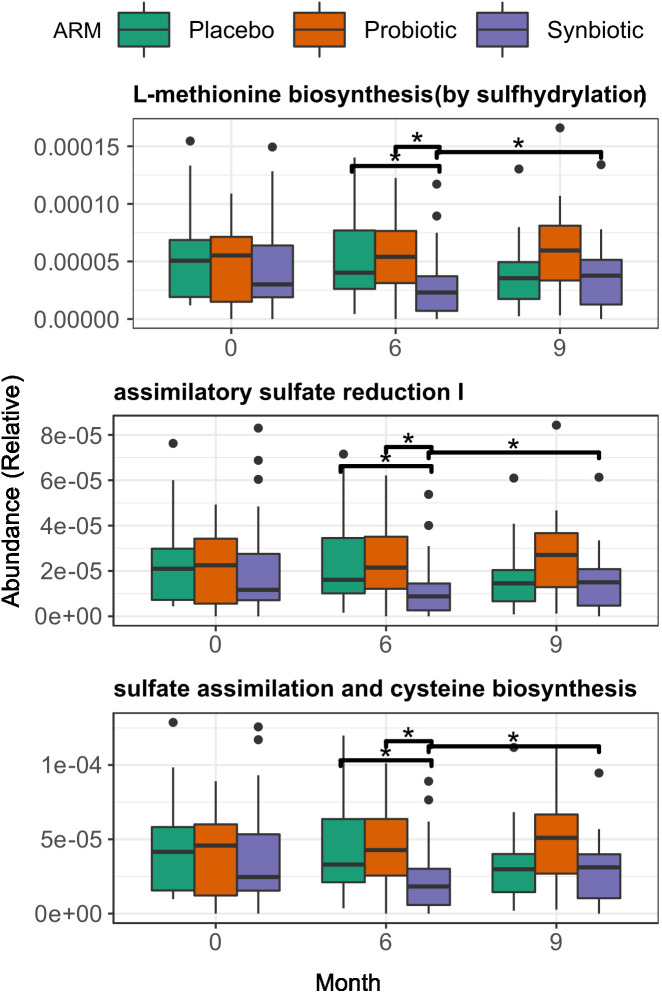
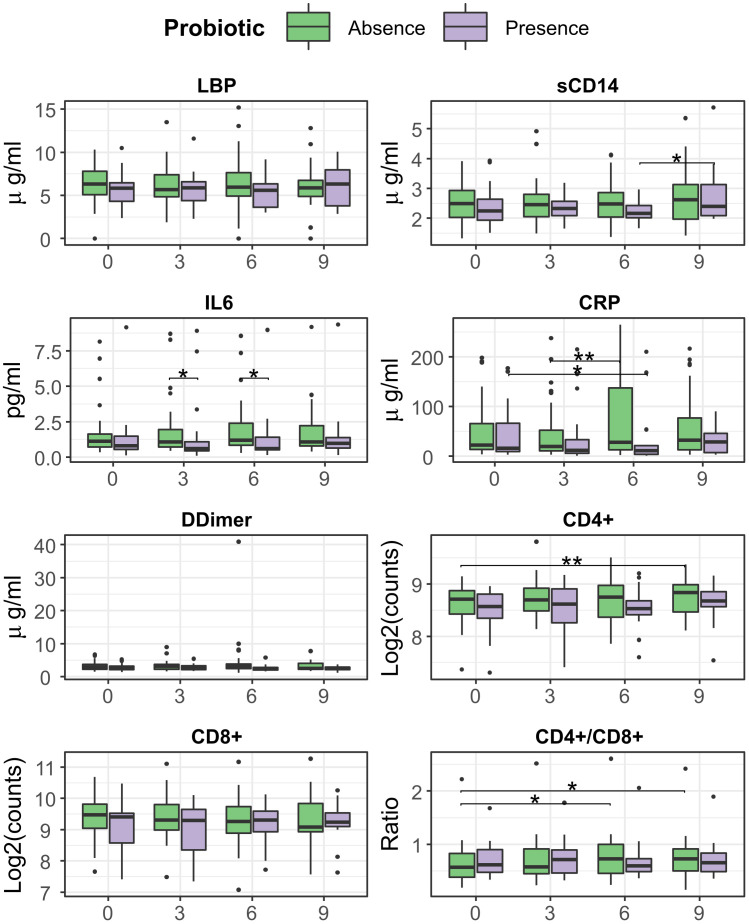
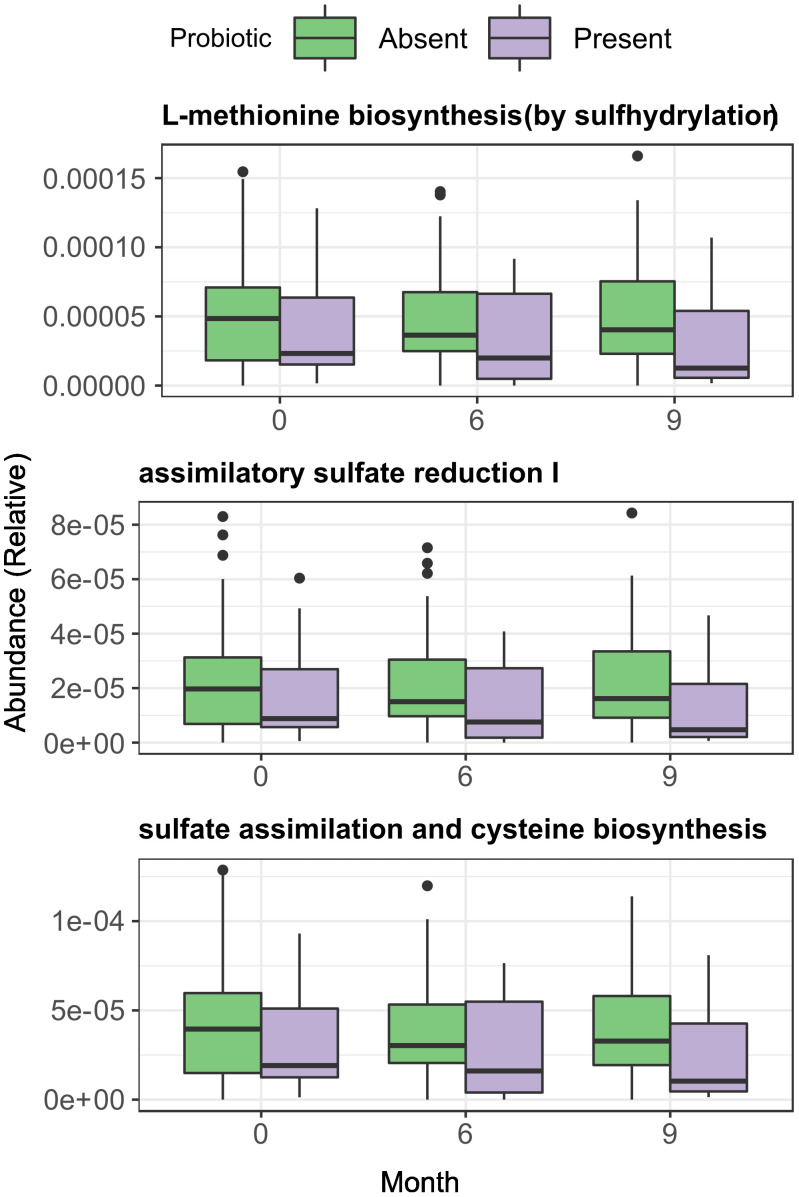
Results: Adverse event (AE) incidence was similar among groups (53%, 33%, and 55% in the Placebo, Probiotic and Synbiotic groups, respectively, the most common being grade 1 digestive AEs: flatulence, bloating and diarrhoea. Two grade 3 AEs were reported, all in the Synbiotic group: abdominal distension (possibly related) and malignant lung neoplasm (unrelated), and 1 grade 4 AE in the Placebo: hepatocarcinoma (unrelated). Synbiotic exposure was associated with a higher increase in CD4+/CD8+ T-cell (CD4/CD8) ratio at 6 months vs baseline (median=0.76(IQR=0.51) vs 0.72(0. 45), median change= 0.04(IQR=0.19), p = 0.03). At month 9, the Synbiotic group had a significant increase in CD4/CD8 ratio (0.827(0.55) vs 0.825(0.53), median change = 0.04(IQR=0.15), p= 0.02) relative to baseline, and higher CD4+ counts (447 (157) vs. 342(73) counts/ml, p = 0.03), and lower sCD14 values (2.16(0.67) vs 3.18(0.8), p = 0.008) than Placebo. No effect in immune parameters was observed in the Probiotic arm. None of the two interventions modified microbial gene richness (alpha diversity). However, intervention as categorical variable was associated with slight but significant effect on Bray-Curtis distance variance (Adonis R2 = 0.02, p = 0.005). Additionally, at month 6, Synbiotic intervention was associated with lower pathway abundances vs Placebo of Assimilatory Sulphate Reduction (8.79·10-6 (1.25·10-5) vs. 1.61·10-5 (2.77·10-5), p = 0.03) and biosynthesis of methionine (2.3·10-5 (3.17·10-5) vs. 4·10-5 (5.66·10-5), p = 0.03) and cysteine (1.83·10-5 (2.56·10-5) vs. 3.3·10-5 (4.62·10-5), p = 0.03). At month 6, probiotic detection in faeces was associated with significant decreases in C Reactive Protein (CRP) vs baseline (11.1(22) vs. 19.2(66), median change= -2.7 (13.2) ug/ml, p = 0.04) and lower IL-6 values (0.58(1.13) vs. 1.17(1.59) ug/ml, p = 0.02) when compared with samples with no detectable probiotic. No detection of the probiotic was associated with higher CD4/CD8 ratio at month 6 vs baseline (0.718(0.57) vs. 0.58(0.4), median change = 0.4(0.2), p = 0.02). After washout, probiotic non-detection was also associated with a significant increase in CD4+ counts (457(153) vs. 416(142), median change = 45(75), counts/ml, p = 0.005) and CD4/CD8 ratio (0.67(0.5) vs 0.59(0.49), median change = 0.04 (0.18), p = 0.02).
Conclusion: A synbiotic intervention with L. plantarum and P. acidilactici was safe and led to small increases in CD4/CD8 ratio and minor reductions in sCD14 of uncertain clinical significance. A probiotic with the same composition was also safe but did not achieve any impact on immune parameters or faecal microbiome composition.
Keywords: HIV; immune reconstitution; prebiotics; probiotics; synbiotics.
Copyright © 2022 Blázquez-Bondia, Parera, Català-Moll, Casadellà, Elizalde-Torrent, Aguiló, Espadaler-Mazo, Santos, Paredes and Noguera-Julian.
Conflict of interest statement
JE-M and MA are full-time employees of AB-BIOTICS SA, the company owning IP rights for the probiotic strains used in this study. MN-J is co-founder and shareholder of Nano1Health SL, outside the scope of the submitted work. The remaining authors declare that the research was conducted in the absence of any commercial or financial relationships that could be construed as a potential conflict of interest.
Figures
References
Publication types
MeSH terms
Substances
Associated data
LinkOut - more resources
Full Text Sources
Medical
Research Materials
Miscellaneous