

Macroeconomic consequences of the COVID-19 pandemic
- PMID: 36570545
- PMCID: PMC9768433
- DOI: 10.1016/j.econmod.2022.106147
Macroeconomic consequences of the COVID-19 pandemic
Abstract
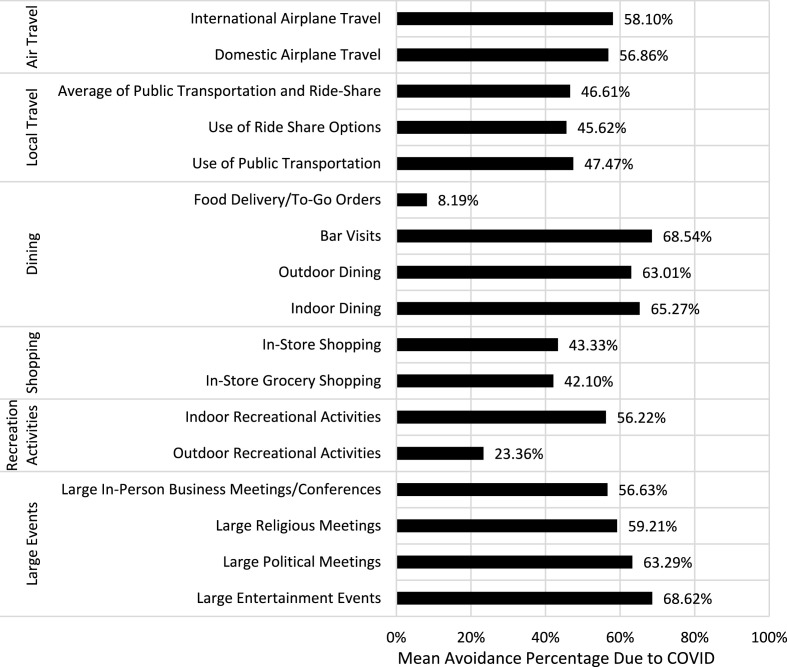
We estimate the economic impacts of COVID-19 in the U.S. using a disaster economic consequence analysis framework implemented by a dynamic computable general equilibrium (CGE) model. This facilitates identification of relative influences of several causal factors as "shocks" to the model, including mandatory business closures, disease spread trajectories, behavioral responses, resilience, pent-up demand, and government stimulus packages. The analysis is grounded in primary data on avoidance behavior and healthcare parameters. The decomposition of the influence of various causal factors will help policymakers offset the negative influences and reinforce the positive ones during the remainder of this pandemic and future ones.
Keywords: Avoidance behavior; CGE Modeling; COVID-19; Disaster economics; Resilience.
© 2022 Elsevier B.V. All rights reserved.
Figures
References
-
- Aguiar A., Chepeliev M., Corong E.L., McDougall R., van der Mensbrugghe D. The GTAP data base: version 10. Journal of Global Economic Analysis. 2019;4(1):1–27.
-
- American Journal of Managed Care, 2021 . 2021. A Timeline of COVID-19 Developments in 2020.
-
- Armantier O., Goldman L., Koşar G., Lu J., Pomerantz R., van der Klaauw W. 2020. How Have Households Used Their Stimulus Payments and How Would They Spend the Next? Federal Reserve Bank of New York [blog]
-
- Baker S.R., Farrokhnia R.A., Meyer S., Pagel M., Yannelis C. National Bureau of Economic Research; 2020. Income, Liquidity, and the Consumption Response to the 2020 Economic Stimulus Payments (No. W27097)
LinkOut - more resources
Full Text Sources
Research Materials
Miscellaneous
