. 2022 Dec 7:13:1017317.
doi: 10.3389/fpsyg.2022.1017317. eCollection 2022.

Introducing an adolescent cognitive maturity index

Affiliations

Introducing an adolescent cognitive maturity index

Shady El Damaty et al. Front Psychol. .

Abstract

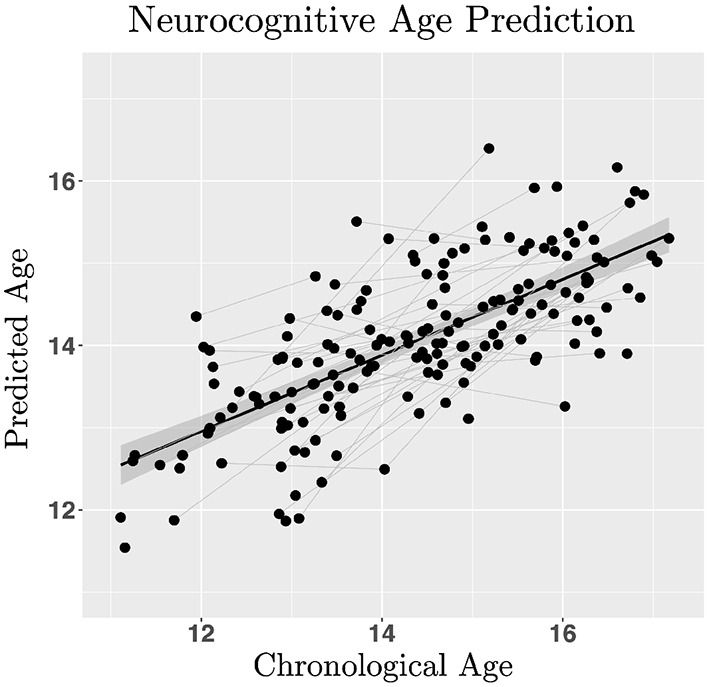
Children show substantial variation in the rate of physical, cognitive, and social maturation as they traverse adolescence and enter adulthood. Differences in developmental paths are thought to underlie individual differences in later life outcomes, however, there remains a lack of consensus on the normative trajectory of cognitive maturation in adolescence. To address this problem, we derive a Cognitive Maturity Index (CMI), to estimate the difference between chronological and cognitive age predicted with latent factor estimates of inhibitory control, risky decision-making and emotional processing measured with standard neuropsychological instruments. One hundred and forty-one children from the Adolescent Development Study (ADS) were followed longitudinally across three time points from ages 11-14, 13-16, and 14-18. Age prediction with latent factor estimates of cognitive skills approximated age within ±10 months (r = 0.71). Males in advanced puberty displayed lower cognitive maturity relative to peers of the same age; manifesting as weaker inhibitory control, greater risk-taking, desensitization to negative affect, and poor recognition of positive affect.

Keywords: adolescence; age prediction; cognitive development; dual systems model; maturity; regularized regression; structural equation model.


Conflict of interest statement

The authors declare that the research was conducted in the absence of any commercial or financial relationships that could be construed as a potential conflict of interest.

Figures

Figure 1
Figure 1
Signal detection theory metrics were used to estimate discriminative sensitivity (d') and overall response bias (ln β) for targets versus lures in the Continuous Performance Task (CPT). d' increased linearly with higher probability of a Correct Rejection (purple) and response to target (Hits, blue); and declined with greater False Alarm responses (yellow) and Miss rate (red) to targets (top). The probability of a Correct Rejection and response to target was a non-linear decreasing function of increasing response bias (bottom). Greater false alarm rates were indicative of elevated response bias and lower target-lure discrimination.
Figure 2
Figure 2
Structural equation model of latent factors underlying inhibitory control (ICLF), risky reward processing (RRLF), and responsivity to positively (EPLF) and negatively salient emotional faces (ENLF; RMSEA = 0.047, TLI = 0.926, CFI = 0.945). Inhibitory control was observed to be a significant effector of lower risk taking (p = 0.026) and responsivity to both negative (p = 0.007) and positive (p = 0.02) emotional faces. No significant relationship was observed between RRLF and EPLF/ENLF. The ENLF manifested as fast and accurate responses to negative emotions, whereas EPLF was an indicator of longer looking times leading to correct recognition. ICLF effected faster looking time to all emotions at the expense of recog- nizing happy face expressions. Paths are faded to indicate statistical significance and strength of association. Numerical edge labels provide standardized estimates.
Figure 3
Figure 3
Regularized regression was used to estimate neurocognitive age in a training sample with leave-one-out cross validation to estimate linear model hyper- parameters (lambda = 0.083; L2-norm ridge regression with alpha = 0) minimizing mean squared error for predicting age with inhibitory control, risk/reward processing and emotional processing latent factors in a test sample (50% participants split into train/test datasets). Model performance was assessed by computing the ratio between the mean cross-validated error and variance of observed age in the validation dataset (R2 = 0.51). The neurocognitive maturity index is computed by subtracting the predicted neurocognitive age from the chronological age.

References

    1. Aycheh H. M., Seong J.-K., Shin J.-H., Na D. L., Kang B., Seo S. W., et al. . (2018). Biological brain age prediction using cortical thickness data: a large scale cohort study. Front. Aging Neurosci. 10, 252. 10.3389/fnagi.2018.00252 - DOI - PMC - PubMed
    1. Babyak M. A. (2004). What you see may not be what you get: a brief, nontechnical introduction to overfitting in regression-type models. Psychosom. Med. 66, 411–421. 10.1097/00006842-200405000-00021 - DOI - PubMed
    1. Baker G. T., III., Sprott R. L. (1988). Biomarkers of aging. Exp. Gerontol. 23, 223–239. 10.1016/0531-5565(88)90025-3 - DOI - PubMed
    1. Bates D., Mächler M., Bolker B., Walker S. (2015). Fitting linear mixed-effects models using lme4. J. Stat. Softw. 67, 1–48. 10.18637/jss.v067.i01 - DOI
    1. Bollen K. A., Curran P. J. (2006). Latent Curve Models: A Structural Equation Perspective. John Wiley & Sons. 10.1002/0471746096 - DOI

LinkOut - more resources