. 2023 Feb 13;378(1870):20210367.
doi: 10.1098/rstb.2021.0367. Epub 2022 Dec 26.

Mapping the mental space of emotional concepts through kinematic measures of decision uncertainty

Affiliations

Mapping the mental space of emotional concepts through kinematic measures of decision uncertainty

Laura Barca et al. Philos Trans R Soc Lond B Biol Sci. .

Abstract

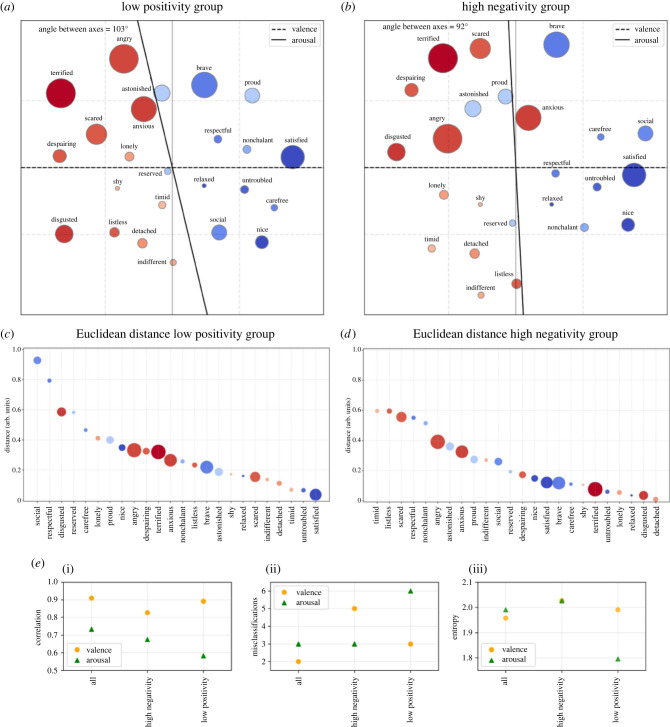
Emotional concepts and their mental representations have been extensively studied. Yet, some ecologically relevant aspects, such as how they are processed in ambiguous contexts (e.g., in relation to other emotional stimuli that share similar characteristics), are incompletely known. We employed a similarity judgement of emotional concepts and manipulated the contextual congruency of the responses along the two main affective dimensions of hedonic valence and physiological activation, respectively. Behavioural and kinematics (mouse-tracking) measures were combined to gather a novel 'similarity index' between emotional concepts, to derive topographical maps of their mental representations. Self-report (interoceptive sensibility, positive-negative affectivity, depression) and physiological measures (heart rate variability, HRV) have been collected to explore their possible association with emotional conceptual representation. Results indicate that emotional concepts typically associated with low arousal profit by contextual congruency, with faster responses and reduced uncertainty when contextual ambiguity decreases. The emotional maps recreate two almost orthogonal axes of valence and arousal, and the similarity measure captures the smooth boundaries between emotions. The emotional map of a subgroup of individuals with low positive affectivity reveals a narrower conceptual distribution, with variations in positive emotions and in individuals with reduced arousal (such as those with reduced HRV). Our work introduces a novel methodology to study emotional conceptual representations, bringing the behavioural dynamics of decision-making processes and choice uncertainty into the affective domain. This article is part of the theme issue 'Concepts in interaction: social engagement and inner experiences'.

Keywords: decision uncertainty; emotional concepts; interoception; mental map; mouse-tracking; similarity judgement task.


Conflict of interest statement

The authors declare that the research was conducted in the absence of any commercial or financial relationships that could be construed as a potential conflict of interest.

Figures

Figure 1.
Figure 1.
Raincloud plots combining a split-half violin, raw jittered data points and a standard visualization of central tendency with boxplot of the response time for valence (a) and arousal (b) dimensions. Cong0, no congruency between target and responses; Cong1, target congruent with one response; Cong2, target congruent with both responses.
Figure 2.
Figure 2.
Mouse trajectories (averaged) as a function of valence (a,b) and arousal (c,d). Trajectories have been remapped to the right, for ease of comparison. Note that the plots show that in three of the four cases (i.e., negative valence, positive valence, low arousal, but not high arousal) the Cong0 trajectories show a graded attraction towards the non-selected alternative, which is an index of greater choice uncertainty.
Figure 3.
Figure 3.
Two-dimensional map of emotional concepts of the whole participant group (30 participants), based on the similarity task averaged distance between stimuli. Colour-coding indicates valence (blue: pleasant; red: unpleasant) and size of the node indicates arousal associated with the emotion (big: high arousal; small: low arousal). Each axis is the line centred in the origin (set at the barycentre of the nodes/stimuli) with an orientation that maximizes the spread of the projection of the arousal (or valence) values of the stimuli on the axis (i.e. the Pearson correlation between the axis and the arousal (or valence) values of the stimuli).
Figure 4.
Figure 4.
Results for the low positivity and high negativity groups. (a,b) Two-dimensional maps of the emotional space based on the similarity task averaged distance between stimuli for the (a) low positivity group, and (b) high negativity group. (c,d) Distance between the location of each emotional concept in the map of the whole participant group and the map of the (c) low positivity (i.e., the Euclidean distance of each item in the valence–arousal plane of the two groups) and (d) high negativity group. (e) Pearson correlations between the scores of valence or arousal and the projections on the two respective axes. This and the following indexes are calculated for the maps of different participant groups: all participants, participants with high negativity, and those with low positivity. (i) A higher correlation indicates that emotional concepts are better aligned along the axis. (ii) Misclassification of emotional concepts for the different participant groups. (iii) Entropy of the concepts across the valence and arousal dimensions. Entropy is calculated as the spread of concepts, separately for each axis, and is an index representing whether nodes span a large or small portion of the dimension.
Figure 5.
Figure 5.
Mental maps of emotional concepts of participants with different levels of HRV/RMSSD. (a,b) Two-dimensional maps of the emotional space based on the similarity task averaged distance between stimuli for the (a) low RMSSD, and (b) for high RMSSD groups. (c,d) Distance between the location of each emotional concept in the map of the whole participant group and the map of the (c) low RMSSD and (d) high RMSSD groups. (e) (i) Pearson correlations between the scores of valence or arousal and the projections on the two respective axes. This and the following indexes are calculated for the maps of different participant groups: all participants, participants with low RMSSD, and those with high RMSSD. (ii) Misclassification of emotional concepts for the different participant groups. (iii) Entropy of the concepts across the valence and arousal dimensions.

References

    1. Barrett LF. 2006. Are emotions natural kinds? Perspect. Psychol. Sci. 1, 28-58. (10.1111/j.1745-6916.2006.00003.x) - DOI - PubMed
    1. Barrett LF. 2017. How emotions are made: the secret life of the brain. New York, NY: Houghton Mifflin Harcourt.
    1. Posner J, Russell JA, Peterson BS. 2005. The circumplex model of affect: an integrative approach to affective neuroscience, cognitive development, and psychopathology. Dev. Psychopathol 17, 715-734. (10.1017/S0954579405050340) - DOI - PMC - PubMed
    1. Russell JA. 1980. A circumplex model of affect. J. Pers. Social Psychol. 39, 1161-1178. (10.1037/h0077714) - DOI
    1. Barrett LF, Fossum T. 2001. Mental representations of affect knowledge. Cogn. Emot. 15, 333-363. (10.1080/02699930125711) - DOI

Publication types

LinkOut - more resources