. 2023 Mar;31(2):156-170.
doi: 10.1111/wrr.13068. Epub 2023 Jan 16.

Transcriptional changes in human palate and skin healing

Affiliations

Transcriptional changes in human palate and skin healing

Trevor R Leonardo et al. Wound Repair Regen. 2023 Mar.

Abstract

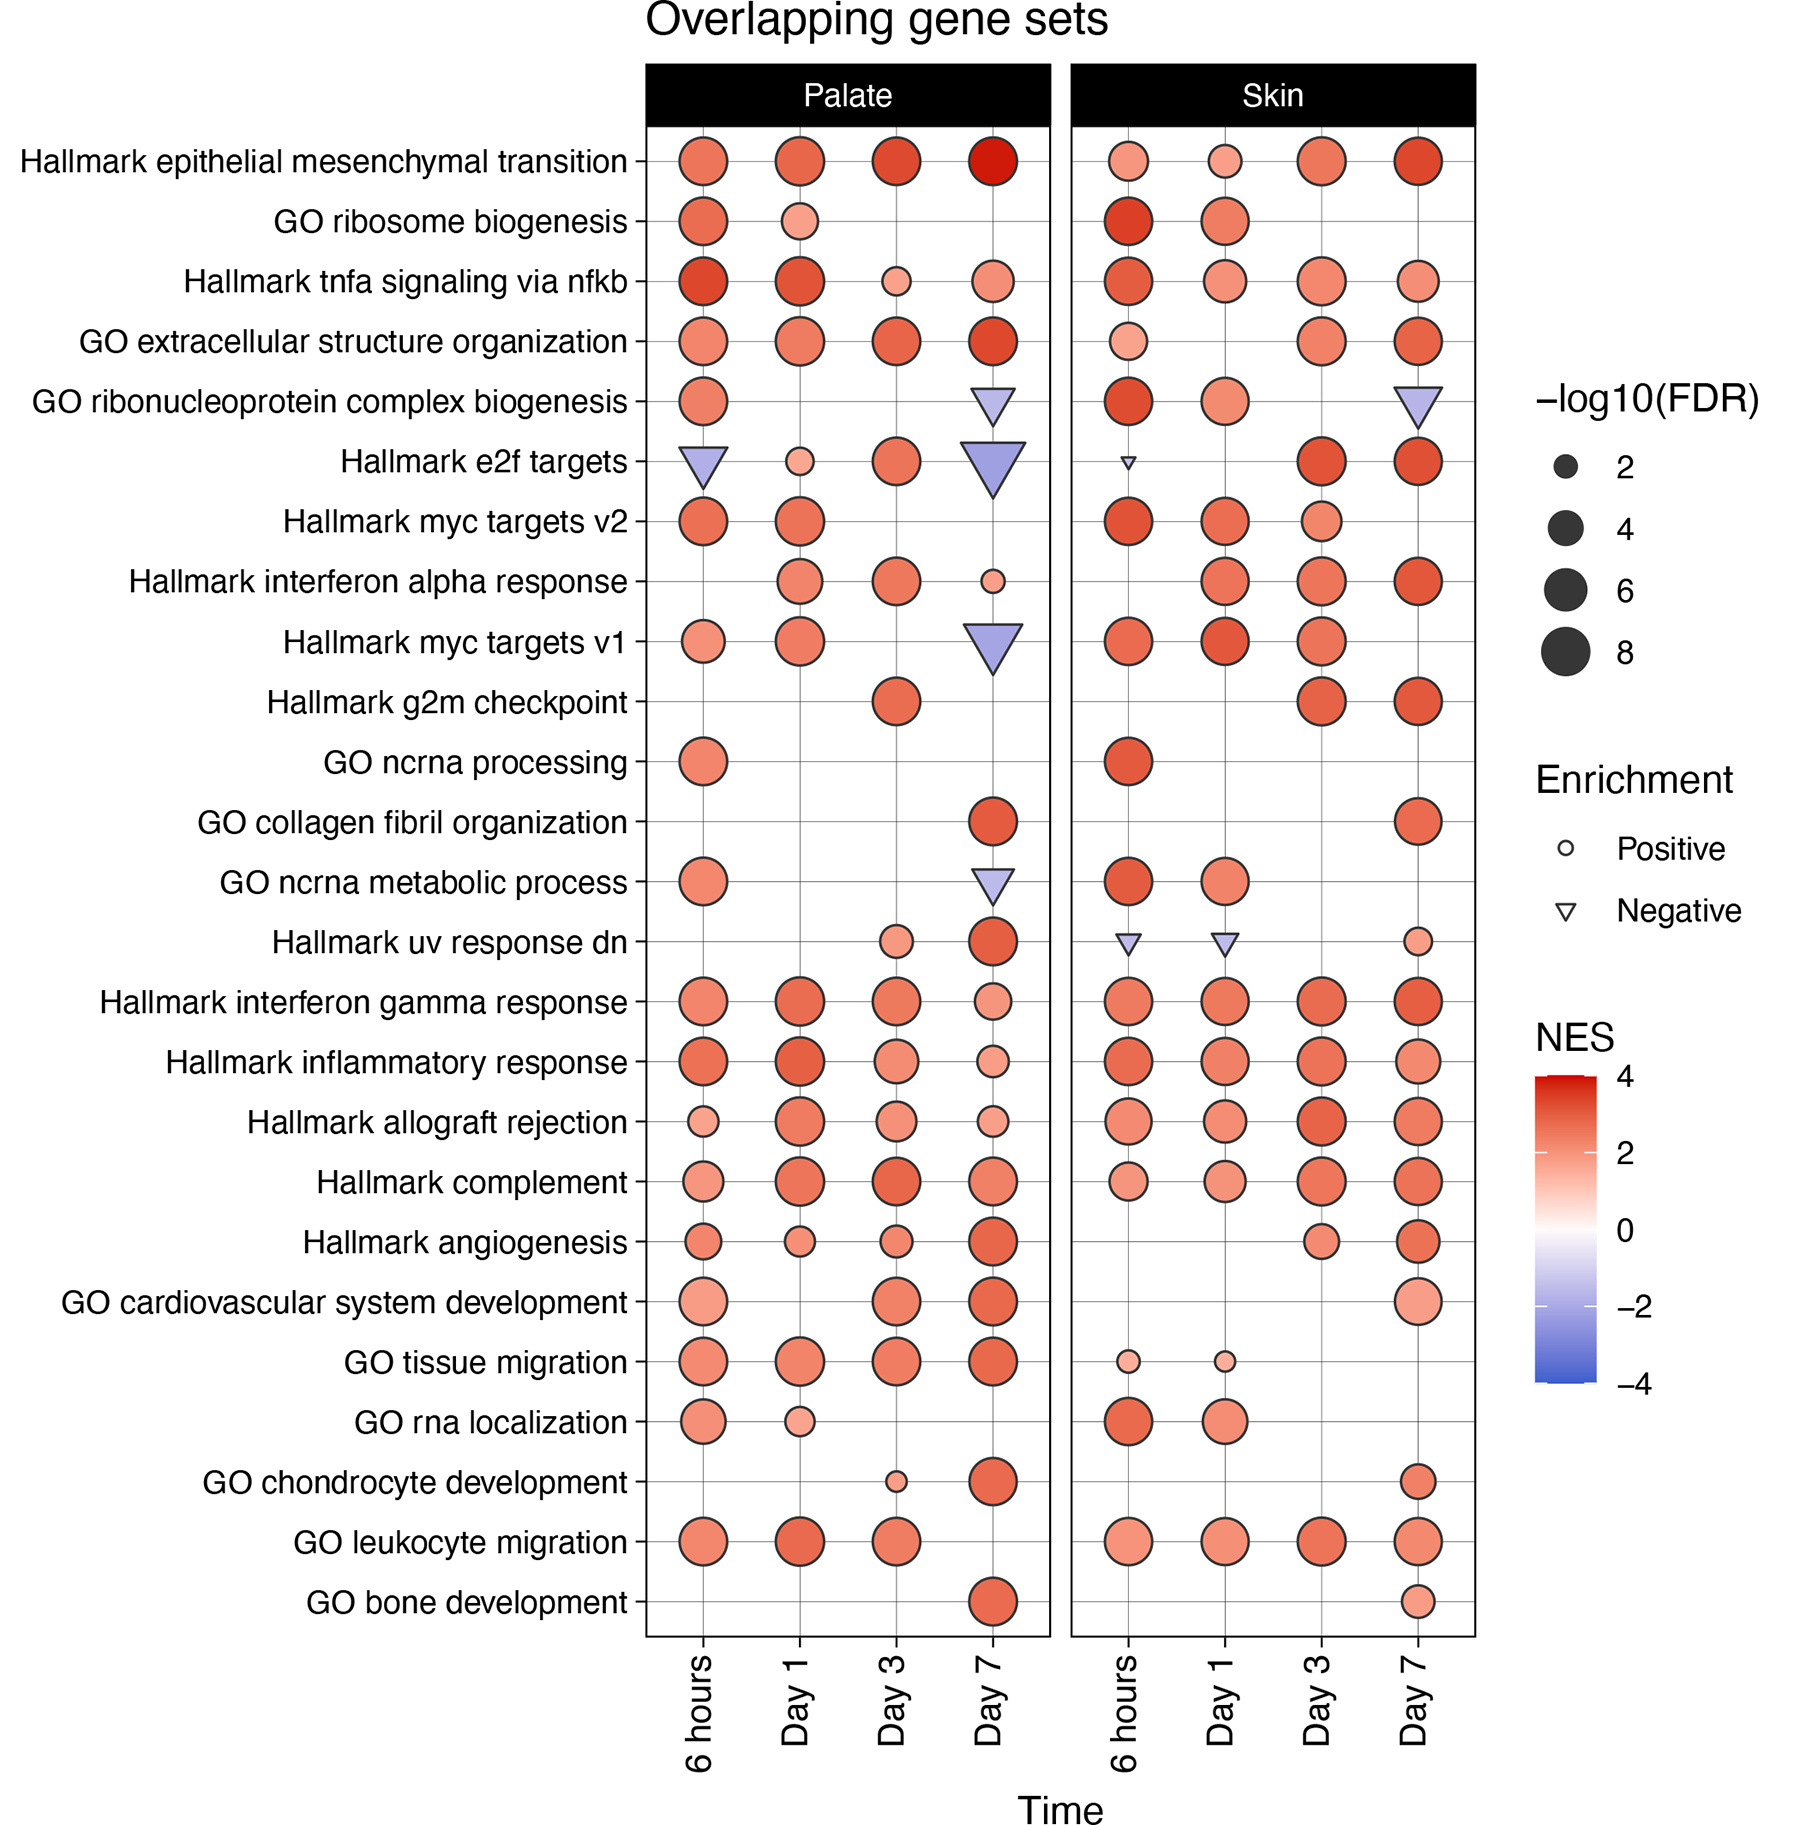
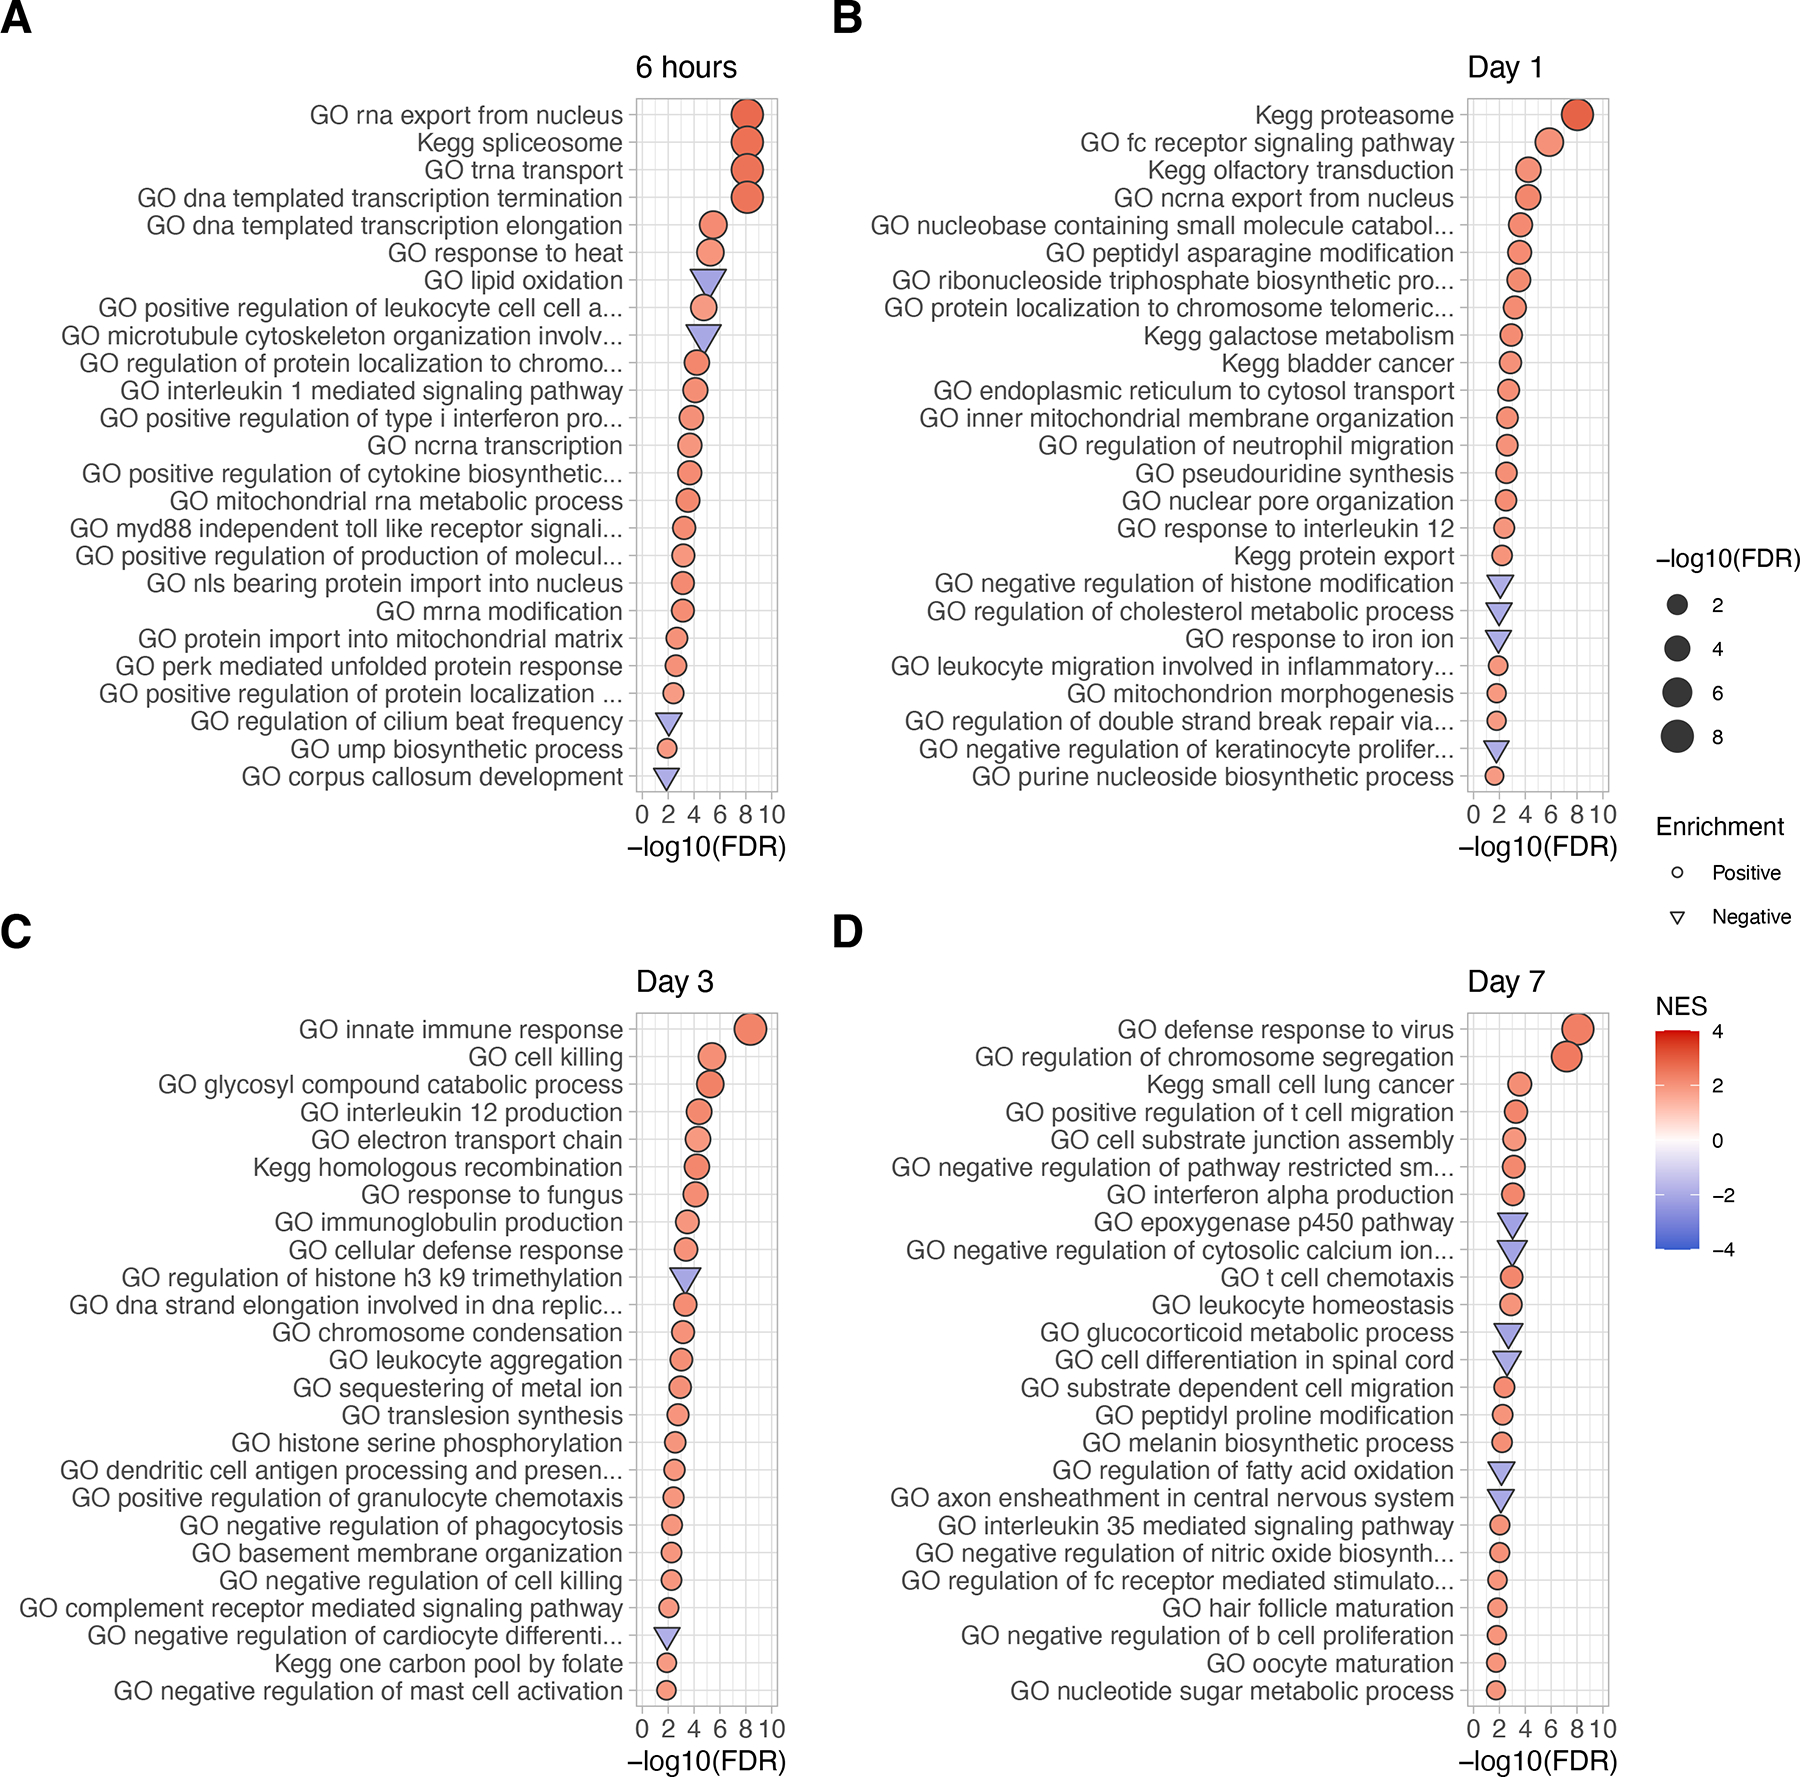
Most human tissue injuries lead to the formation of a fibrous scar and result in the loss of functional tissue. One adult tissue that exhibits a more regenerative response to injury with minimal scarring is the oral mucosa. We generated a microarray gene expression dataset to examine the response to injury in human palate and skin excisional biopsies spanning the first 7 days after wounding. Differential expression analyses were performed in each tissue to identify genes overexpressed or underexpressed over time when compared to baseline unwounded tissue gene expression levels. To attribute biological processes of interest to these gene expression changes, gene set enrichment analysis was used to identify core gene sets that are enriched over the time-course of the wound healing process with respect to unwounded tissue. This analysis identified gene sets uniquely enriched in either palate or skin wounds and gene sets that are enriched in both tissues in at least one time point after injury. Finally, a cell type enrichment analysis was performed to better understand the cell type distribution in these tissues and how it changes over the time course of wound healing. This work provides a source of human wound gene expression data that includes two tissue types with distinct regenerative and scarring phenotypes.

Keywords: genomics; oral mucosa; palate; skin; wound healing.


Conflict of interest statement

Conflict of Interest

The authors declare no conflicts of interest.

Figures

Figure 1.
Figure 1.. Study overview
Longitudinal excisional biopsies (1×5 mm) were placed in palate or skin and samples were collected (2×5 mm) at specific time points after injury. Each subject and the corresponding biopsies that were analyzed for this study are indicated by the grey boxes in the Collected Samples section. Microarrays were generated from RNA for a total of 96 samples. Differential expression analyses using LIMMA were done on a tissue-specific basis to compare each time point after injury to the respective unwounded tissue. Pre-ranked gene set enrichment analysis was done to identify functional changes in response to injury in palate and skin. A cell type enrichment analysis was performed to look at changes in cell type distribution at each time point after injury compared to unwounded palate and skin.
Figure 2.
Figure 2.. Comparative analysis of transcriptomic response to injury
A) Principal component analysis plot of microarray gene expression data. Each sample is represented by a point on the graph. Color represents time after injury with 0 representing unwounded tissue. The shape of each point represents tissue type. The x- and y-axis are the first and second principal components, respectively. B) Heatmap and dendrogram representing similarities of the mean gene expression profiles grouped by tissue and time point. A Pearson’s correlation coefficient based on the computed Euclidean distance matrix and hierarchical clustering using the complete agglomeration method were performed. Groups are denoted on both axes of the heatmap and adjacent to the dendrogram. Heatmap color and numbers within each square represent the correlation coefficients. C) Heatmap and dendrogram representing the similarities of t-statistics generated from the LIMMA differential expression contrasts. A Pearson’s correlation coefficient based on the computed Euclidean distance matrix and hierarchical clustering using the complete agglomeration method were performed. Groups are denoted on both axes of the heatmap and adjacent to the dendrogram. Heatmap color and numbers within each square represent the correlation coefficients. D) Upset plot displaying the overlap between gene expression changes over time in response to injury in palate and skin. The set size bar plot on the bottom left of the diagram represents the total number of unique genes significantly differentially overexpressed or underexpressed in palate or skin at any point in time after injury (FDR ≤ 0.05), with each row denoted by the group label. The intersection size and corresponding bar plot indicate the number of genes that are in each intersection. Solid black circles under each bar plot indicate which of the four groups are included in that specific intersection. Only intersections that demonstrated conserved or unique responses to injury in palate and skin were shown for clarity.
Figure 3.
Figure 3.. Transcriptomic trends in tissue repair in human palate and skin
A) Differential expression results for each LIMMA comparison were filtered for significance by an adjusted p-value ≤ 0.05 and an absolute log2FC ≥ 1. The average gene expression for each group (based on tissue and time point) were used to perform K-means clustering (k=5). For each cluster, a line plot of the mean expression of genes (y-axis) at each time point representing hours after injury (x-axis) was made. Unwounded tissue is represented by time 0. Clusters are denoted by titles above each plot, with orange lines representing palate and green lines representing skin. B) Heatmaps of each of the five identified clusters using the mean gene expression for each group (based on tissue and time point) were generated. Rows are hierarchically clustered using Euclidean distance and the Complete agglomeration method. Unwounded tissue is represented by time 0. Each row represents a gene, and each column represents the average expression of that gene for the specified group. Tissue type is represented on the top of the columns by palate in orange and skin in green.
Figure 4.
Figure 4.. Overlapping gene sets enriched in both palate and skin
Bubble plot representing the gene sets enriched in both palate and skin at a specific time point after injury when compared to the respective uninjured tissue. The left panel represents palate, and the right panel represents skin, with each column representing the time point after injury. Rows are labeled by the enriched gene set name and are ranked in descending order of their NES. Presence of a circle indicates the gene set was enriched at that time point in that tissue. Color gradient indicates the NES and bubble size indicates the statistical significance -log10(FDR). Bubble shape of circle or triangle represent gene sets positively or negatively enriched at that time point after injury compared to unwounded tissue, respectively. A BH adjusted p-value of ≤ 0.05 was used as the threshold for statistical significance.
Figure 5.
Figure 5.. Tissue-specific gene sets enriched at multiple time points after injury
Bubble plot representing the gene sets enriched specifically in A) palate or B) skin at multiple time points after injury when compared to the respective uninjured tissue. The left panel represents palate, and the right panel represents skin, with each column representing the time point after injury. Rows are labeled by the enriched gene set name and are ranked in descending order of their NES. Presence of a circle indicates the gene set was enriched at that time point in that tissue. Color gradient indicates the NES and bubble size indicates the statistical significance -log10(FDR). Bubble shape of circle or triangle represent gene sets positively or negatively enriched at that time point after injury compared to unwounded tissue, respectively. A BH adjusted p-value of ≤ 0.05 was used as the threshold for statistical significance.
Figure 6.
Figure 6.. Time-point specific enriched gene sets in palate
Bubble plots representing the top 25 gene sets enriched uniquely in palate and only at the indicated time point after injury when compared to the respective uninjured tissue. Rows are labeled by the enriched gene set name and are ranked in descending order of their adjusted p-value. Color gradient indicates the NES, x-axis and bubble size represent the -log10(FDR). Bubble shape of circle or triangle represent gene sets positively or negatively enriched at that time point after injury compared to unwounded tissue, respectively. Each plot represents a time point after injury either A) 6 hours, B) Day 1, C) Day 3, or D) Day 7. A BH adjusted p-value of ≤ 0.05 was used as the threshold for statistical significance.
Figure 7.
Figure 7.. Time-point specific enriched gene sets in skin
Bubble plots representing the top 25 gene sets enriched uniquely in skin and only at the indicated time point after injury when compared to the respective uninjured tissue. Rows are labeled by the enriched gene set name and are ranked in descending order of their adjusted p-value. Color gradient indicates the NES, x-axis and bubble size represent the -log10(FDR). Bubble shape of circle or triangle represent gene sets positively or negatively enriched at that time point after injury compared to unwounded tissue, respectively. Each plot represents a time point after injury either A) 6 hours, B) Day 1, C) Day 3, or D) Day 7. A BH adjusted p-value of ≤ 0.05 was used as the threshold for statistical significance.
Figure 8.
Figure 8.. Cell type enrichment analysis in palate and skin tissue injury
Results from the xCell deconvolution analysis were first filtered for statistical significance (p-value ≤ 0.2). Boxplots representing the estimated cell type proportion (y-axis) at each point in time after injury in palate or skin (x-axis) were generated for each cell type (denoted by panel title). Colors represent the time point after injury, with 0 representing unwounded tissue. Each circle within each boxplot represents a specific sample. Boxplots that do not appear for a specific tissue and time point indicate that none of the samples from the xCell analysis met statistical significance for that group.

References

    1. Szpaderska AM, Zuckerman JD, DiPietro LA. Differential injury responses in oral mucosal and cutaneous wounds. J Dent Res 2003;82(8):621–6. - PubMed
    1. Szpaderska AM, Walsh CG, Steinberg MJ, DiPietro LA. Distinct patterns of angiogenesis in oral and skin wounds. J Dent Res 2005;84(4):309–14. - PubMed
    1. Warburton G, Nares S, Angelov N, Brahim JS, Dionne RA, Wahl SM. Transcriptional events in a clinical model of oral mucosal tissue injury and repair. Wound Repair Regen 2005;13(1):19–26. - PubMed
    1. Chen L, Arbieva ZH, Guo S, Marucha PT, Mustoe TA, DiPietro LA. Positional differences in the wound transcriptome of skin and oral mucosa. BMC genomics 2010;11:471. - PMC - PubMed
    1. Turabelidze A, Guo S, Chung AY, Chen L, Dai Y, Marucha PT, et al. Intrinsic differences between oral and skin keratinocytes. PLoS One 2014;9:e101480. - PMC - PubMed

Publication types