. 2023 Feb;102(2):102380.
doi: 10.1016/j.psj.2022.102380. Epub 2022 Dec 5.

Functional and miRNA regulatory characteristics of INSIG genes highlight the key role of lipid synthesis in the liver of chicken (Gallus gallus)

Affiliations

Functional and miRNA regulatory characteristics of INSIG genes highlight the key role of lipid synthesis in the liver of chicken (Gallus gallus)

Yaxin Yue et al. Poult Sci. 2023 Feb.

Abstract

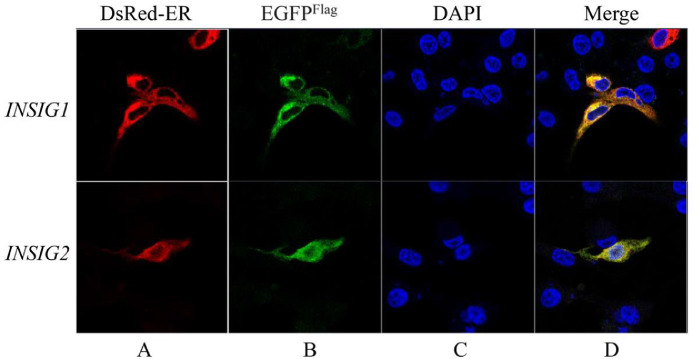
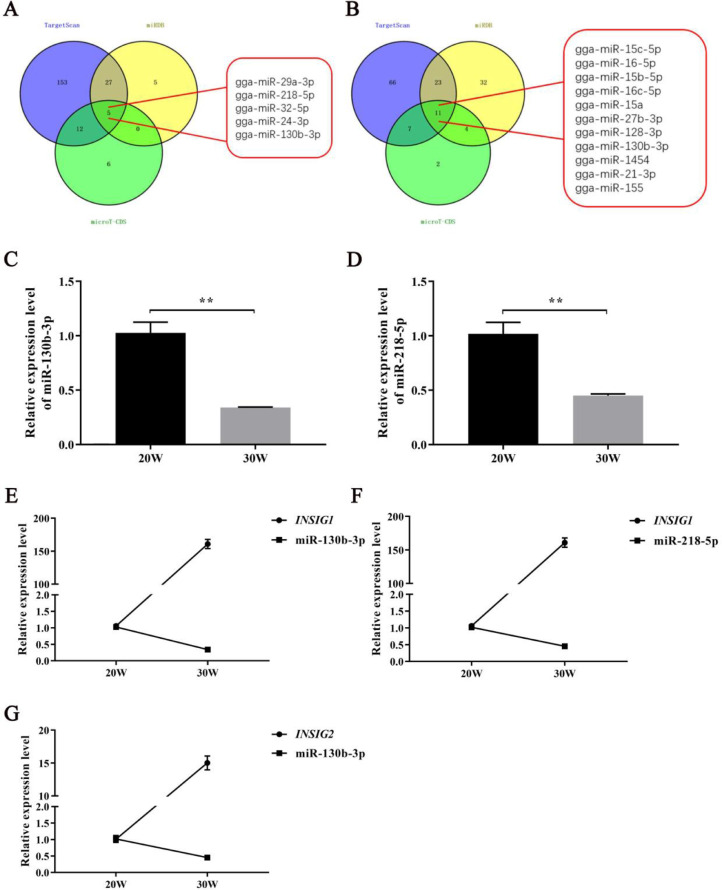
The insulin-induced genes (INSIG1 and INSIG2) have been demonstrated to play a vital role in regulating lipid metabolism in mammals, however the function and regulation mechanism of them remains unknown in poultry. In this study, firstly the phylogenetic trees of INSIGs among various species were constructed and their subcellular locations were mapped in chicken LMH. Then the spatiotemporal expression profiles, over-expression and knockdown assays of chicken INSIGs were conducted. Furthermore, conservation of potential miRNA binding sites in INSIGs among species were analyzed, and the miRNA biological function and regulatory role were verified. The results showed that chicken INSIGs located in cellular endoplasmic reticulum, and were originated from the common ancestors of their mammalian counterparts. The INSIGs were widely expressed in all detected tissues, and their expression levels in the liver of chicken at 30 wk were significantly higher than that at 20 wk (P < 0.01). Over-expression of INSIGs led no significant increase in mRNA abundance of lipid metabolism-related genes and the contents of triacylglycerol (TG) and cholesterol (TC) in LMH cells. Knockdown of INSIG1 led to the decreased expressions of ACSL1, MTTP-L, ApoB, ApoVLDLII genes and TG, TC contents (P < 0.05). Knockdown of INSIG2 could significantly decrease the contents of TG and TC, and expressions of key genes related to the lipid metabolism (P < 0.05). Moreover, INSIG1 was directly targeted by both miR-130b-3p and miR-218-5p, and INSIG2 was directly targeted by miR-130b-3p. MiR-130b-3p mimic and miR-218-5p mimic treatment could significant decrease the mRNA and protein levels of INSIGs, mRNA levels of genes related to lipid metabolism, and the contents of TG and TC in LMH cells. The inhibition of miR-130b-3p and miR-218-5p on TG and TC contents could be restored by the overexpression of INSIGs, respectively. No significant alteration in expressions of sterol regulatory element binding protein (SREBPs) and SREBP cleavage-activating protein (SCAP) were observed when INSIGs were over-expressed. SCAP was down-regulated when INSIG1 was knocked down, while SREBP1 was down-regulated when INSIG2 was knocked down. Taken together, these results highlight the role of INSIG1 and INSIG2 in lipid metabolism and their regulatory mechanism in chicken.

Keywords: INSIG; chicken; lipid metabolism; liver; miRNA.


Figures

Figure 1
Figure 1
Phylogenetic trees of INSIG1 and INSIG2 among species. (A) The phylogenetic tree of INSIG1; (B) The phylogenetic tree of INSIG2.
Figure 2
Figure 2
Subcellular localization of INSIG1 and INSIG2 protein in chicken LMH cell. (A) The endoplasmic reticulum of cell labled by dsred; (B) The locations of INSIG1 and INSIG2 proteins labeled by EGFP; (C) The cell nucleus labeled by DAPI; (D) The co-localization of the INSIGs protein, endoplasmic reticulum and nucleus.
Figure 3
Figure 3
The spatial-expressions of INSIG1 and INSIG2 in different tissues and ages. (A, B) Tissue expression profiles of INSIG1 and INSIG2 in chicken at the age of 30wk (W); (C, D) Expression patterns of chicken INSIG1 and INSIG2 in chicken liver at different laying periods. β-Actin was used as the referenced gene to estimate mRNA. Data are presented as Mean± SEM (n= 6 for each group), *P< 0.05, **P< 0.01.
Figure 4
Figure 4
Effects of INSIG1 and INSIG2 overexpression on intracellular TG, TC contnts and relevant genes expressions in LMH cells. (A, B) Overexpression efficiencies of INSIG1 and INSIG2; (C, D) Effects of INSIGs overexpression on intracellular TG and TC contents; (E, F) Effects of INSIG1 and INSIG2 overexpression on expression of genes related to triglyceride synthesis, cholesterol synthesis and lipid transport. NC: pcDNA3.1-EGFP; INSIG1: pcDNA3.1-EGFP-INSIG1; INSIG2: pcDNA3.1- EGFP-INISG2. β-Actin was used as the reference gene. Data are expressed as mean ± SEM (n = 3); *P < 0.05, ⁎⁎P < 0.01.and ns means P > 0.05.
Figure 5
Figure 5
Effects of INSIG1 and INSIG2 knockdown on intracellular TG, TC contents and relevant genes expressions in LMH cells. (A, B) Knockdown efficiencies of INSIG1 and INSIG2; (C, D) Effects of INSIGs knockdown on intracellular TG and TC contents; (E, F) Effects of INSIG1 and INSIG2 knockdown on expression of genes related to triglyceride synthesis, cholesterol synthesis and lipid transport. NC: siNC; INSIG1: siINSIG1; INSIG2: siINISG2. β-Actin was used as the reference gene. Data are expressed as mean ± SEM (n = 3);*P < 0.05, ⁎⁎P < 0.01.and ns means P > 0.05.
Figure 6
Figure 6
Screening of miRNAs bind with INSIG1 and INSIG2. (A) Prediction results of INSIG1 target miRNAs; (B) Prediction results of INSIG2 target miRNAs; (C) The relative expression level of miR-130b-3p in laying hens at 20 wk (W) and 30 wk (W); (D) The relative expression level of miR-218-5p in laying hens at 20 wk (W) and 30 wk (W); (E, F) Comparisons of miR-130b-3p expression with INSIG1 and INSIG2 expression; (G) Comparison of miR-218b-5p expression and INSIG1 expression. β-Actin used as the reference gene of mRNA, and U6 as the reference of miRNA. Data are expressed as mean ± SEM (n = 6); ⁎⁎P < 0.01.
Figure 7
Figure 7
Validation of targeting relationship between miR-130b-3p, miR-218-5p and INSIG1, INSIG2. (A, B) Conservative analysis of miR-130b-3p and miR-218-5p binding sites in the 3’UTR of INISG1 among species; (C, D) The potential binding site of miR-130b-3p in the 3’UTR of INISG2; (E) Validation of the interaction between miR-130b-3p and INISG1 by dual-luciferase reporter system; (F) Validation of the interaction between miR-218-5p and INISG1 by dual-luciferase reporter system; (G, H) Validation of the two interaction sites between miR-130b-3p and INISG2 by dual-luciferase reporter system. ⁎⁎P < 0.01.
Figure 8
Figure 8
Effects of miR-130b-3p and miR-218-5p on expression of INSIG1, INSIG2 and other relevent genes, and intracellular contents of TG and TC. (A, B) Overexpression efficiencies of miR-130b-3p and miR-218-5p in LMH; (C) Effects of miR-130b-3p and miR-218-5p overexpression on INSIG1 gene expression; (D) Effect of miR-130b-3p overexpression on INSIG2 gene expression; (E, F) Effects of miR-130b-3p and miR-218-5p overexpression on intracellular TG and TC contents; (G) Effects of miR-130b-3p and miR-218-5p overexpression on gene related with triglyceride, cholesterol synthesis and lipid transport. β-Actin used as the reference gene of mRNA, and U6 as the reference of miRNA. Data are expressed as mean ± SEM (n = 6); *P < 0.05, ⁎⁎P < 0.01.and ns means P > 0.05.
Figure 9
Figure 9
INSIGs mediated the inhibitory effect of miR-130b-3p and miR-218-5p on TC and TG synthesis in LMH cells. (A) Western blot shows the effect of co-expression of miR-130b-3p or miR-218-5p and INSIG1 onprotein levels of INSIG1 in LMH cells; (B) Effects on intracellular TG content after co-transfection of miR-130b-3p mimic and pcDNA3.1-INSIG1, and miR-218-5p mimic and pcDNA3.1-INSIG1, respectively; (C) Effects on intracellular TC content after co-transfection of miR-130b-3p mimic and pcDNA3.1-INSIG1, and miR-218-5p mimic and pcDNA3.1-INSIG1, respectively. Data represent mean ± SEM. (n = 3); *P < 0.05, ⁎⁎P < 0.01.
Figure 10
Figure 10
Effect of INSIGs on the expression levels of SCAP and SREBP1, SREBP2. (A) Effects of INSIG1 overexpression on expression of SCAP and SREBP1, SREBP2; (B) Effects of INSIG2 overexpression on expression of SCAP and SREBP1, SREBP2; (C) Effects of INSIG1 knockdown on expression of SCAP and SREBP1, SREBP2; (D) Effects of INSIG2 knockdown on expression of SCAP and SREBP1, SREBP2; (E) Effects of miR-130b-3p and miR-218-5p overexpression on expression of SCAP, respectively; (F) Effects of miR-130b-3p and miR-218-5p overexpression on expression of SREBP1, respectively; (G) Effects of miR-130b-3p and miR-218-5p overexpression on expression of SREBP2, respectively. β-Actin used as the reference gene of mRNA, and U6 as the reference of miRNA. Data are expressed as mean ± SEM (n = 6); *P < 0.05, ⁎⁎P < 0.01.and ns means P > 0.05.

Similar articles

References

    1. Desvergne B., Michalik L., Wahli W. Transcriptional regulation of metabolism. Physiol. Rev. 2006;86:465–514. - PubMed
    1. Ding J., Li M., Wan X., Jin X., Chen S., Yu C., Li Y. Effect of miR-34a in regulating steatosis by targeting PPARα expression in nonalcoholic fatty liver disease. Sci. Rep. 2015;5:13729. - PMC - PubMed
    1. Dong X.Y., Tang S.Q., Chen J.D. Dual functions of Insig proteins in cholesterol homeostasis. Lipids Health Dis. 2012;11:173. - PMC - PubMed
    1. Engelking L.J., Kuriyama H., Hammer R.E., Horton J.D., Brown M.S., Goldstein J.L., Liang G. Overexpression of Insig-1 in the livers of transgenic mice inhibits SREBP processing and reduces insulin-stimulated lipogenesis. J. Clin. Invest. 2004;113:1168–1175. - PMC - PubMed
    1. Engelking L.J., Liang G., Hammer R.E., Takaishi K., Kuriyama H., Evers B.M., Li W.P., Horton J.D., Goldstein J.L., Brown M.S. Schoenheimer effect explained–feedback regulation of cholesterol synthesis in mice mediated by Insig proteins. J. Clin. Invest. 2005;115:2489–2498. - PMC - PubMed