

Explaining the black-box smoothly-A counterfactual approach
- PMID: 36571975
- PMCID: PMC9835100
- DOI: 10.1016/j.media.2022.102721
Explaining the black-box smoothly-A counterfactual approach
Abstract
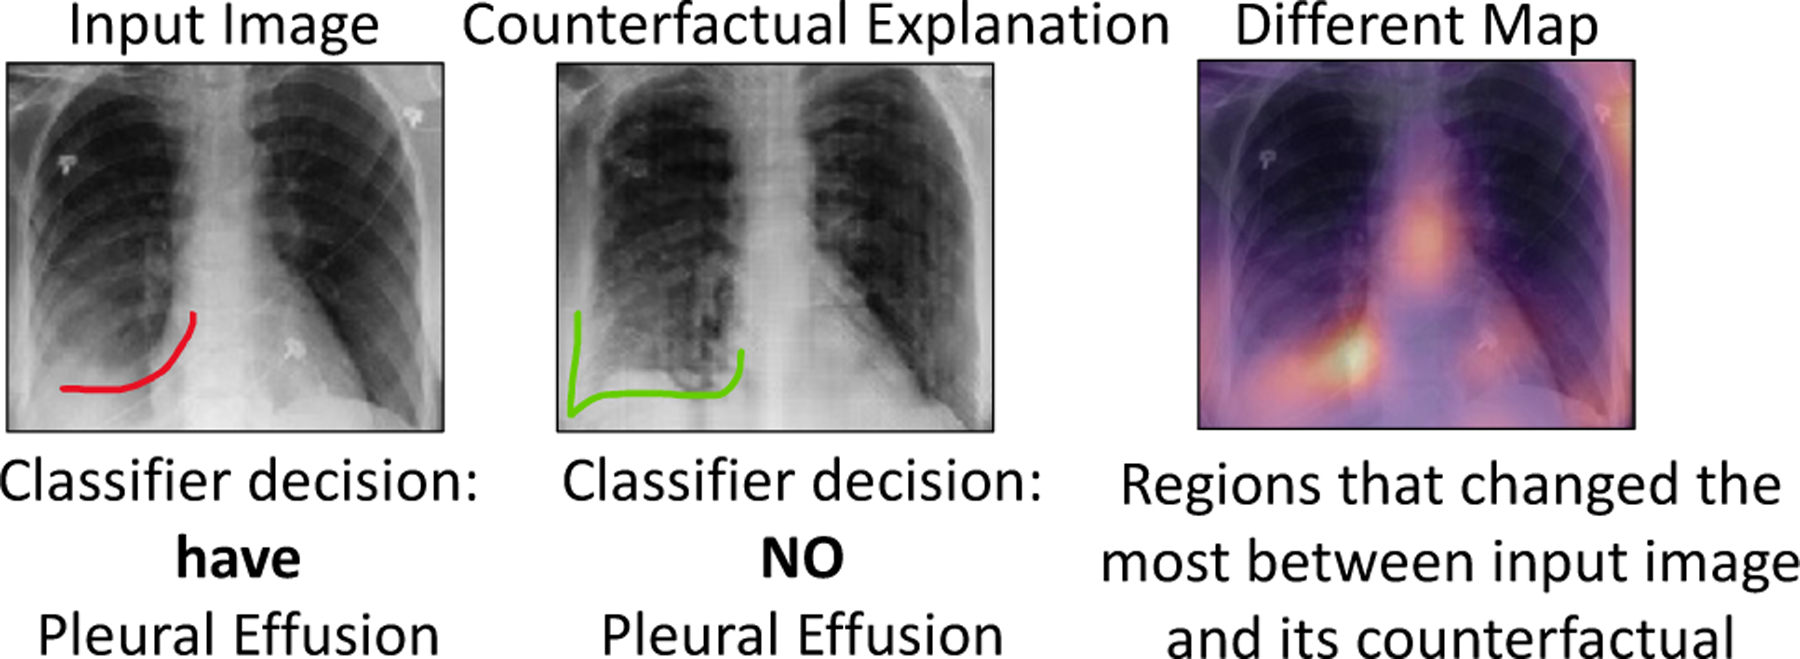
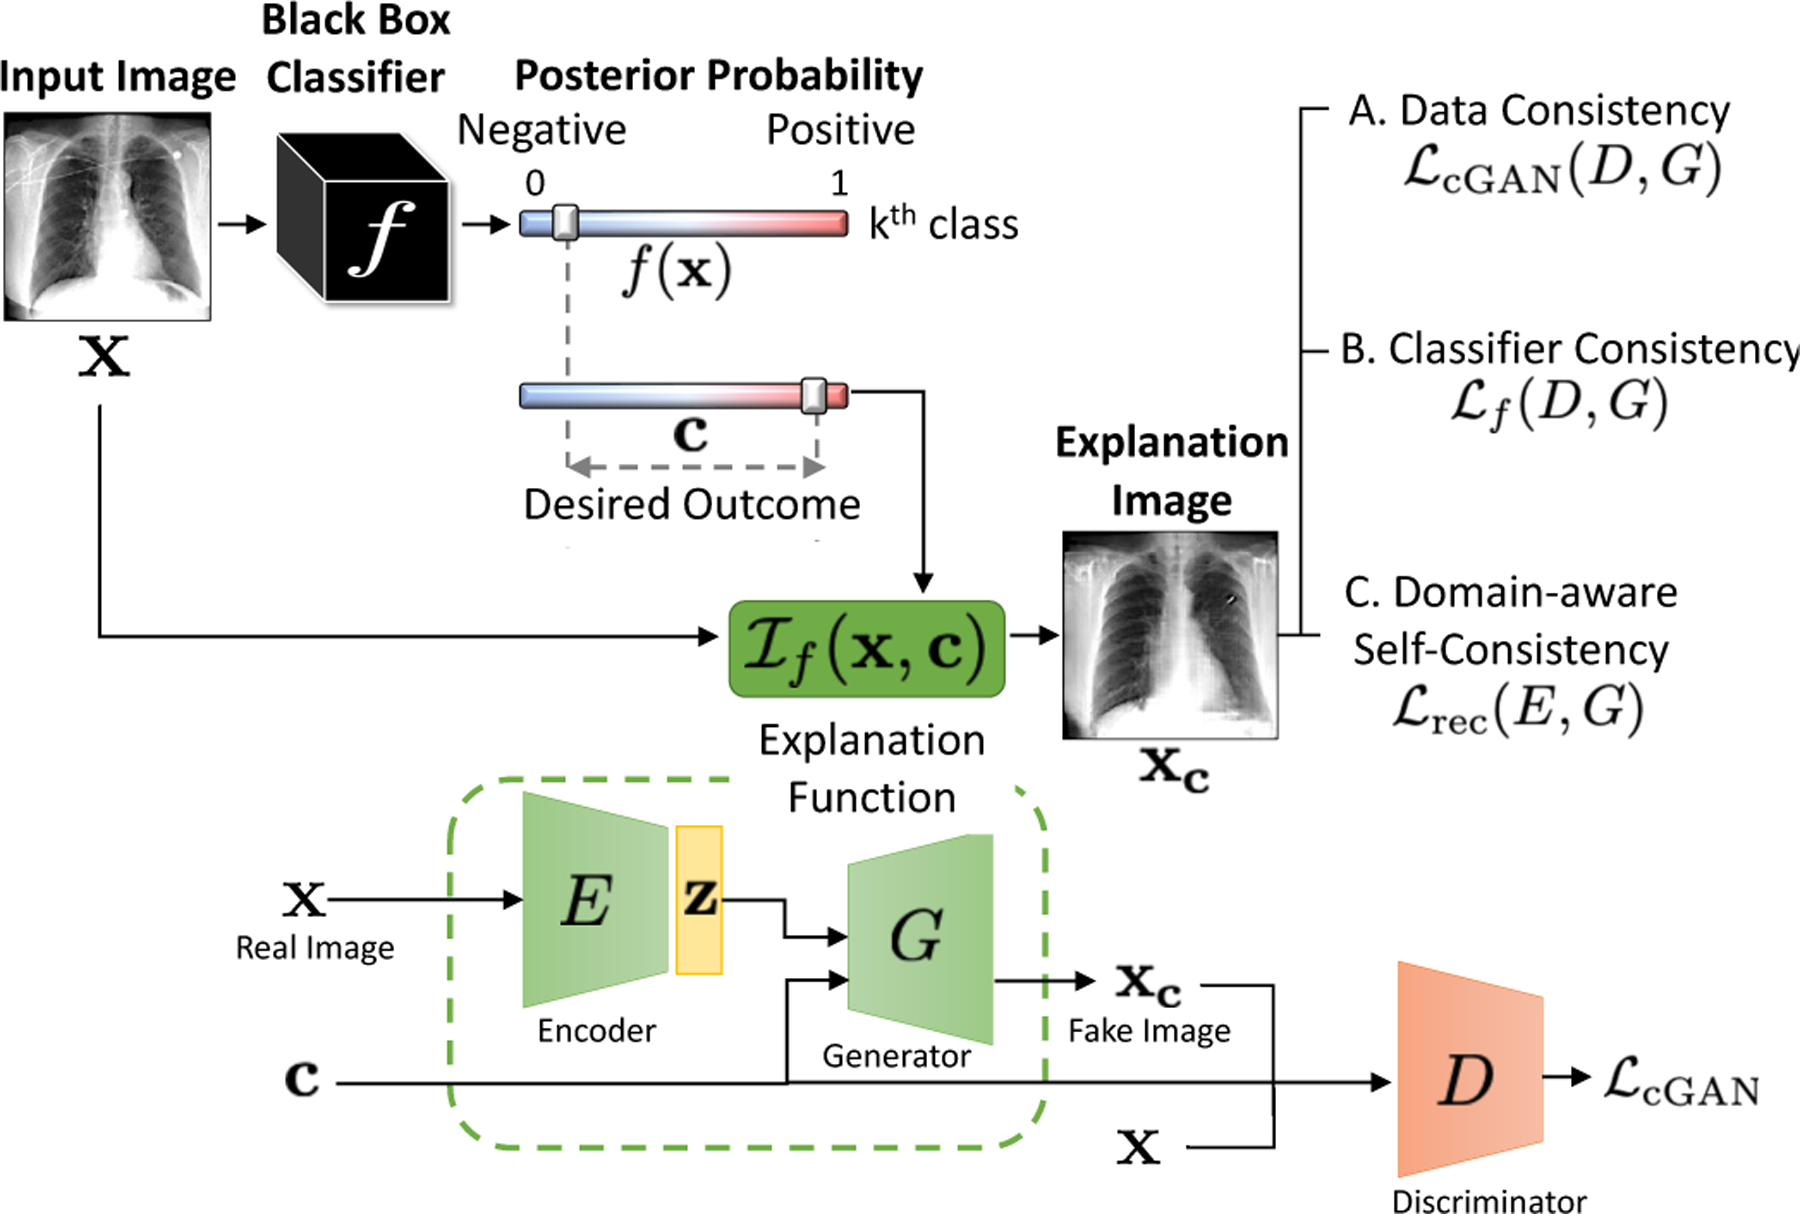
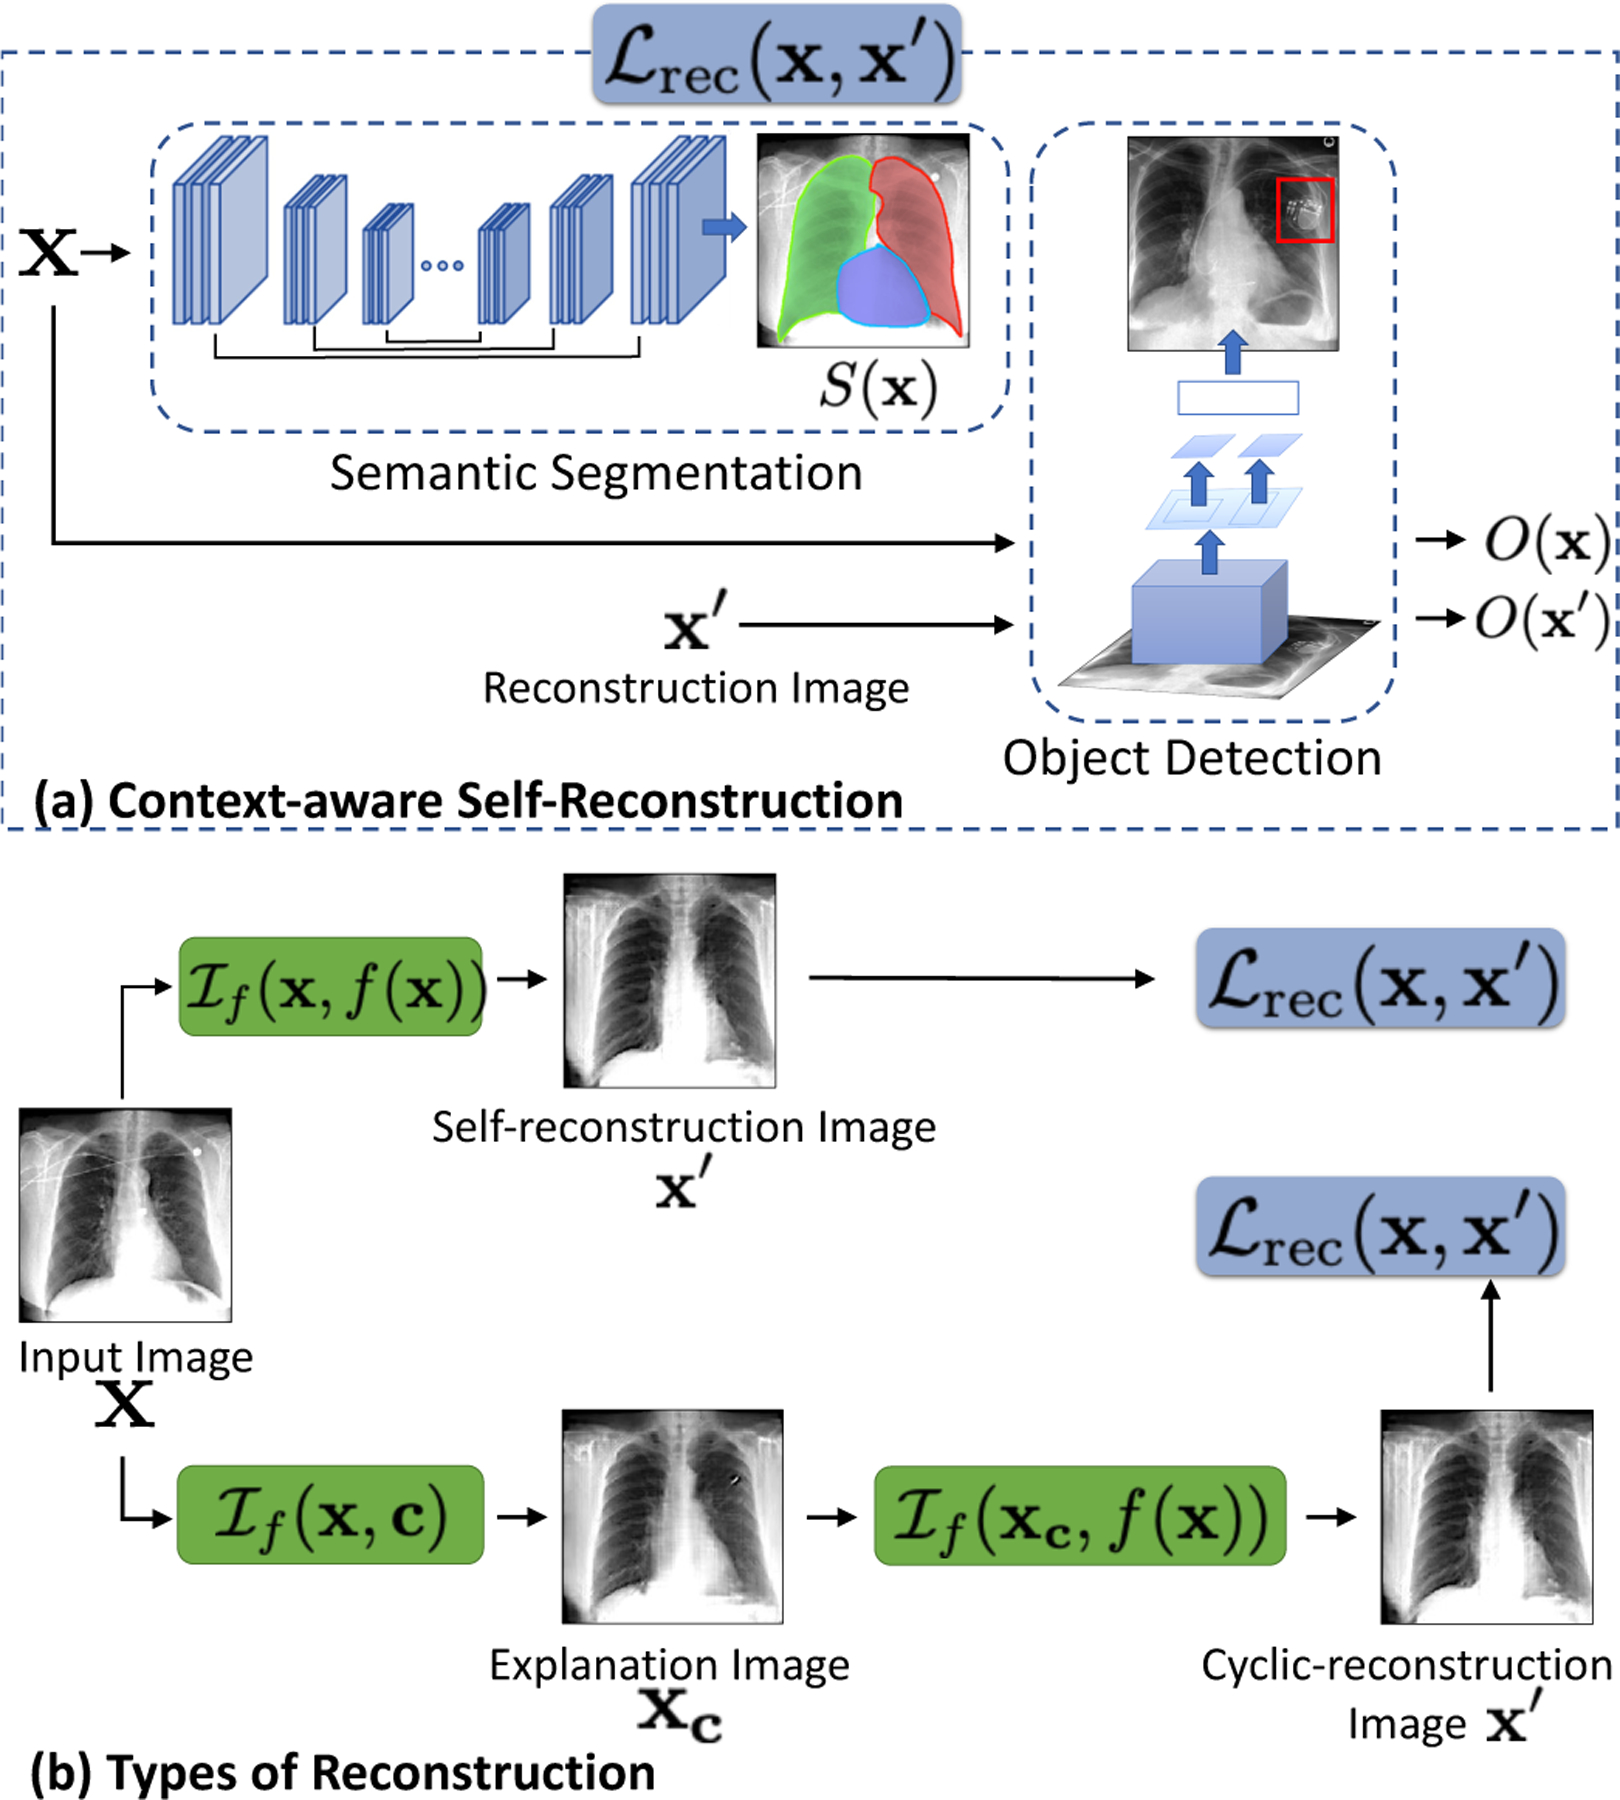
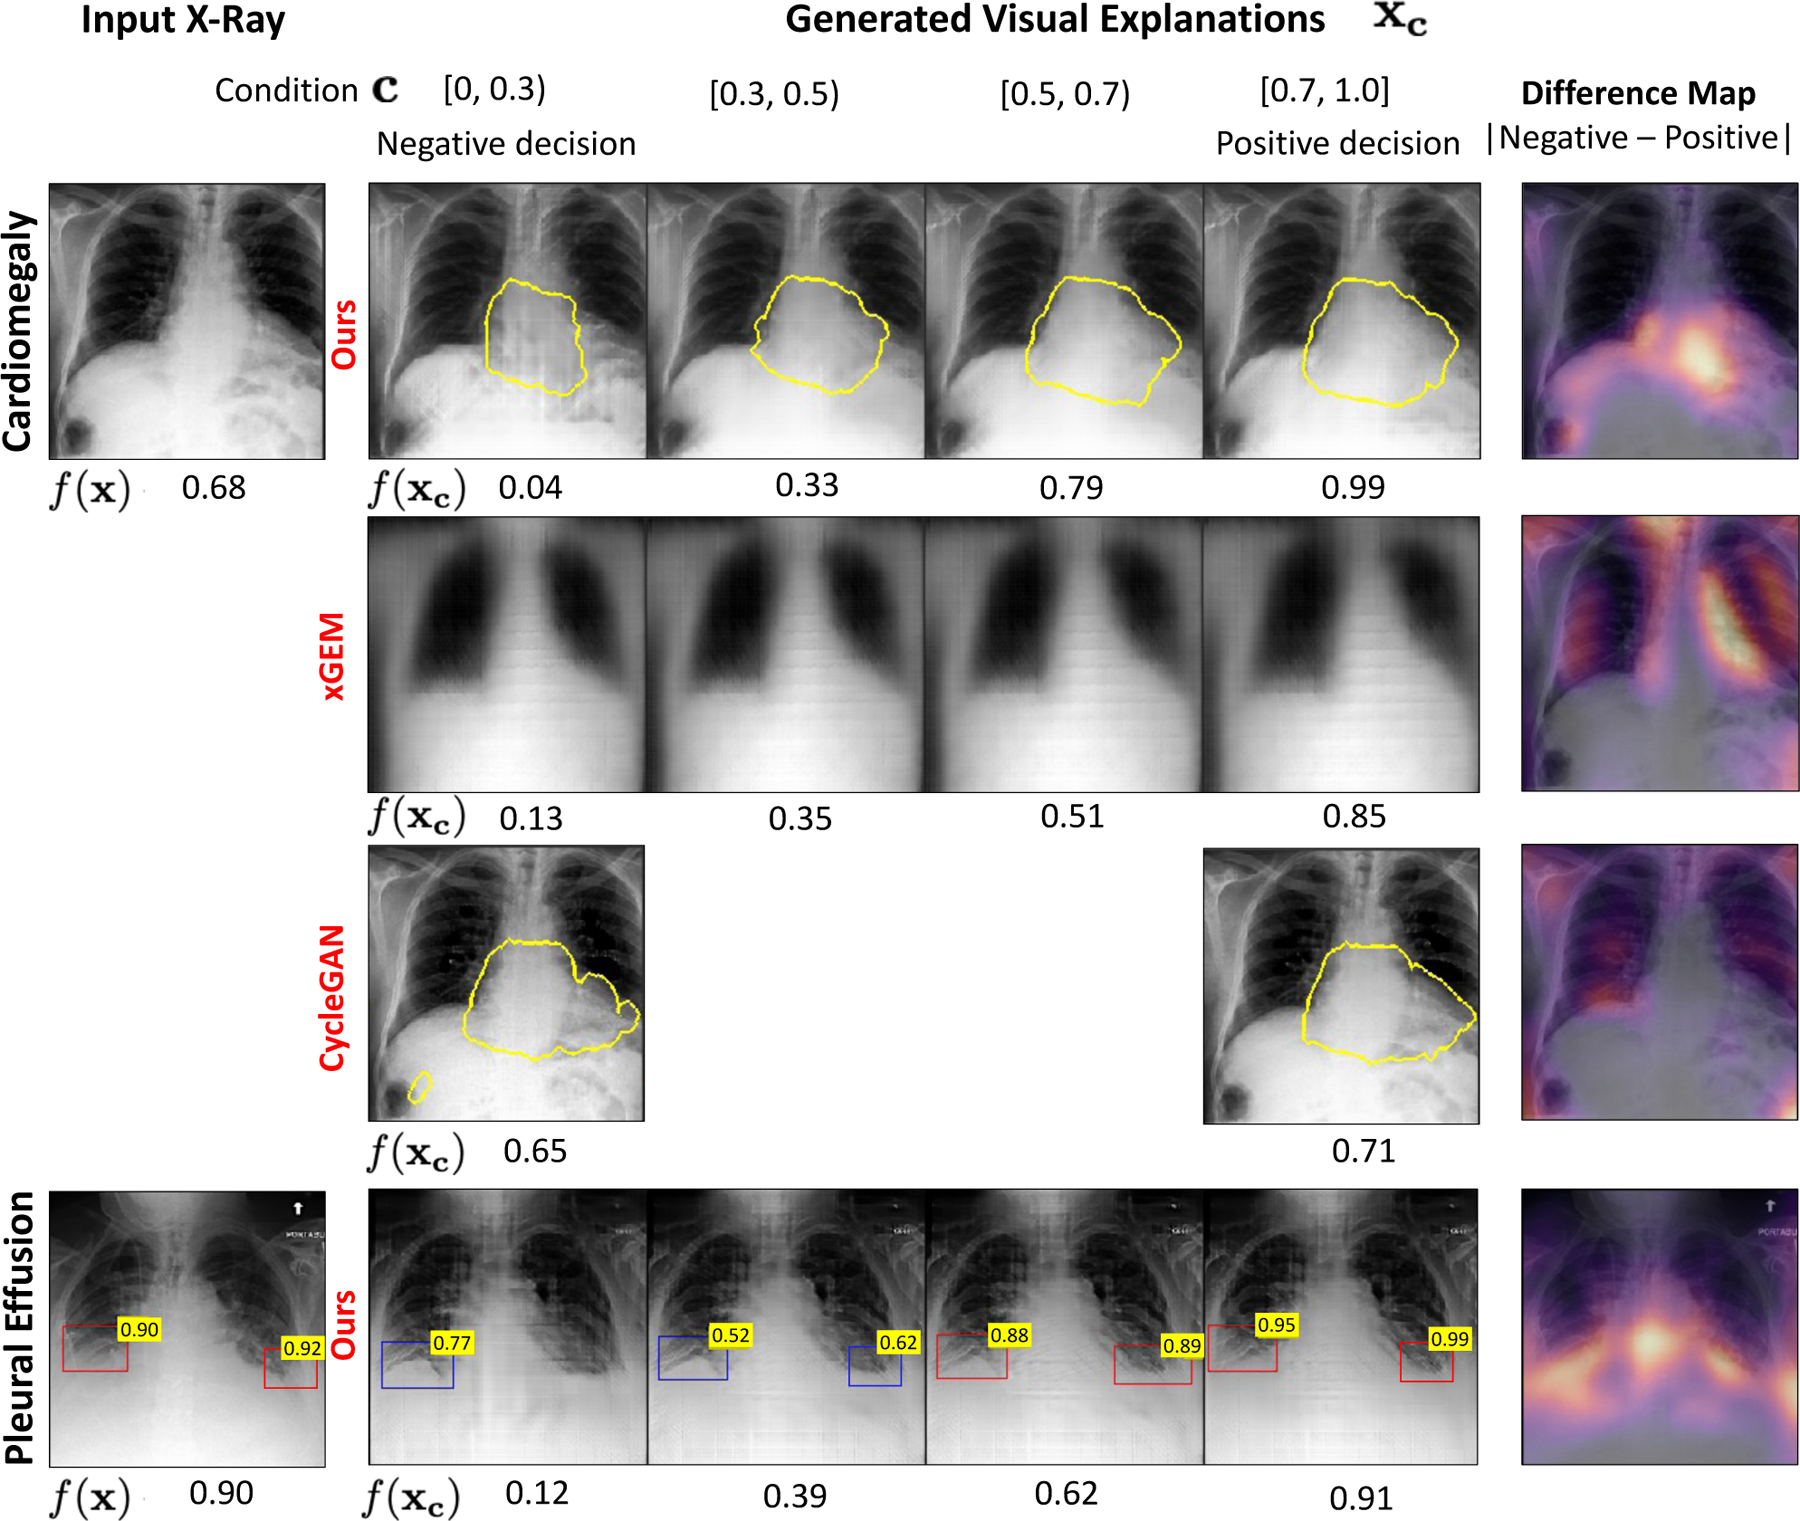
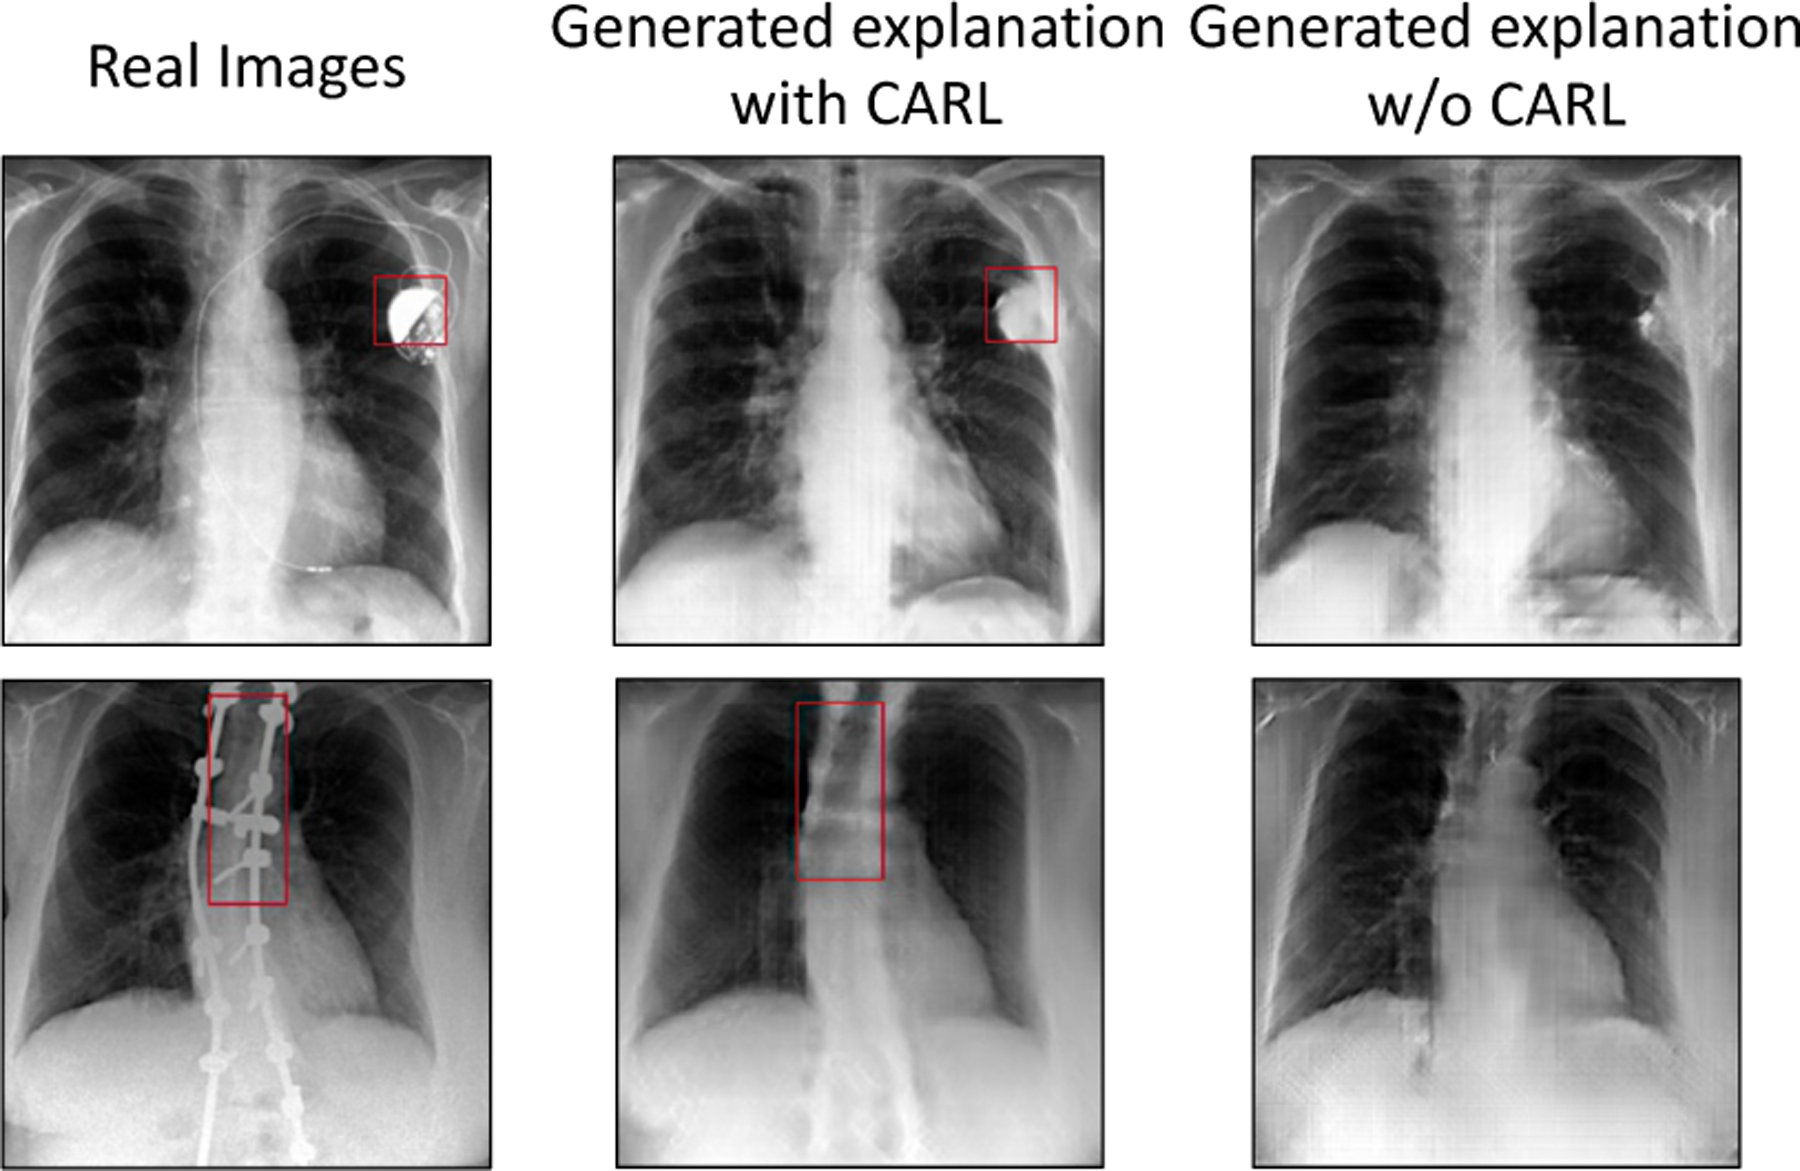
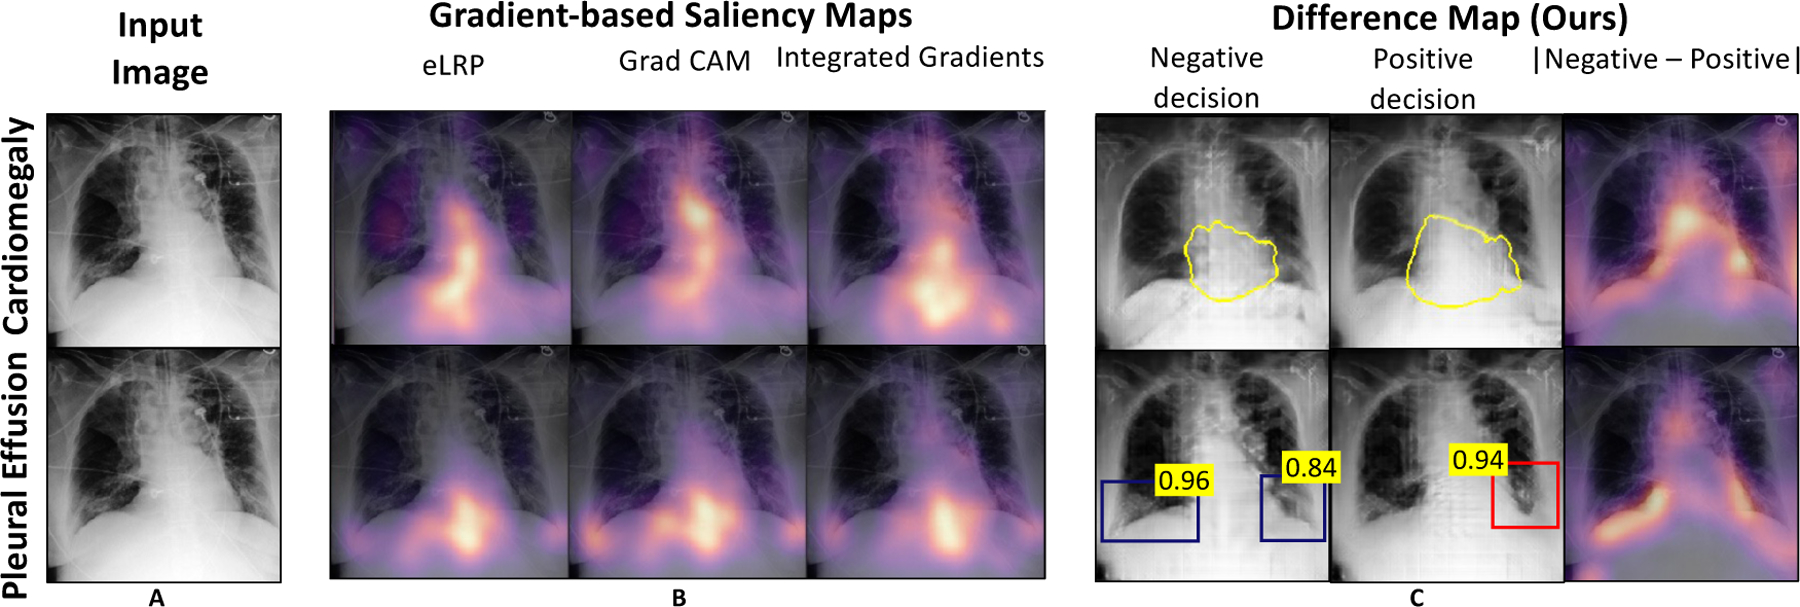
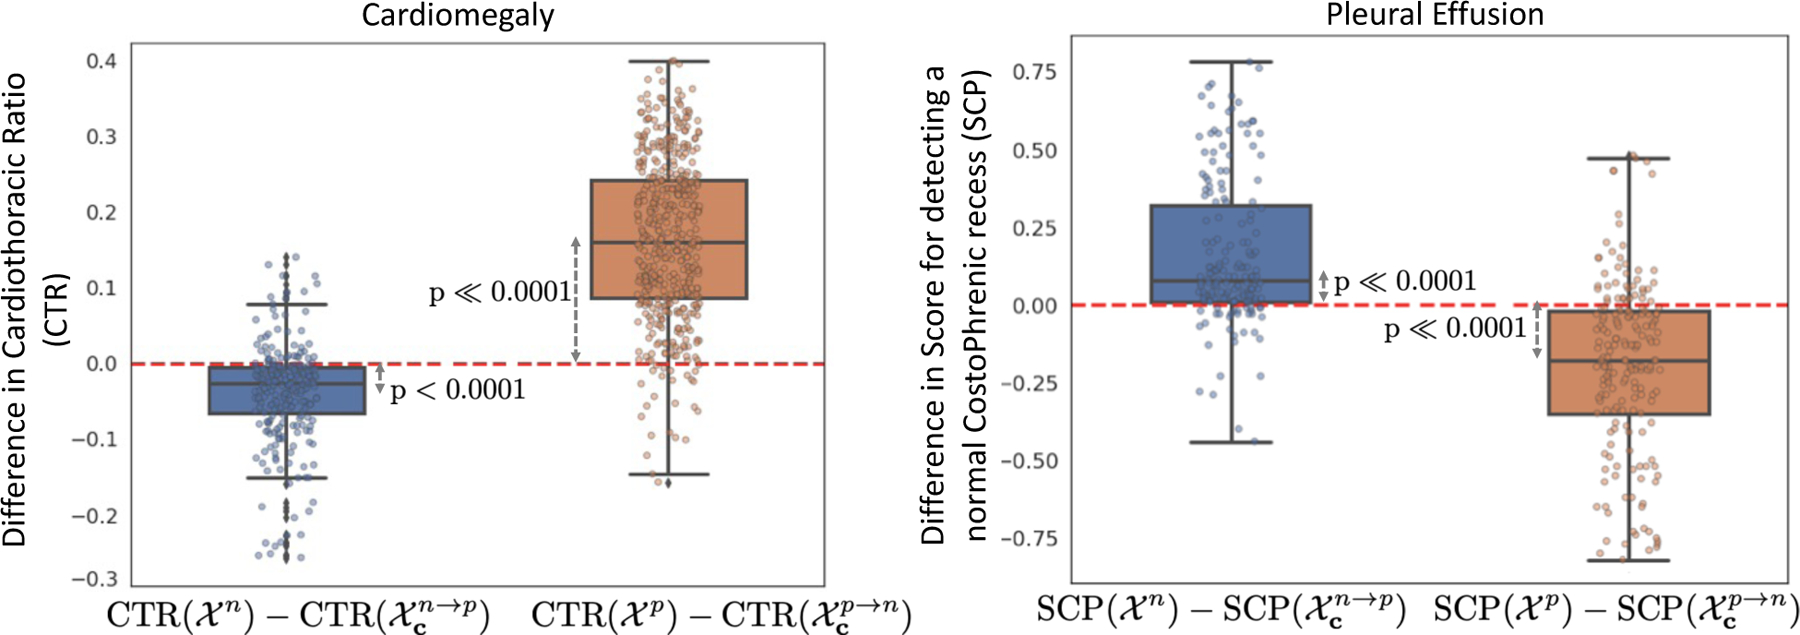
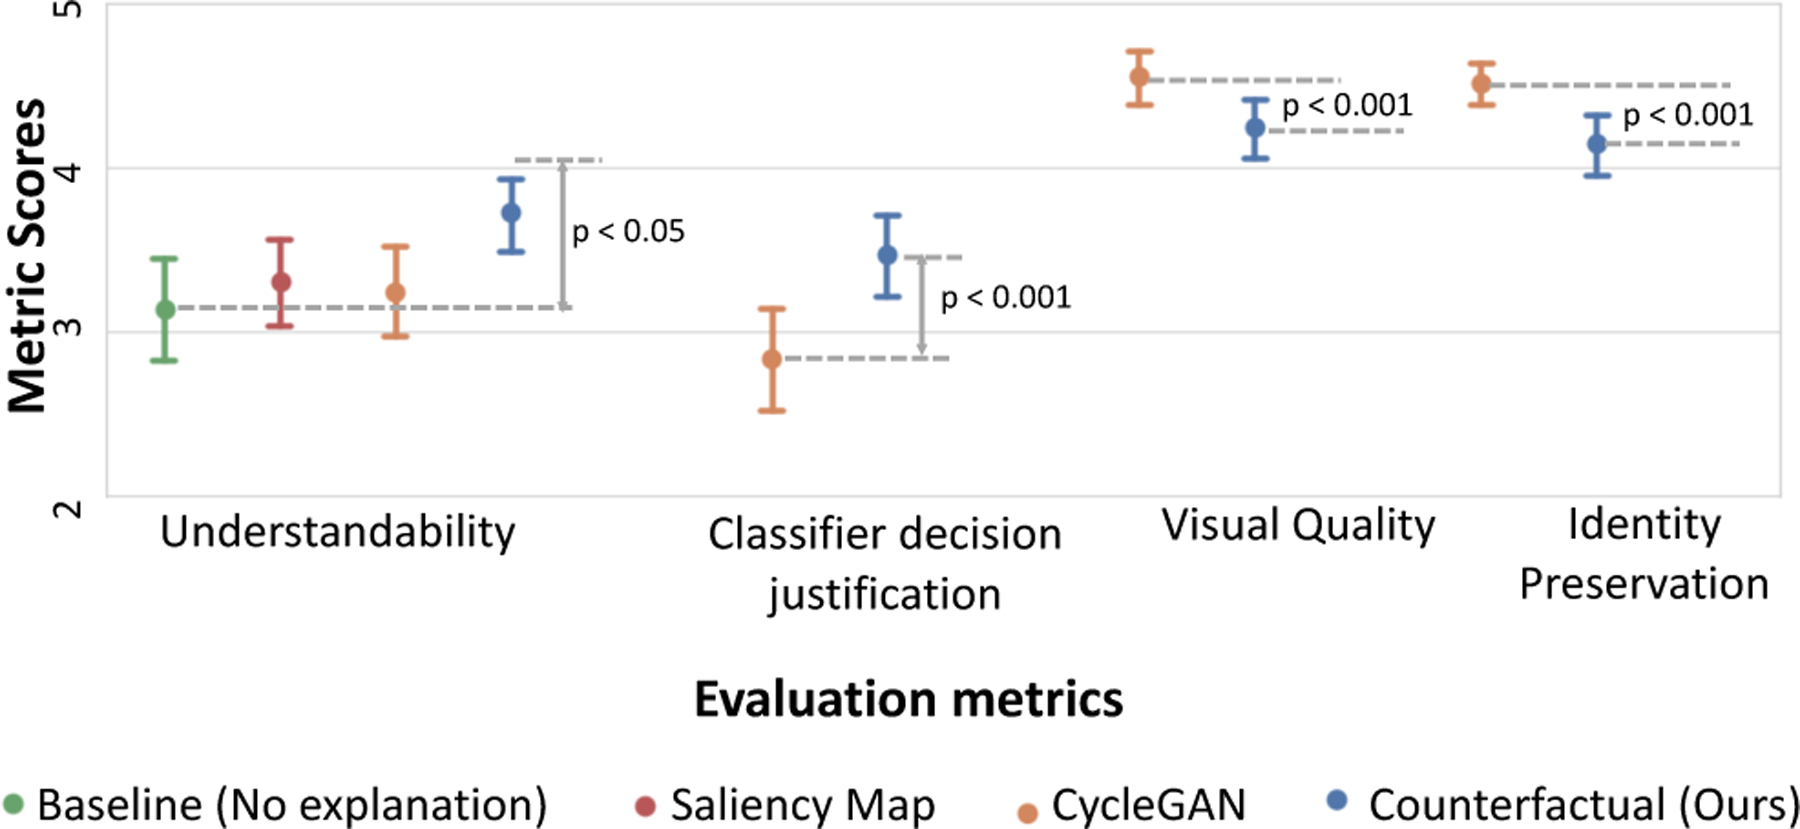
We propose a BlackBox Counterfactual Explainer, designed to explain image classification models for medical applications. Classical approaches (e.g., , saliency maps) that assess feature importance do not explain how imaging features in important anatomical regions are relevant to the classification decision. Such reasoning is crucial for transparent decision-making in healthcare applications. Our framework explains the decision for a target class by gradually exaggerating the semantic effect of the class in a query image. We adopted a Generative Adversarial Network (GAN) to generate a progressive set of perturbations to a query image, such that the classification decision changes from its original class to its negation. Our proposed loss function preserves essential details (e.g., support devices) in the generated images. We used counterfactual explanations from our framework to audit a classifier trained on a chest X-ray dataset with multiple labels. Clinical evaluation of model explanations is a challenging task. We proposed clinically-relevant quantitative metrics such as cardiothoracic ratio and the score of a healthy costophrenic recess to evaluate our explanations. We used these metrics to quantify the counterfactual changes between the populations with negative and positive decisions for a diagnosis by the given classifier. We conducted a human-grounded experiment with diagnostic radiology residents to compare different styles of explanations (no explanation, saliency map, cycleGAN explanation, and our counterfactual explanation) by evaluating different aspects of explanations: (1) understandability, (2) classifier's decision justification, (3) visual quality, (d) identity preservation, and (5) overall helpfulness of an explanation to the users. Our results show that our counterfactual explanation was the only explanation method that significantly improved the users' understanding of the classifier's decision compared to the no-explanation baseline. Our metrics established a benchmark for evaluating model explanation methods in medical images. Our explanations revealed that the classifier relied on clinically relevant radiographic features for its diagnostic decisions, thus making its decision-making process more transparent to the end-user.
Keywords: Chest X-ray diagnosis; Counterfactual reasoning; Explainable AI; Interpretable machine learning.
Copyright © 2022 Elsevier B.V. All rights reserved.
Conflict of interest statement
Declaration of Competing Interest The authors declare the following financial interests/personal relationships which may be considered as potential competing interests: Dr Kayhan Batmanghelich reports financial support was provided by National Institutes of Health. Dr Kayhan Batmanghelich reports financial support was provided by National Science Foundation.
Figures
References
-
- Agarwal C, Nguyen A, 2020. Explaining image classifiers by removing input features using generative models Asian Conference on Computer Vision (ACCV) .
-
- Bau D, Zhu JY, Wulff J, Peebles W, Strobelt H, Zhou B, Torralba A, 2019. Seeing what a gan cannot generate IEEE International Conference on Computer Vision (ICCV) , 4502–4511.
-
- Centurión OA, Scavenius K, Miño L, Sequeira OR, 2017. Evaluating Cardiomegaly by Radiological Cardiothoracic Ratio as Compared to Conventional Echocardiography. Journal of Cardiology & Current Research (JCCR) 9 doi:10.15406/jccr.2017.09.00319. - DOI
-
- Chamveha I, Promwiset T, Tongdee T, Saiviroonporn P, Chaisang-mongkon W, 2020. Automated Cardiothoracic Ratio Calculation and Cardiomegaly Detection using Deep Learning Approach. arXiv e-prints , arXiv:2002.07468.
Publication types
MeSH terms
Grants and funding
LinkOut - more resources
Full Text Sources
