Multi-Year Comparison of Community- and Species-Level West Nile Virus Antibody Prevalence in Birds from Atlanta, Georgia and Chicago, Illinois, 2005-2016
- PMID: 36572005
- PMCID: PMC9896344
- DOI: 10.4269/ajtmh.21-1086
Multi-Year Comparison of Community- and Species-Level West Nile Virus Antibody Prevalence in Birds from Atlanta, Georgia and Chicago, Illinois, 2005-2016
Abstract
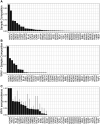
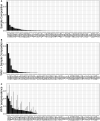
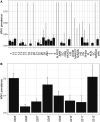
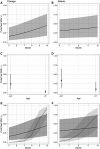
West Nile virus (WNV) is prevalent in the United States but shows considerable variation in transmission intensity. The purpose of this study was to compare patterns of WNV seroprevalence in avian communities sampled in Atlanta, Georgia and Chicago, Illinois during a 12-year period (Atlanta 2010-2016; Chicago 2005-2012) to reveal regional patterns of zoonotic activity of WNV. WNV antibodies were measured in wild bird sera using ELISA and serum neutralization methods, and seroprevalence among species, year, and location of sampling within each city were compared using binomial-distributed generalized linear mixed-effects models. Seroprevalence was highest in year-round and summer-resident species compared with migrants regardless of region; species explained more variance in seroprevalence within each city. Northern cardinals were the species most likely to test positive for WNV in each city, whereas all other species, on average, tested positive for WNV in proportion to their sample size. Despite similar patterns of seroprevalence among species, overall seroprevalence was higher in Atlanta (13.7%) than in Chicago (5%). Location and year of sampling had minor effects, with location explaining more variation in Atlanta and year explaining more variation in Chicago. Our findings highlight the nature and magnitude of regional differences in WNV urban ecology.
Figures


Similar articles
-
West Nile virus antibodies in avian species of Georgia, USA: 2000-2004.Vector Borne Zoonotic Dis. 2006 Spring;6(1):57-72. doi: 10.1089/vbz.2006.6.57. Vector Borne Zoonotic Dis. 2006. PMID: 16584328
-
Limited spillover to humans from West Nile Virus viremic birds in Atlanta, Georgia.Vector Borne Zoonotic Dis. 2013 Nov;13(11):812-7. doi: 10.1089/vbz.2013.1342. Epub 2013 Oct 9. Vector Borne Zoonotic Dis. 2013. PMID: 24107200 Free PMC article.
-
WEST NILE VIRUS ANTIBODY DECAY RATE IN FREE-RANGING BIRDS.J Wildl Dis. 2015 Jul;51(3):601-8. doi: 10.7589/2014-07-175. Epub 2015 Apr 28. J Wildl Dis. 2015. PMID: 25919465
-
Bird Species Involved in West Nile Virus Epidemiological Cycle in Southern Québec.Int J Environ Res Public Health. 2020 Jun 23;17(12):4517. doi: 10.3390/ijerph17124517. Int J Environ Res Public Health. 2020. PMID: 32585999 Free PMC article. Review.
-
[West Nile virus. Prevalence and significance as a zoonotic pathogen].Bundesgesundheitsblatt Gesundheitsforschung Gesundheitsschutz. 2004 Jul;47(7):653-60. doi: 10.1007/s00103-004-0864-x. Bundesgesundheitsblatt Gesundheitsforschung Gesundheitsschutz. 2004. PMID: 15254820 Review. German.
Cited by
-
Cross-Protection between West Nile Virus and Emerging Flaviviruses in Wild Birds.Am J Trop Med Hyg. 2024 Dec 31;112(3):657-662. doi: 10.4269/ajtmh.24-0363. Print 2025 Mar 5. Am J Trop Med Hyg. 2024. PMID: 39742522 Free PMC article.
References
-
- Lindsey NP, Staples JE, Lehman JA, Fischer M. for Centers for Disease Control and Prevention , 2010. Surveillance for human West Nile virus disease—United States, 1999–2008. MMWR Surveill Summ 59: 1–17. - PubMed
-
- Rochlin I, Faraji A, Healy K, Andreadis TG, 2019. West Nile virus mosquito vectors in North America. J Med Entomol 56: 1475–1490. - PubMed
MeSH terms
Substances
LinkOut - more resources
Full Text Sources
Medical

