. 2023 Mar 1;146(3):1152-1165.
doi: 10.1093/brain/awac407.

Brain-derived tau: a novel blood-based biomarker for Alzheimer's disease-type neurodegeneration

Affiliations

Brain-derived tau: a novel blood-based biomarker for Alzheimer's disease-type neurodegeneration

Fernando Gonzalez-Ortiz et al. Brain. .

Erratum in

Abstract

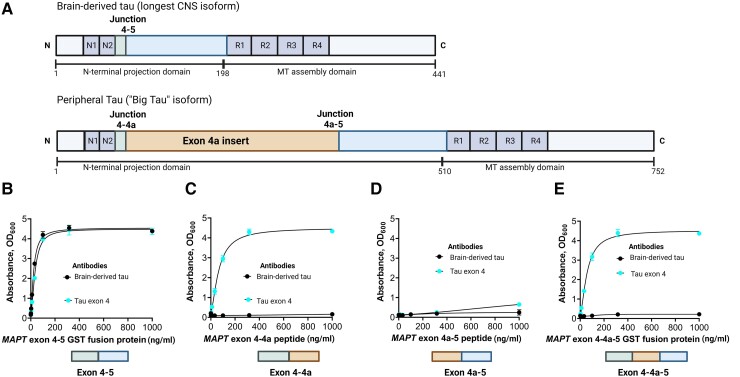
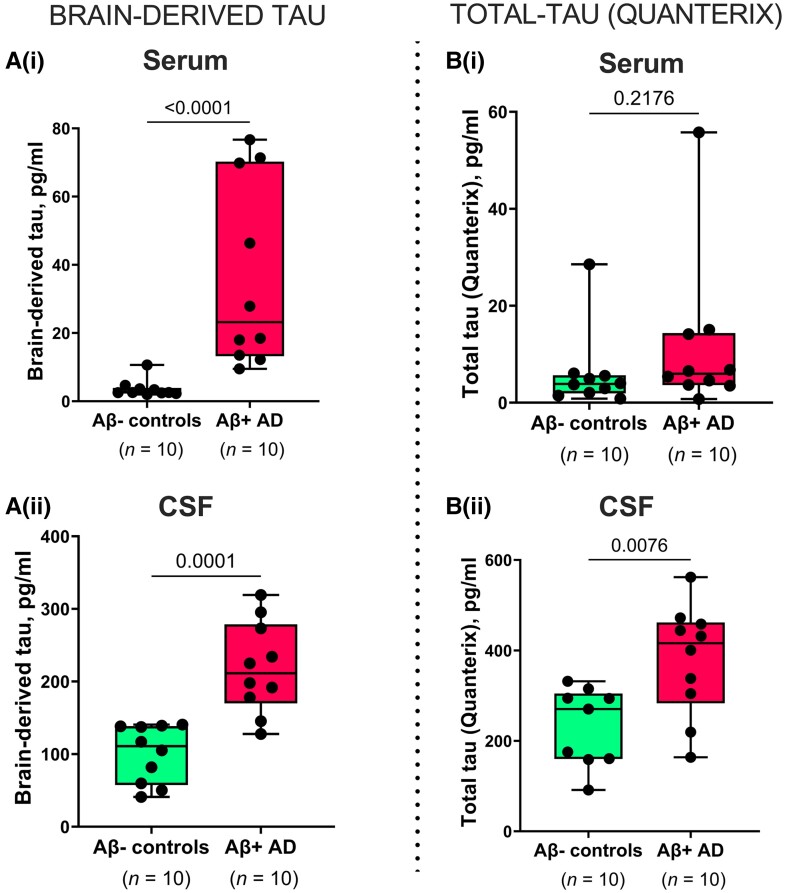
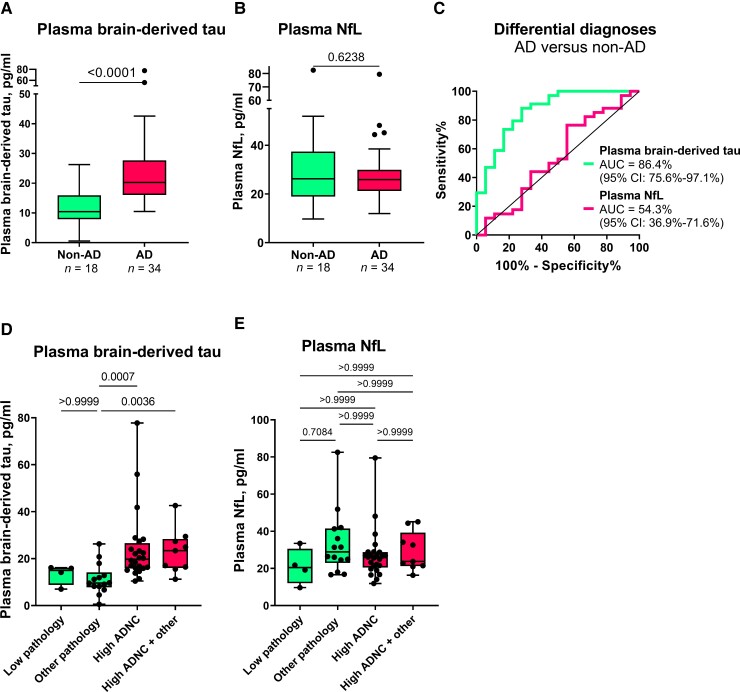
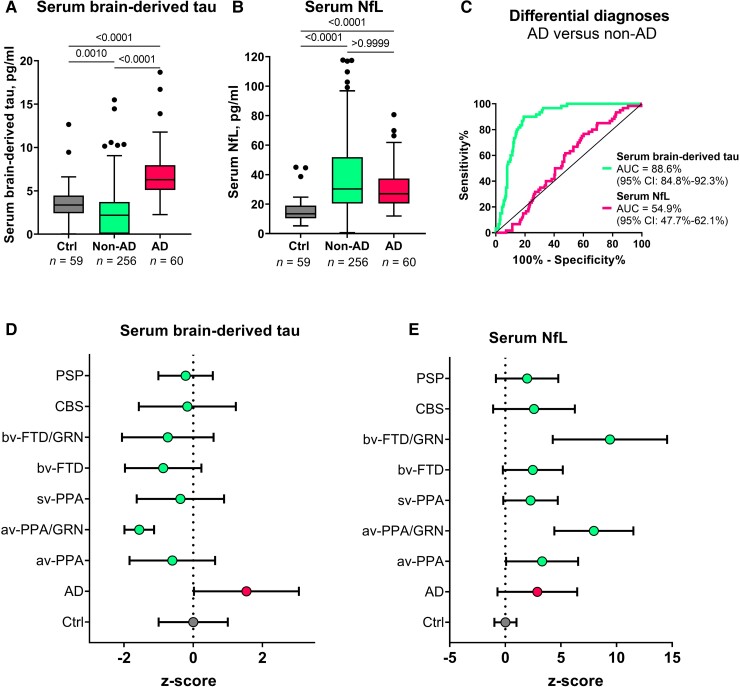
Blood-based biomarkers for amyloid beta and phosphorylated tau show good diagnostic accuracies and agreements with their corresponding CSF and neuroimaging biomarkers in the amyloid/tau/neurodegeneration [A/T/(N)] framework for Alzheimer's disease. However, the blood-based neurodegeneration marker neurofilament light is not specific to Alzheimer's disease while total-tau shows lack of correlation with CSF total-tau. Recent studies suggest that blood total-tau originates principally from peripheral, non-brain sources. We sought to address this challenge by generating an anti-tau antibody that selectively binds brain-derived tau and avoids the peripherally expressed 'big tau' isoform. We applied this antibody to develop an ultrasensitive blood-based assay for brain-derived tau, and validated it in five independent cohorts (n = 609) including a blood-to-autopsy cohort, CSF biomarker-classified cohorts and memory clinic cohorts. In paired samples, serum and CSF brain-derived tau were significantly correlated (rho = 0.85, P < 0.0001), while serum and CSF total-tau were not (rho = 0.23, P = 0.3364). Blood-based brain-derived tau showed equivalent diagnostic performance as CSF total-tau and CSF brain-derived tau to separate biomarker-positive Alzheimer's disease participants from biomarker-negative controls. Furthermore, plasma brain-derived tau accurately distinguished autopsy-confirmed Alzheimer's disease from other neurodegenerative diseases (area under the curve = 86.4%) while neurofilament light did not (area under the curve = 54.3%). These performances were independent of the presence of concomitant pathologies. Plasma brain-derived tau (rho = 0.52-0.67, P = 0.003), but not neurofilament light (rho = -0.14-0.17, P = 0.501), was associated with global and regional amyloid plaque and neurofibrillary tangle counts. These results were further verified in two memory clinic cohorts where serum brain-derived tau differentiated Alzheimer's disease from a range of other neurodegenerative disorders, including frontotemporal lobar degeneration and atypical parkinsonian disorders (area under the curve up to 99.6%). Notably, plasma/serum brain-derived tau correlated with neurofilament light only in Alzheimer's disease but not in the other neurodegenerative diseases. Across cohorts, plasma/serum brain-derived tau was associated with CSF and plasma AT(N) biomarkers and cognitive function. Brain-derived tau is a new blood-based biomarker that outperforms plasma total-tau and, unlike neurofilament light, shows specificity to Alzheimer's disease-type neurodegeneration. Thus, brain-derived tau demonstrates potential to complete the AT(N) scheme in blood, and will be useful to evaluate Alzheimer's disease-dependent neurodegenerative processes for clinical and research purposes.

Keywords: Alzheimer’s disease; neurodegenerative disease; neurofilament light; plasma brain-derived-tau; total-tau.


Conflict of interest statement

M.T. and P.H. are employees of Bioventix Plc. H.Z. has served at scientific advisory boards and/or as a consultant for Abbvie, Alector, Annexon, Artery Therapeutics, AZTherapies, CogRx, Denali, Eisai, Nervgen, Pinteon Therapeutics, Red Abbey Labs, Passage Bio, Roche, Samumed, Siemens Healthineers, Triplet Therapeutics and Wave, and has given lectures in symposia sponsored by Cellectricon, Fujirebio, Alzecure, Biogen and Roche. K.B. has served as a consultant or at advisory boards for Abcam, Axon, BioArctic, Biogen, JOMDD/Shimadzu. Julius Clinical, Lilly, MagQu, Novartis, Ono Pharma, Pharmatrophix, Prothena, Roche Diagnostics and Siemens Healthineers. H.Z. and K.B. are co-founders of Brain Biomarker Solutions in Gothenburg AB, a GU Ventures-based platform company at the University of Gothenburg. The other authors declare no competing interests.

Figures

Figure 1
Figure 1
Design and characterization of the TauJ.5H3 sheep monoclonal antibody specific for CNS-derived tau isoforms. (A, top) Schematic illustration of the full-length tau isoform (2N4R) in the adult human brain showing the different regions including the junction between exons 4 and 5, indicating the absence of the exon 4a insert. Note that the organization of the exons 4 and 5 here also applies to the other five major tau isoforms commonly expressed in the adult human CNS. (A, bottom) Schematic illustration of the high molecular weight tau (‘big tau’) isoform, which is the predominant form of tau in the adult human PNS. The exon 4a insert breaks the junction between exons 4 and 5 in the 2N4R isoform into two separate junctions—between exons 4 and 4a and between 4a and 5. The TauJ.5H3 BD-tau antibody was generated against a small contiguous peptide that specifically stretches the junction between exons 4 and 5, making it unique to CNS tau isoforms. The control anti-exon-4 antibody was generated against a recombinant protein form of the exon 4 that is common to all tau isoforms. (B) The TauJ.5H3 antibody did bind in a concentration-dependent manner to a recombinant protein construct corresponding to the exon 4–5 region found in the 2N4R and other CNS tau isoforms but not in the high molecular weight tau isoform abundantly expressed in peripheral tissue. The binding profile was the same as that of a control antibody generated against the exon-4 region. (C) The TauJ.5H3 antibody did not bind to a recombinant protein construct that covers the exons 4–4a region found in the high molecular weight, but not the 2N4R, tau isoform. However, the anti-exon-4 antibody did bind in a concentration-dependent manner as it did against the exon 4–5 region in B above. (D) Both the TauJ.5H3 and anti-exon-4 antibodies did not recognize a recombinant protein construct for the exon 4a–5 region that is found in the high molecular weight tau but not CNS isoforms. (E) TauJ.5H3, but not the anti-exon-4 antibody, gave no signal in the presence of a recombinant fusion construct corresponding to the continuous exon 4–4a–5 region.
Figure 2
Figure 2
Technical validation of a novel assay to measure BD-tau in blood. (A) Dilution linearity. The panel shows serial dilutions of three unique plasma samples with the assay diluent. Compared with sample aliquots diluted 2-fold, those diluted 4-fold gave ∼50% less signal for BD-tau. The trend was the same when comparing 4- and 8-fold diluted samples. The bar plots show the mean values and the error bars show the standard error of the mean. (B) Within- and between-run stability. The concentrations for three separate plasma or serum samples were measured in duplicates in up to five independent analytical runs are shown, to depict day-to-day stability of the BD-tau assay. (C) Spike recovery. Serum samples diluted 1:2 as well as the assay diluent were each ‘spiked’ with CSF and levels in each sample were measured with our assay. The plot shows signals for the non-spiked serum sample, the CSF spike sample alone and the serum + CSF spike sample together.
Figure 3
Figure 3
Concentrations and correlation of BD-tau in paired serum and CSF samples. [A(i and ii)] Concentrations of BD-tau in paired serum and CSF samples showing significant increases in Aβ+ Alzheimer’s disease and Aβ− control individuals classified according to their neurochemical CSF biomarker profiles. The corresponding levels of t-tau (Quanterix) in the same paired serum and CSF samples are shown in B(i) and B(ii), respectively. For B(ii), one sample in the Aβ− control group returned no measurable signal due to a technical instrument error. Excluding the CSF-serum pair of this sample from the analyses did not change the results. P-values indicate the results of Mann–Whitney tests. In each box plot, the horizontal bar on top of the coloured area shows the 75% percentile, the middle bar depicts the median and the lower bar shows the 25% percentile. Values that are above the 75% percentile and below the 25% percentile are shown outside the coloured areas. Note that there are differences in the absolute concentrations of BD-tau and t-tau in both serum and CSF, which can be explained by the use of different assay designs, analytical technologies, calibrators, and standard curves for each biomarker. This means that the values are a reflection of several factors, including assay sensitivity, and that absolute concentrations are not directly comparable in numerical sense.
Figure 4
Figure 4
Plasma BD-tau accurately differentiates autopsy-verified Alzheimer’s disease from other neurodegenerative diseases. (A) and (B) Tukey plots of plasma BD-tau and plasma NfL levels in the Alzheimer’s disease (AD) and the non-Alzheimer’s disease (non-AD) groups in the Neuropathology cohort. The corresponding ROC and AUC values indicating between-group discriminatory accuracies of the biomarkers are shown in C. The diagonal line on the ROC plot shows 50% accuracy meaning no difference from chance events. (D and E) Plasma BD-tau and NfL stratified according to ADNC. The non-AD group was divided into Low Pathology (limited amyloid plaques in the absence of tau tangles) or Other Pathology (non-Alzheimer pathologies). The pathology-confirmed Alzheimer’s disease group was also divided into High ADNC and High ADNC + Other (Alzheimer’s disease in the presence of concomitant pathologies) subgroups. (A) Plasma BD-tau was significantly increased in both the High ADNC and the High ADNC + Other subgroups compared with the Other Pathology group. P-values indicate the results of Mann–Whitney test (for two groups) or Kruskal–Wallis test adjusted for multiple comparisons (three or more groups). In each box plot, the horizontal bar on top of the coloured area shows the 75% percentile, the middle bar depicts the median and the lower bar shows the 25% percentile. Values that are above the 75% percentile and below the 25% percentile are shown outside the coloured areas.
Figure 5
Figure 5
Serum BD-tau profile in Alzheimer’s disease versus several other neurodegenerative diseases in Memory Clinic Cohort 1. The Tukey box plots in A and B show serum BD-tau and serum NfL respectively in the control, non-Alzheimer’s disease (non-AD) and Alzheimer’s disease (AD) groups. (C) ROC and AUC values for the differential diagnostic function of serum BD-tau and NfL. (D and E) Z-score transformed plots of serum BD-tau and NfL in the control (Ctrl), AD and specific non-AD groups. AUC comparisons of serum BD-tau and NfL to differentiate each group from Alzheimer’s disease is shown in Table 2. In each box plot, the horizontal bar on top of the coloured area shows the 75% percentile, the middle bar depicts the median and the lower bar shows the 25% percentile. Values that are above the 75% percentile and below the 25% percentile are shown outside the coloured areas. Note that the tendency of serum BD-tau concentrations to be lower than in the frontotemporal lobal degeneration groups especially in GRN mutation carriers has also been shown for serum p-tau181 and NfL in this same population. Similarly, the highly increased levels of serum NfL in GRN mutation carriers has also been reported before. AD = Alzheimer’s disease; avPPA = agrammatic variant primary progressive aphasia; avPPA/GRN = agrammatic variant primary progressive aphasia with progranulin mutation; bvFTD = behavioural frontotemporal dementia; bvFTD/GRN = behavioural frontotemporal dementia with progranulin mutation; CBS = corticobasal syndrome; PSP = progressive supranuclear palsy; svPPA = semantic variant primary progressive aphasia.

References

    1. Jack CR, Bennett DA, Blennow K, et al. NIA-AA research framework: Toward a biological definition of Alzheimer’s disease. Alzheimers Dement. 2018;14:535–562. - PMC - PubMed
    1. Jack CR, Bennett DA, Blennow K, et al. A/T/N: An unbiased descriptive classification scheme for Alzheimer disease biomarkers. Neurology. 2016;87:539–547. - PMC - PubMed
    1. Dubois B, Villain N, Frisoni GB, et al. Clinical diagnosis of Alzheimer’s disease: Recommendations of the international working group. Lancet Neurol. 2021;20:484–496. - PMC - PubMed
    1. Alzheimer’s Association . 2020 Alzheimer’s disease facts and figures. Alzheimers Dement. 2020;16:391–460.
    1. Ashton NJ, Hye A, Rajkumar AP, et al. An update on blood-based biomarkers for non-Alzheimer neurodegenerative disorders. Nat Rev Neurol. 2020;16:265–284. - PubMed

Publication types