

Methods for calculating ventilation rates during resuscitation from out-of-hospital cardiac arrest
- PMID: 36572374
- PMCID: PMC12247125
- DOI: 10.1016/j.resuscitation.2022.109679
Methods for calculating ventilation rates during resuscitation from out-of-hospital cardiac arrest
Abstract
Objective: Ventilation control is important during resuscitation from out-of-hospital cardiac arrest (OHCA). We compared different methods for calculating ventilation rates (VR) during OHCA.
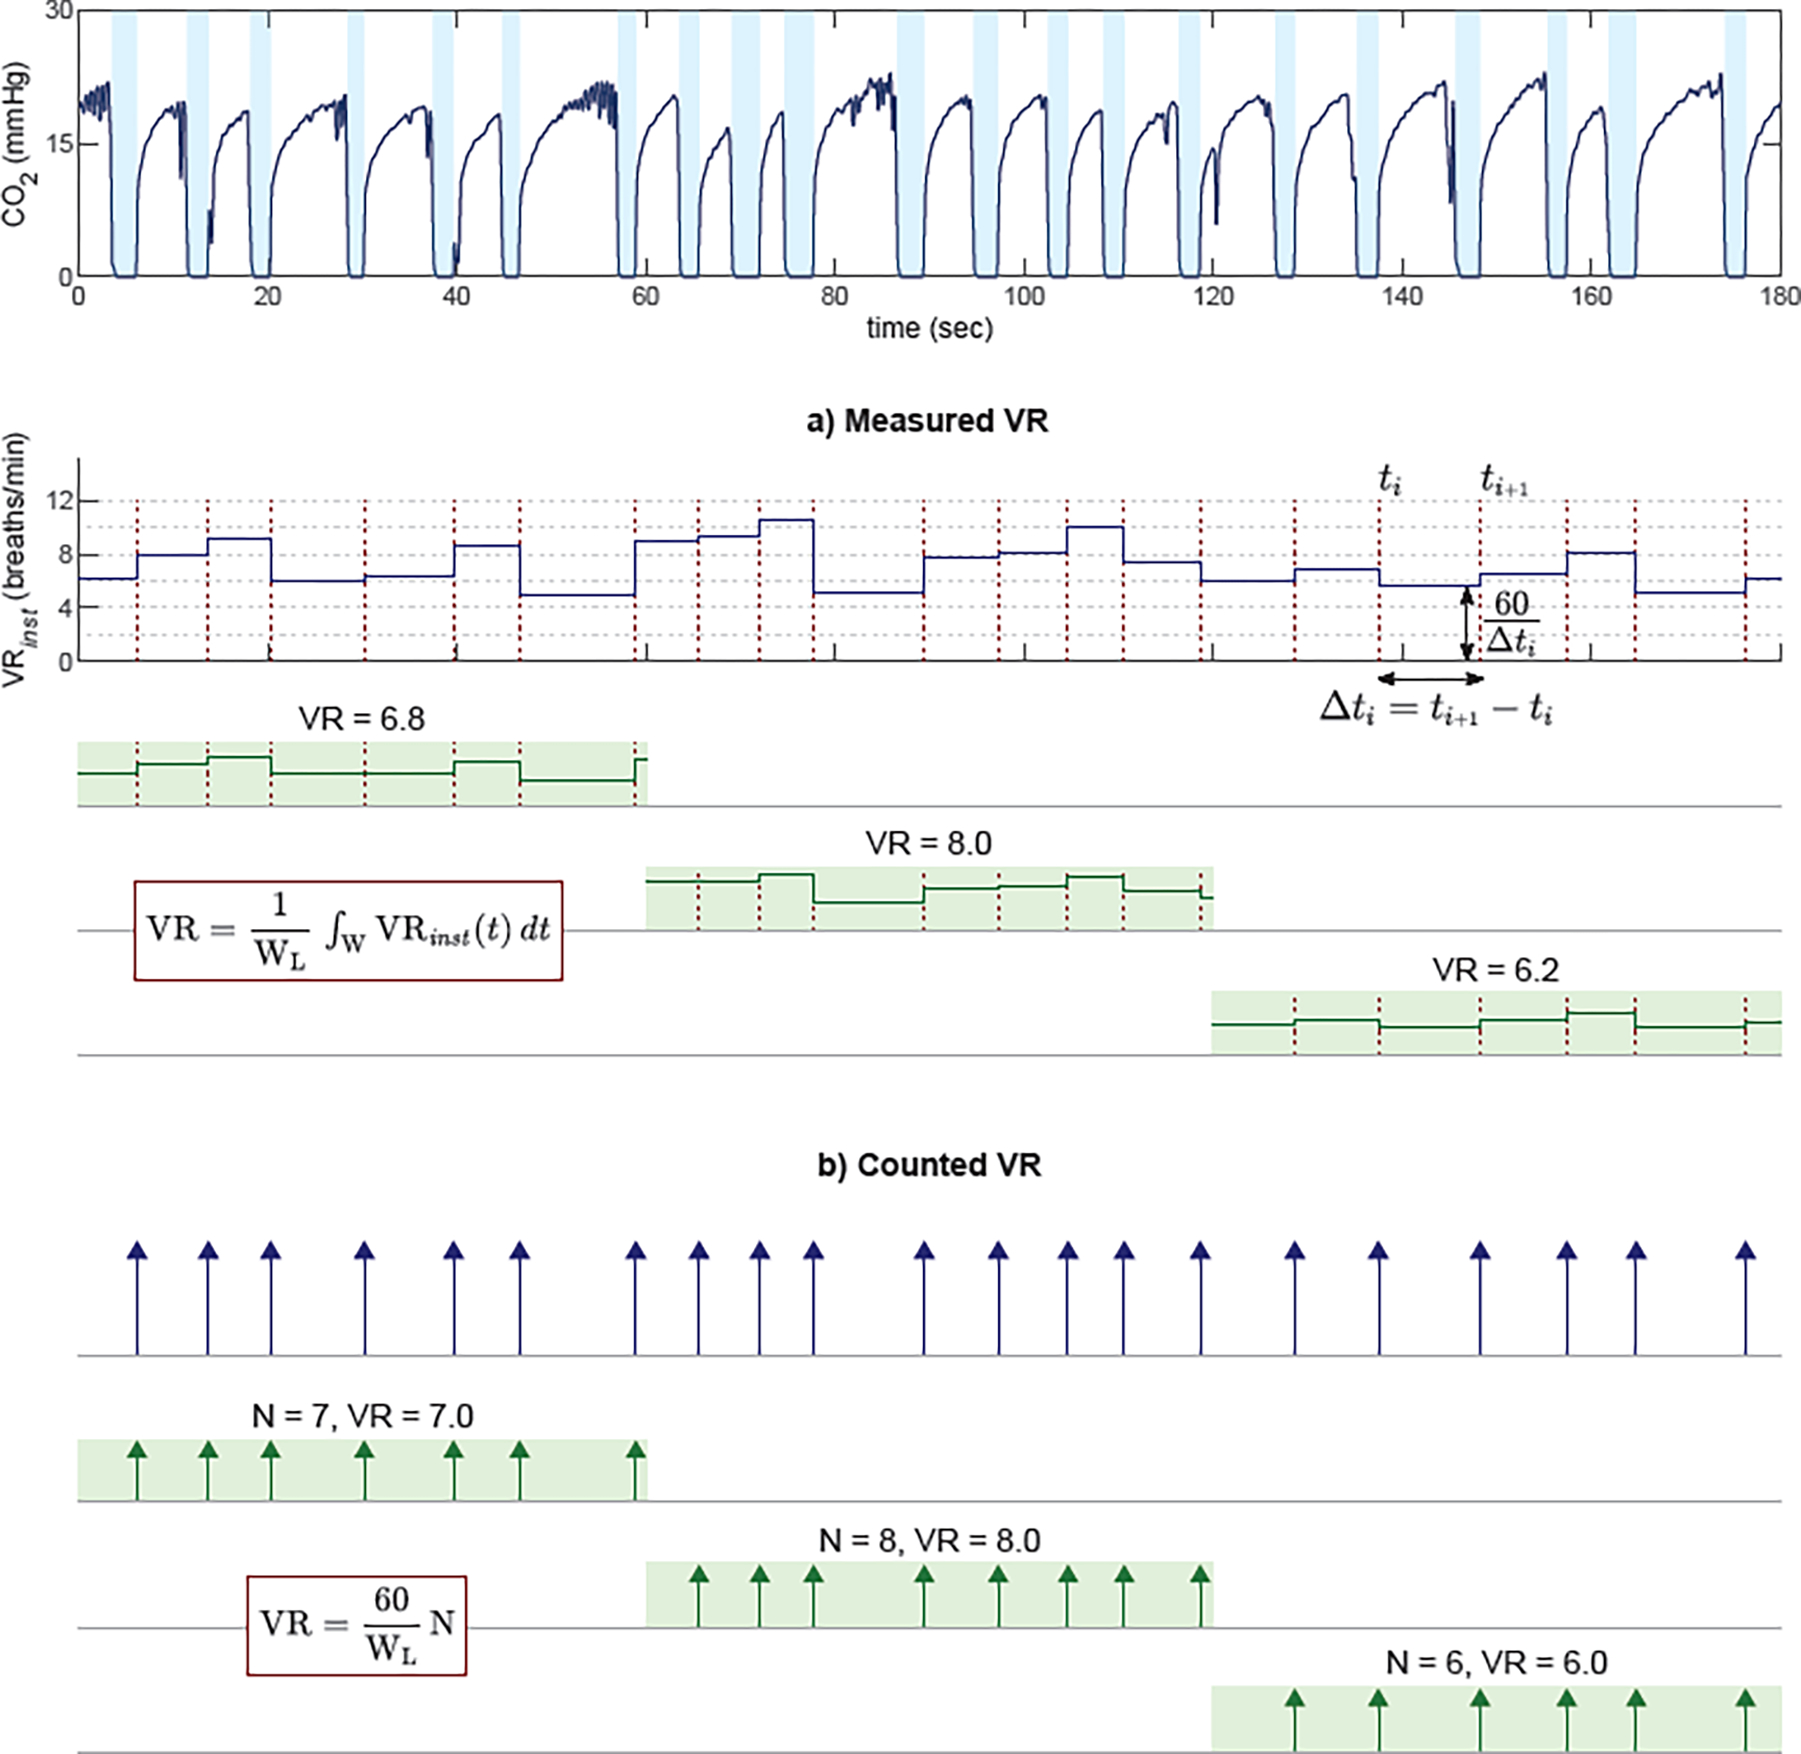
Methods: We analyzed data from the Pragmatic Airway Resuscitation Trial, identifying ventilations through capnogram recordings. We determined VR by: 1) counting the number of breaths within a time epoch ("counted" VR), and 2) calculating the mean of the inverse of measured time between breaths within a time epoch ("measured" VR). We repeated the VR estimates using different time epochs (10, 20, 30, 60 sec). We defined hypo- and hyperventilation as VR <6 and >12 breaths/min, respectively. We assessed differences in estimated hypo- and hyperventilation with each VR measurement technique.
Results: Of 3,004 patients, data were available for 1,010. With the counted method, total hypoventilation increased with longer time epochs ([10-s epoch: 75 sec hypoventilation] to [60-s epoch: 97 sec hypoventilation]). However, with the measured method, total hypoventilation decreased with longer time epochs ([10-s epoch: 223 sec hypoventilation] to [60-s epoch: 150 sec hypoventilation]). With the counted method, the total duration of hyperventilation decreased with longer time epochs ([10-s epochs: 35 sec hyperventilation] to [60-s epoch: 0 sec hyperventilation]). With the measured method, total hyperventilation decreased with longer time epochs ([10-s epoch: 78 sec hyperventilation] to [60-s epoch: 0 sec hyperventilation]). Differences between the measured and counted estimates were smallest with a 60-s time epoch.
Conclusions: Quantifications of hypo- and hyperventilation vary with the applied measurement methods. Measurement methods are important when characterizing ventilation rates in OHCA.
Keywords: Airway management; Cardiopulmonary arrest; Emergency medical services; Intubation; Ventilation.
Copyright © 2022 Elsevier B.V. All rights reserved.
Conflict of interest statement
Declaration of Competing Interest The authors declare that they have no known competing financial interests or personal relationships that could have appeared to influence the work reported in this paper. Graham Nichol has research funding from Abiomed Inc. (Danvers, MA), Vapotherm Inc. (Exeter, NH), and ZOLL Medical (Chelmsford, MA). He is a member of the steering committee of the PRINCESS 2 Trial of Ultrafast Hypothermia After Cardiac Arrest. He is also a consultant to CPR Therapeutics (Putney, VT), Heartbeam Inc. (Santa Clara, CA), Kestra Medical Technologies Inc. (Kirkland, WA), Invero Health LLC. (Montvale, NJ), Orixha Inc. (Saint Cyr Au Mont d’Or, France), and ZOLL Circulation (San Jose, CA).
Figures


Comment in
-
Measuring ventilation during out-of-hospital cardiac arrest: PART of the equation.Resuscitation. 2023 Mar;184:109696. doi: 10.1016/j.resuscitation.2023.109696. Epub 2023 Jan 18. Resuscitation. 2023. PMID: 36681381 No abstract available.
References
-
- Scanlon TS 3rd, Benumof JL, Wahrenbrock EA, Nelson WL. Hypoxic pulmonary vasoconstriction and the ratio of hypoxic lung to perfused normoxic lung. Anesthesiology. 1978;49(3):177–181. - PubMed
-
- Aufderheide TP, Lurie KG. Death by hyperventilation: a common and life-threatening problem during cardiopulmonary resuscitation. Crit Care Med. 2004;32(9 Suppl):S345–351. - PubMed
-
- Theres H, Binkau J, Laule M, et al. Phase-related changes in right ventricular cardiac output under volume-controlled mechanical ventilation with positive end-expiratory pressure. Crit Care Med. 1999;27(5):953–958. - PubMed
-
- Cheifetz IM, Craig DM, Quick G, et al. Increasing tidal volumes and pulmonary overdistention adversely affect pulmonary vascular mechanics and cardiac output in a pediatric swine model. Crit Care Med. 1998;26(4):710–716. - PubMed
Publication types
MeSH terms
Grants and funding
LinkOut - more resources
Full Text Sources
Medical
