

Transmission potential of vaccinated and unvaccinated persons infected with the SARS-CoV-2 Delta variant in a federal prison, July-August 2021
- PMID: 36572604
- PMCID: PMC9744684
- DOI: 10.1016/j.vaccine.2022.11.045
Transmission potential of vaccinated and unvaccinated persons infected with the SARS-CoV-2 Delta variant in a federal prison, July-August 2021
Abstract
Background: The extent to which vaccinated persons who become infected with SARS-CoV-2 contribute to transmission is unclear. During a SARS-CoV-2 Delta variant outbreak among incarcerated persons with high vaccination rates in a federal prison, we assessed markers of viral shedding in vaccinated and unvaccinated persons.
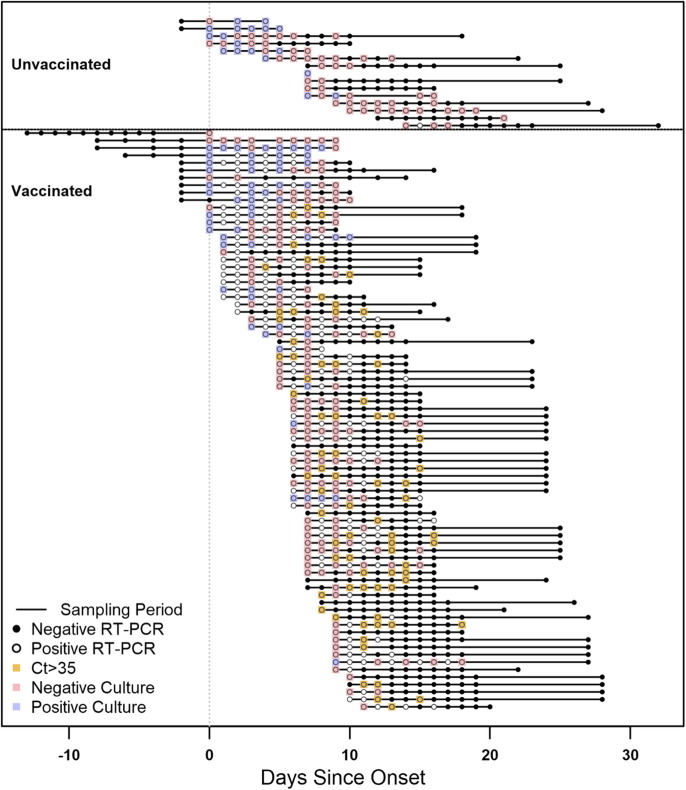
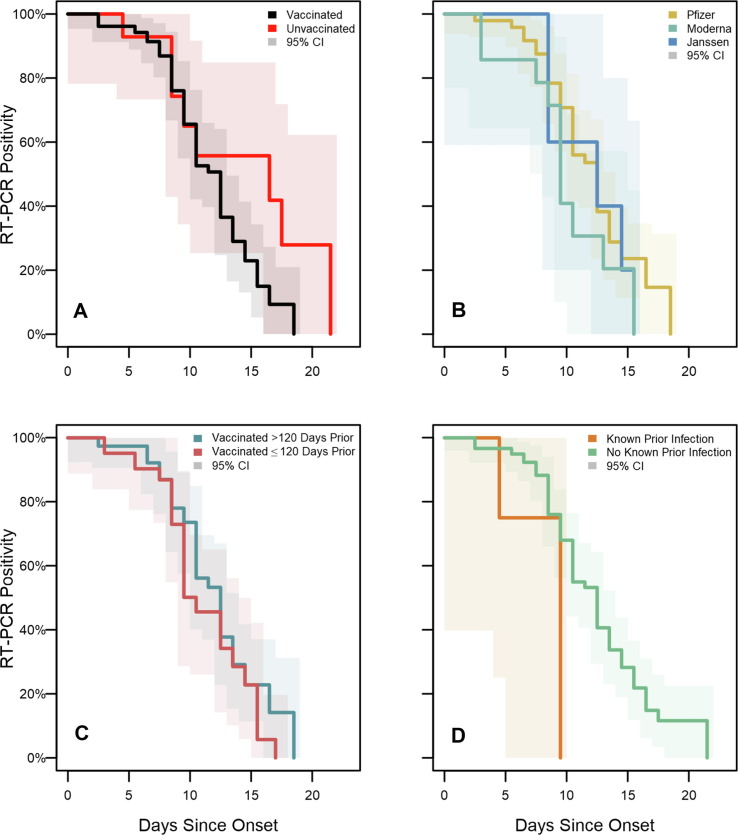
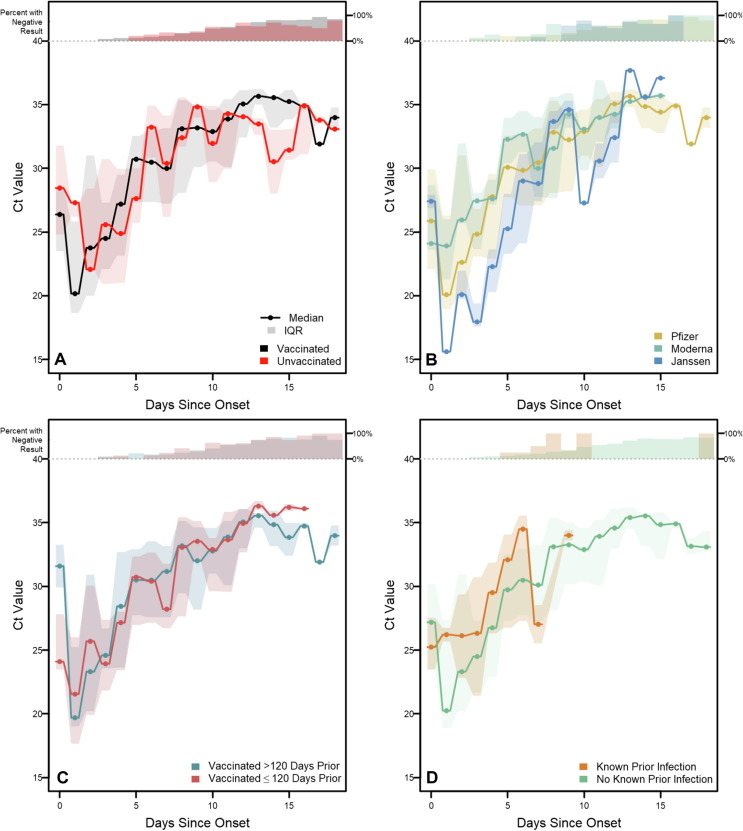
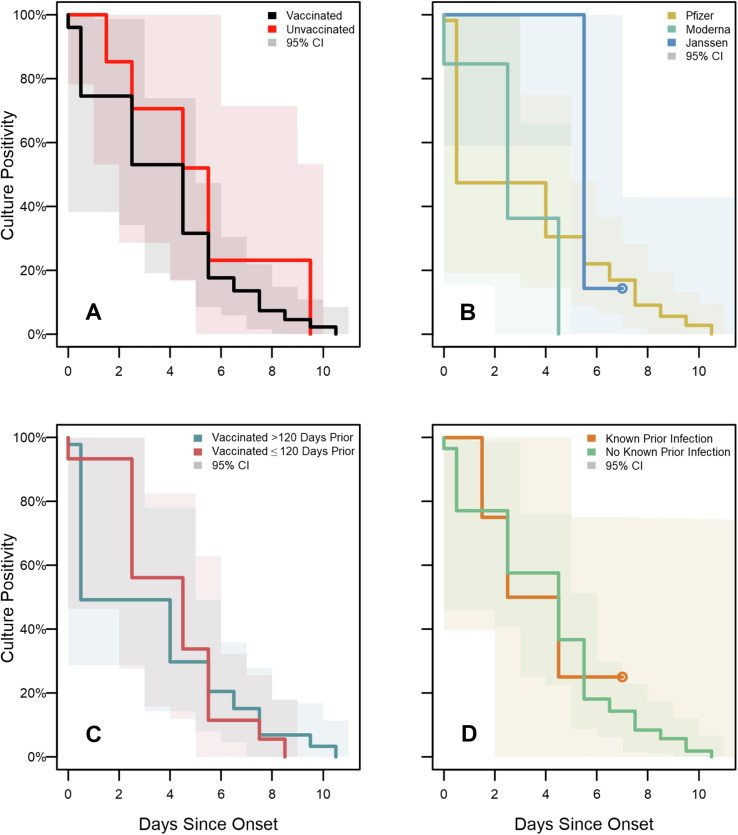
Methods: Consenting incarcerated persons with confirmed SARS-CoV-2 infection provided mid-turbinate nasal specimens daily for 10 consecutive days and reported symptom data via questionnaire. Real-time reverse transcription-polymerase chain reaction (RT-PCR), viral whole genome sequencing, and viral culture was performed on these nasal specimens. Duration of RT-PCR positivity and viral culture positivity was assessed using survival analysis.
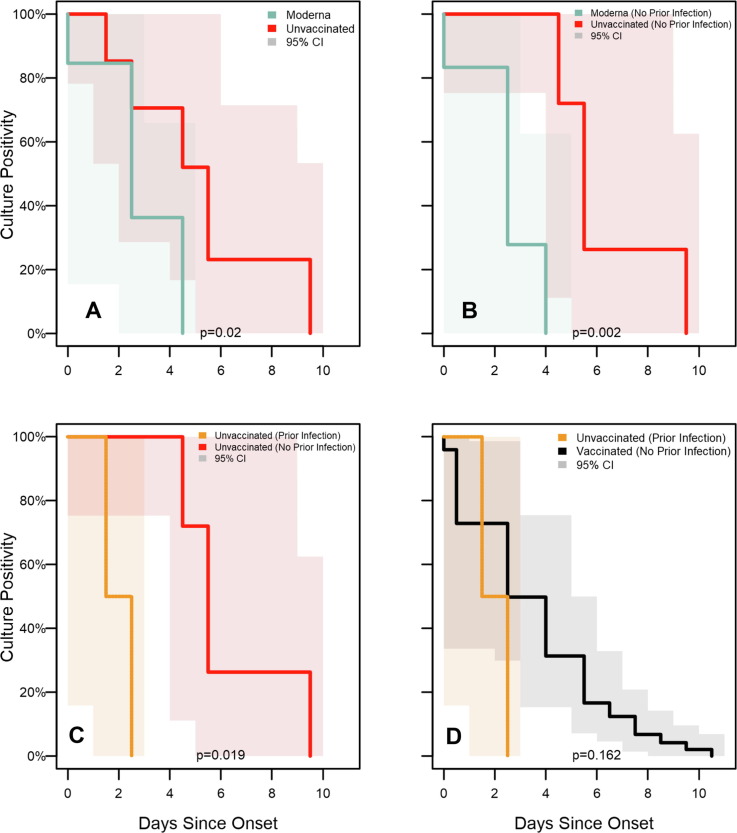
Results: A total of 957 specimens were provided by 93 participants, of whom 78 (84 %) were vaccinated and 17 (16 %) were unvaccinated. No significant differences were detected in duration of RT-PCR positivity among vaccinated participants (median: 13 days) versus those unvaccinated (median: 13 days; p = 0.50), or in duration of culture positivity (medians: 5 days and 5 days; p = 0.29). Among vaccinated participants, overall duration of culture positivity was shorter among Moderna vaccine recipients versus Pfizer (p = 0.048) or Janssen (p = 0.003) vaccine recipients. In post-hoc analyses, Moderna vaccine recipients demonstrated significantly shorter duration of culture positivity compared to unvaccinated participants (p = 0.02). When restricted to participants without reported prior infection, the difference between Moderna vaccine recipients and unvaccinated participants was more pronounced (medians: 3 days and 6 days, p = 0.002).
Conclusions: Infectious periods for vaccinated and unvaccinated persons who become infected with SARS-CoV-2 are similar and can be highly variable, though some vaccinated persons are likely infectious for shorter durations. These findings are critically important, especially in congregate settings where viral transmission can lead to large outbreaks. In such settings, clinicians and public health practitioners should consider vaccinated, infected persons to be no less infectious than unvaccinated, infected persons.
Keywords: COVID-19 transmission; Correctional facilities; Infectious disease outbreaks; Vaccination; Virus shedding.
Published by Elsevier Ltd.
Conflict of interest statement
Declaration of Competing Interest The authors declare that they have no known competing financial interests or personal relationships that could have appeared to influence the work reported in this paper.
Figures
Similar articles
-
Outbreak of SARS-CoV-2 B.1.617.2 (Delta) Variant Infections Among Incarcerated Persons in a Federal Prison - Texas, July-August 2021.MMWR Morb Mortal Wkly Rep. 2021 Sep 24;70(38):1349-1354. doi: 10.15585/mmwr.mm7038e3. MMWR Morb Mortal Wkly Rep. 2021. PMID: 34555009 Free PMC article.
-
Transmission and Infectious SARS-CoV-2 Shedding Kinetics in Vaccinated and Unvaccinated Individuals.JAMA Netw Open. 2022 May 2;5(5):e2213606. doi: 10.1001/jamanetworkopen.2022.13606. JAMA Netw Open. 2022. PMID: 35608859 Free PMC article.
-
SARS-CoV-2 viral shedding in vaccinated and unvaccinated persons: A case series.Vaccine. 2023 Mar 10;41(11):1769-1773. doi: 10.1016/j.vaccine.2022.11.030. Epub 2022 Nov 18. Vaccine. 2023. PMID: 36435706 Free PMC article.
-
Vaccine Effectiveness during Outbreak of COVID-19 Alpha (B.1.1.7) Variant in Men's Correctional Facility, United States.Emerg Infect Dis. 2022 Jul;28(7):1313-1320. doi: 10.3201/eid2807.220091. Emerg Infect Dis. 2022. PMID: 35731137 Free PMC article. Review.
-
Managing outbreaks of highly contagious diseases in prisons: a systematic review.BMJ Glob Health. 2020 Nov;5(11):e003201. doi: 10.1136/bmjgh-2020-003201. BMJ Glob Health. 2020. PMID: 33199278 Free PMC article.
Cited by
-
Reconstructing the COVID-19 incidence in India using airport screening data in Japan.BMC Infect Dis. 2024 Jan 2;24(1):12. doi: 10.1186/s12879-023-08882-w. BMC Infect Dis. 2024. PMID: 38166666 Free PMC article.
-
An efficacy and safety report based on randomized controlled single-blinded multi-centre clinical trial of ZingiVir-H, a novel herbo-mineral formulation designed as an add-on therapy in adult patients with mild to moderate COVID-19.PLoS One. 2022 Dec 6;17(12):e0276773. doi: 10.1371/journal.pone.0276773. eCollection 2022. PLoS One. 2022. PMID: 36472969 Free PMC article. Clinical Trial.
-
Active viral shedding in a vaccinated hospitalized patient infected with the delta variant (B.1.617.2) of SARS-CoV-2 and challenges of de-isolation.J Infect Public Health. 2022 Jun;15(6):628-630. doi: 10.1016/j.jiph.2022.04.011. Epub 2022 Apr 28. J Infect Public Health. 2022. PMID: 35576779 Free PMC article.
-
Duration of SARS-CoV-2 shedding: A systematic review.J Glob Health. 2024 Mar 29;14:05005. doi: 10.7189/jogh.14.05005. J Glob Health. 2024. PMID: 38547496 Free PMC article.
-
The impacts of vaccination status and host factors during early infection on SARS-CoV-2 persistence:a retrospective single-center cohort study.Int Immunopharmacol. 2023 Jan;114:109534. doi: 10.1016/j.intimp.2022.109534. Epub 2022 Nov 30. Int Immunopharmacol. 2023. PMID: 36476489 Free PMC article.
References
-
- Shamier MC, Tostmann A, Bogers S, de Wilde J, IJpelaar J, van der Kleij WA, et al. Virological characteristics of SARS-CoV-2 vaccine breakthrough infections in health care workers. medRxiv. 2021: 2021.08.20.21262158. 10.1101/2021.08.20.21262158.
-
- Brown CM, Vostok J, Johnson H, Burns M, Gharpure R, Sami S, et al. Outbreak of SARS-CoV-2 Infections, Including COVID-19 Vaccine Breakthrough Infections, Associated with Large Public Gatherings - Barnstable County, Massachusetts, July 2021. MMWR Morb Mortal Wkly Rep. 2021; 70(31): 1059-62. 10.15585/mmwr.mm7031e2. - PMC - PubMed
-
- Centers for Disease Control and Prevention. COVID Data Tracker. Atlanta, GA. US Department of Health and Human Services. Accessed October 16, 2021. [Available from: https://covid.cdc.gov/covid-data-tracker/#trends_dailycases.
MeSH terms
Supplementary concepts
LinkOut - more resources
Full Text Sources
Medical
Miscellaneous
