. 2022 Dec 26;13(1):7947.
doi: 10.1038/s41467-022-35638-y.

Transcriptional reprogramming from innate immune functions to a pro-thrombotic signature by monocytes in COVID-19

Affiliations

Transcriptional reprogramming from innate immune functions to a pro-thrombotic signature by monocytes in COVID-19

Allison K Maher et al. Nat Commun. .

Abstract

Although alterations in myeloid cells have been observed in COVID-19, the specific underlying mechanisms are not completely understood. Here, we examine the function of classical CD14+ monocytes in patients with mild and moderate COVID-19 during the acute phase of infection and in healthy individuals. Monocytes from COVID-19 patients display altered expression of cell surface receptors and a dysfunctional metabolic profile that distinguish them from healthy monocytes. Secondary pathogen sensing ex vivo leads to defects in pro-inflammatory cytokine and type-I IFN production in moderate COVID-19 cases, together with defects in glycolysis. COVID-19 monocytes switch their gene expression profile from canonical innate immune to pro-thrombotic signatures and are functionally pro-thrombotic, both at baseline and following ex vivo stimulation with SARS-CoV-2. Transcriptionally, COVID-19 monocytes are characterized by enrichment of pathways involved in hemostasis, immunothrombosis, platelet aggregation and other accessory pathways to platelet activation and clot formation. These results identify a potential mechanism by which monocyte dysfunction may contribute to COVID-19 pathology.


Conflict of interest statement

The authors declare no competing interests.

Figures

Fig. 1
Fig. 1. Unique phenotype of COVID-19 monocytes.
a tSNE plots obtained from a concatenated sample consisting of CD14+ classical monocytes from n = 15 healthy individuals, n = 15 mild and n = 15 moderate COVID-19 patients. b Box-and-whisker plots summarizing the median gMFI of the receptors analyzed (n = 25 healthy, n = 15 mild and n = 17 moderate COVID-19 individuals). c tSNE plots depicting the cell clusters identified by Phenograph from the concatenated sample in a. d Pie charts show the fraction of cells within each identified cell cluster in each patient group. e Bar graphs show the distribution (percentage) of cells from each patient group in each identified cell cluster. f Heatmap of the expression of receptors per cell cluster displayed as modified z-scores using median values. One-way ANOVA with Tukey’s correction for multiple comparisons for b. *p < 0.05, **p < 0.005, ***p < 0.001, ****p < 0.0001. Source data are provided as a Source Data file.
Fig. 2
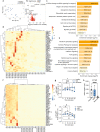
Fig. 2. Gene expression signature of COVID-19 monocytes ex vivo.
a Principal component analysis of the gene expression data computed from all genes from ex vivo healthy individual (white dots) and moderate COVID-19 (blue dots) monocyte samples. The variance explained by each component is stated in brackets. b Volcano plot of differentially expressed genes for ex vivo COVID-19 vs. healthy monocytes. Genes with fold change ≥1.5 and FDR < 0.05 are shown in red. c Bar plots depict significantly enriched (FDR < 0.05) pathways from Reactome for COVID-19 vs. healthy individual monocytes using upregulated genes (≥1.5 fold increase, FDR < 0.05). Fold enrichment plotted as log2 (FC) and bars labelled with the adjusted p-value. d Heatmap of significantly upregulated genes in COVID-19 vs. healthy monocyte that are members of the pathways in c. Gene expression values are scaled by row, with relatively high expression indicated in red and relatively low expression in blue. Both rows and columns are clustered using Euclidean distance and Ward’s method. Representative example (e) and summary gMFI (f) of phosphorylated (p)-IRF3 (Ser 396) expression for healthy (n = 14), mild (n = 15) and moderate (n = 10) COVID-19 monocytes. g IFITM2 relative gene expression (to GAPDH) measured by real-time PCR in sorted CD14+ monocytes from healthy individuals (n = 7), mild (n = 7) and moderate (n = 13) COVID-19 patients. Representative example (h) and summary gMFI (i) of IκBα expression in healthy individuals (n = 14), mild (n = 15) and moderate (n = 10) COVID-19 monocytes. Representative example (j) and summary gMFI (k) of pNFκB p65 expression in healthy individuals (n = 14), mild (n = 15) and moderate (n = 10) COVID-19 monocytes. In e, h, and k, numbers in histograms represent the gMFI of healthy (black), mild (light blue), and moderate (dark blue) COVID-19 patients. In f, g, i and k, boxes extend from the 25th to the 75th percentiles and whiskers extend up to the maximum and down to the minimum values. The horizontal line within the boxes represents the median. One-way ANOVA with Tukey’s test for multiple comparisons in f, gi, and k. *p < 0.05, **p < 0.005. Source data are provided as a Source Data file.
Fig. 3
Fig. 3. Altered expression of glycolysis-related genes in COVID-19 monocytes ex vivo.
a Bar plots depict significantly enriched (FDR < 0.05) pathways from Reactome for COVID-19 vs. healthy individual monocytes, using downregulated genes in COVID-19 vs. healthy (≥1.5 fold decrease, FDR < 0.05). The fold enrichment is plotted on the x-axis as log2(FC) and the bars labelled with the adjusted p-value. b Heatmap of the significantly downregulated genes in COVID-19 vs. healthy monocytes that are members of the pathways in i. Gene expression values are scaled by row, with relatively high expression indicated in red and relatively low expression in blue. Both rows and columns are clustered using Euclidean distance and Ward’s method. Representative example of ex vivo expression of puromycin in CD14+ monocytes measured by flow cytometry (c) and summary (d) of puromycin gMFI on healthy individuals (n = 10), mild (n = 8) and moderate (n = 10) COVID-19 monocytes (right). e Glycolytic capacity and mitochondrial dependency of monocytes from healthy individuals (n = 10), mild (n = 8) and moderate (n = 10) COVID-19 ex vivo. f Basal extracellular acidification rate (ECAR) and basal oxygen consumption rate (OCR) measured in sorted CD14+ monocytes from healthy individuals (n = 3) and COVID-19 patients (n = 4). The data in d, e, and f are shown as mean ± s.e.m. One-way ANOVA with Tukey’s test for multiple comparisons in d and e, and unpaired, two-tailed t-test in f. *p < 0.05, **p < 0.005. Source data are provided as a Source Data file.
Fig. 4
Fig. 4. Impaired ex vivo pathogen sensing by COVID-19 monocytes.
Representative example (a) and summary (b) of TNF and IL-10 production by monocytes from healthy individuals (n = 19), mild (n = 18), and moderate COVID-19 patients (n = 19) after ex vivo stimulation with SARS-CoV-2. c Summary of percentage of TNF- and IL-10-producing monocytes after stimulation with a mixture of heat-inactivated common cold coronaviruses (CCCoV) or LPS in healthy individuals (n = 12 for CCCoV and n = 13 for LPS), mild (n = 21 for CCCoV and n = 18 for LPS) and moderate (n = 12 for CCCoV and n = 19 for LPS) COVID-19 patients. Representative histograms (d) and summary (e) of CD40 expression in healthy individual (n = 20), mild (n = 22), and moderate (n = 16) COVID-19 monocytes stimulated with vehicle (grey) or SARS-CoV-2 (orange). Numbers represent percentage of CD40+ monocytes relative to vehicle-stimulated cells. f Summary of percentage of CD40+CD14+ cells after stimulation with CCCoV or LPS in healthy individuals (n = 17 for CCCoV and n = 14 for LPS), mild (n = 18 for CCCoV and n = 22 for LPS) and moderate (n = 13 for CCCoV and n = 10 for LPS) COVID-19 patients. Representative histograms (g) and summary gMFI of HLA-DR (h), CD80 (i) and CD86 (j) expression of CD14+ monocytes from healthy individuals (n = 15), mild (n = 22) and moderate (n = 9) COVID-19 patients stimulated with vehicle (white) or SARS-CoV-2 (CoV2, orange). Lines link paired samples. Representative histogram (k) and summary (l) of monocyte energetic status measured by puromycin expression (gMFI) of monocytes from healthy individuals (n = 10), mild (n = 8) or moderate (n = 10) COVID-19 patients stimulated with vehicle (open bars) or LPS (striped bars). Glycolytic capacity (m) and fatty acid and amino acid oxidation capacity (n) of CD14+ monocytes from healthy individuals (n = 7), mild (n = 4), and moderate (n = 9) COVID-19 patients stimulated with LPS. The data in b, c, e, f, l, m and n are shown as mean ± s.e.m. One-way ANOVA with Tukey’s correction for multiple comparisons in b, c, e, f, m and n. Two-way ANOVA with Tukey’s correction for multiple comparisons in h, i, j and l. *p < 0.05, **p < 0.005, ***p < 0.001, ****p < 0.0001. Source data are provided as a Source Data file.
Fig. 5
Fig. 5. Gene expression signature of SARS-CoV-2-stimulated COVID-19 monocytes.
a Principal component analysis of all genes from healthy (white) and moderate COVID-19 (blue) monocytes stimulated with SARS-CoV-2. The variance explained by each component is stated in brackets. b Volcano plots of differentially expressed genes for activated COVID-19 vs. activated healthy monocytes. Red shows genes with fold change ≥1.5 and FDR < 0.05. c Bar plots depict the top 10 significantly enriched (FDR < 0.05) pathways for stimulated COVID-19 vs. healthy individual monocytes using upregulated genes (≥1.5 fold increase, FDR < 0.05). Fold enrichment is plotted as log2(FC) and bars labelled with the adjusted p-value. d Heatmap of the top 40 significantly upregulated gene members of the pathways in c. e Bar plots depict the top 10 significantly enriched (FDR < 0.05) pathways for stimulated COVID-19 vs. healthy individual monocytes, using downregulated genes (≥1.5 fold decrease, FDR < 0.05), plotted as log2(FC) and bars labelled with the adjusted p-value. f Heatmap of the top 40 significantly downregulated genes in stimulated COVID-19 vs. healthy individual monocytes that are members of the pathways in e. g Phospho-IRF3 (Ser 396) expression (fold change to baseline gMFI) for healthy (n = 14), mild (n = 15) and moderate (n = 10) COVID-19 monocytes stimulated with LPS (mean ± s.e.m.). h IFITM2 gene expression (relative to GAPDH) measured by real-time PCR and stimulated monocytes from healthy individuals (n = 14), mild (n = 7), and moderate (n = 23) COVID-19 patients. Boxes extend from the 25th to the 75th percentiles, the horizontal line within the boxes shows the median, and the whiskers extend from the minimum to the maximum values. i Phospho-NFκB p65 (Ser 529) expression (fold change to baseline gMFI) for healthy (n = 14), mild (n = 15), and moderate (n = 10) COVID-19 monocytes stimulated with LPS (mean±s.e.m.). For d and f, gene expression values are scaled by row; red indicates relatively high expression, and blue low expression. Both rows and columns are clustered using Euclidean distance and Ward’s method. Mixed model with Tukey’s post hoc test for g and i. One-way ANOVA with Tukey’s test for h. For g and i, two-way ANOVA with Tukey’s correction for baseline vs. other time points within the same group. *p < 0.05, ***p < 0.001 for healthy individuals, #p < 0.05, ##p < 0.005 for mild COVID-19 patients, $$$p < 0.001 for moderate COVID-19 patients. ****p < 0.0001. Source data are provided as a Source Data file.
Fig. 6
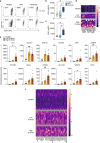
Fig. 6. Monocytes from moderate COVID-19 patients are functionally pro-thrombotic.
Monocytes were isolated from healthy individuals, mild and moderate COVID-19 patients, and left unstimulated or stimulated with UV-inactivated SARS-CoV-2 for 20 h. a Representative dot plots of the expression of CD41 on ex vivo isolated (upper row) or stimulated (lower row) monocytes from healthy individuals (left), mild (middle), and moderate (right) COVID-19 patients (n = 4 individuals per group) after co-culture with freshly isolated platelets from a healthy individual. Numbers in each dot plot represent CD41 gMFI. b, c Summary of CD41 gMFI on unstimulated (b) or stimulated (c) monocytes after co-culture with healthy donor platelets (n = 4 individuals in each group). Boxes in b and c extend from the 25th to the 75th percentiles and whiskers extend down to the minimum and up to the maximum values. d RNA-seq datasets from ex vivo isolated monocytes from moderate COVID-19 patients were grouped into low and high D-dimer concentrations. Heatmap of z-score-transformed normalized read counts of significantly upregulated genes in “hemostasis” and “platelet activation, signaling, and aggregation” pathways in healthy (n = 6), low D-dimer concentration (n = 4) and high D-dimer concentration (n = 6) moderate COVID-19 monocytes. Gene expression values are scaled by column, and each row represents one individual. e Summary of normalized gene counts of the genes in d, shown as mean±s.e.m. f RNA-seq datasets from stimulated monocytes from moderate COVID-19 patients were grouped into low and high D-dimer concentrations. Heatmap of z-score-transformed normalized read counts of significantly upregulated genes in “Integrin cell surface interactions”, “Extracellular matrix organization”, “Response to elevated platelet cytosolic Ca2+”, “Signaling by PDGF”, “Hemostasis” and “Platelet aggregation (plug formation)” pathways in healthy (n = 12), low D-dimer concentration (n = 8) and high D-dimer concentration (n = 6) moderate COVID-19 monocytes. Gene expression values are scaled by column, and each row represents one individual. One-way ANOVA with Tukey’s correction for multiple comparisons for b, c, e. *p < 0.05, **p < 0.005. Source data are provided as a Source Data file.
Fig. 7
Fig. 7. Endotoxin-induced tolerance signature significantly enriched in COVID-19 monocytes.
Correlation plot of sepsis vs. healthy individual gene expression signature and ex vivo (a) or stimulated (b) COVID-19 vs. healthy individual monocyte gene expression signature. Each point represents a gene detected in both the sepsis public microarray dataset and the COVID-19 RNA-seq dataset. The log2(FC) between sepsis and healthy controls is plotted against the log2(FC) for ex vivo COVID-19 monocytes vs. healthy control monocytes, and the points are colored according to the significance and direction of effect in the COVID-19 contrast (grey, not significant; red, significantly upregulated; blue, significantly downregulated). Correlation plot of endotoxin-induced tolerance gene signature and ex vivo (c) or stimulated (d) COVID-19 vs. healthy monocyte signature. Each point represents a gene detected in both the endotoxin gene signature public dataset and our COVID-19 vs. healthy RNA-seq dataset. The log2(FC) between endotoxin tolerance and LPS response is plotted against the log2(FC) for COVID-19 vs. healthy monocytes, and the points colored according to the significance and direction of effect in the COVID-19 contrast as in a. Some of the most differentially expressed genes in the COVID-19 vs. healthy monocyte dataset are identified in the plot. e Barcode plot showing enrichment of the endotoxin tolerance (ET) gene set in the differential gene expression results for SARS-CoV-2-stimulated COVID-19 vs healthy monocytes. The ranked test statistics from DESeq2 for the SARS-CoV-2-stimulated COVID-19 vs. healthy contrast are represented by the central shaded bar, with genes downregulated in COVID-19 on the left and upregulated genes on the right. The ranks of the ET gene set within the COVID-19 contrast are indicated by the vertical lines in the central bar. The weights of these genes (log2(FC) from the ET gene expression analysis) are indicated by the height of the red and blue lines above and below the central bar. The red and blue lines at the top and bottom indicate relative enrichment of the ET genes (split into genes with positive and negative FCs in the ET contrast) in each part of the plot.

References

    1. Fu L, et al. Clinical characteristics of coronavirus disease 2019 (COVID-19) in China: A systematic review and meta-analysis. J. Infect. 2020;80:656–665. doi: 10.1016/j.jinf.2020.03.041. - DOI - PMC - PubMed
    1. Bost P, et al. Host-viral infection maps reveal signatures of severe COVID-19 patients. Cell. 2020;181:1475–1488 e1412. doi: 10.1016/j.cell.2020.05.006. - DOI - PMC - PubMed
    1. Merad M, Martin JC. Pathological inflammation in patients with COVID-19: a key role for monocytes and macrophages. Nat. Rev. Immunol. 2020;20:355–362. doi: 10.1038/s41577-020-0331-4. - DOI - PMC - PubMed
    1. Jafarzadeh A, Chauhan P, Saha B, Jafarzadeh S, Nemati M. Contribution of monocytes and macrophages to the local tissue inflammation and cytokine storm in COVID-19: Lessons from SARS and MERS, and potential therapeutic interventions. Life Sci. 2020;257:118102. doi: 10.1016/j.lfs.2020.118102. - DOI - PMC - PubMed
    1. Remy, K. E. et al. Severe immunosuppression and not a cytokine storm characterizes COVID-19 infections. JCI Insight5, 10.1172/jci.insight.140329 (2020). - PMC - PubMed

Publication types