. 2023 Apr;128(6):967-981.
doi: 10.1038/s41416-022-02093-x. Epub 2022 Dec 26.

3D collagen migration patterns reveal a SMAD3-dependent and TGF-β1-independent mechanism of recruitment for tumour-associated fibroblasts in lung adenocarcinoma

Affiliations

3D collagen migration patterns reveal a SMAD3-dependent and TGF-β1-independent mechanism of recruitment for tumour-associated fibroblasts in lung adenocarcinoma

Yago Juste-Lanas et al. Br J Cancer. 2023 Apr.

Abstract

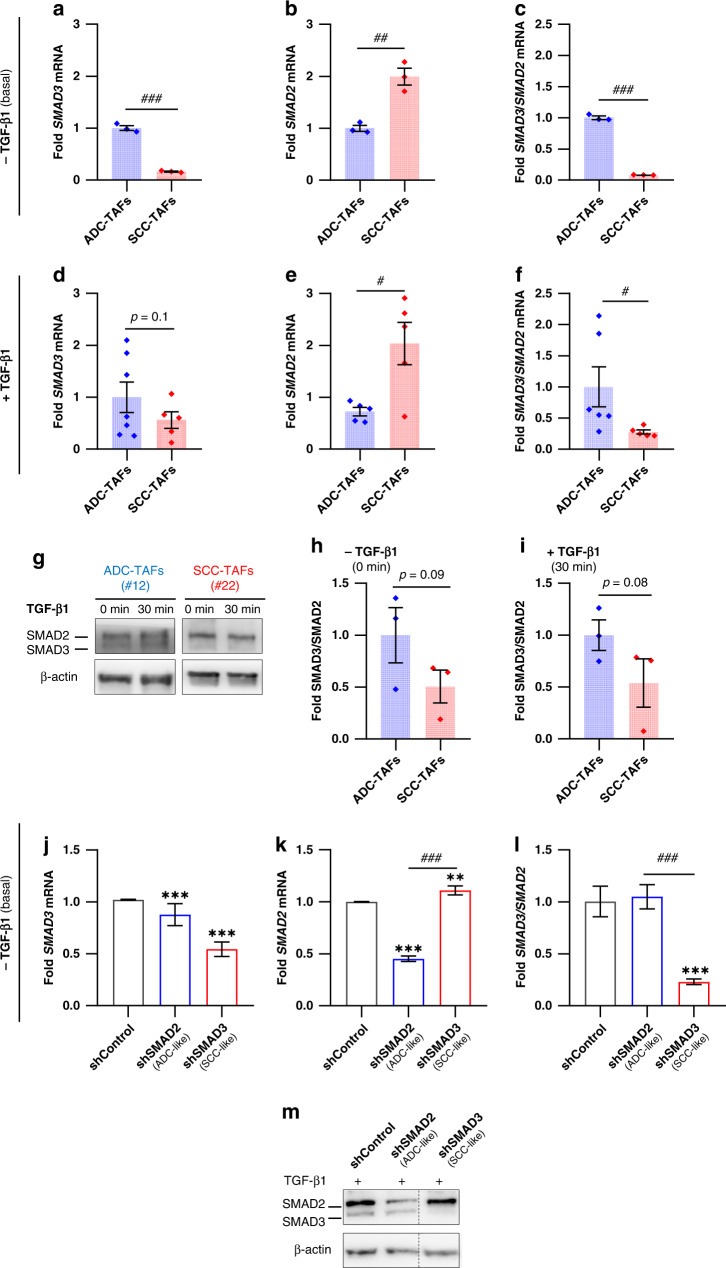
Background: The TGF-β1 transcription factor SMAD3 is epigenetically repressed in tumour-associated fibroblasts (TAFs) from lung squamous cell carcinoma (SCC) but not adenocarcinoma (ADC) patients, which elicits a compensatory increase in SMAD2 that renders SCC-TAFs less fibrotic. Here we examined the effects of altered SMAD2/3 in fibroblast migration and its impact on the desmoplastic stroma formation in lung cancer.

Methods: We used a microfluidic device to examine descriptors of early protrusions and subsequent migration in 3D collagen gels upon knocking down SMAD2 or SMAD3 by shRNA in control fibroblasts and TAFs.

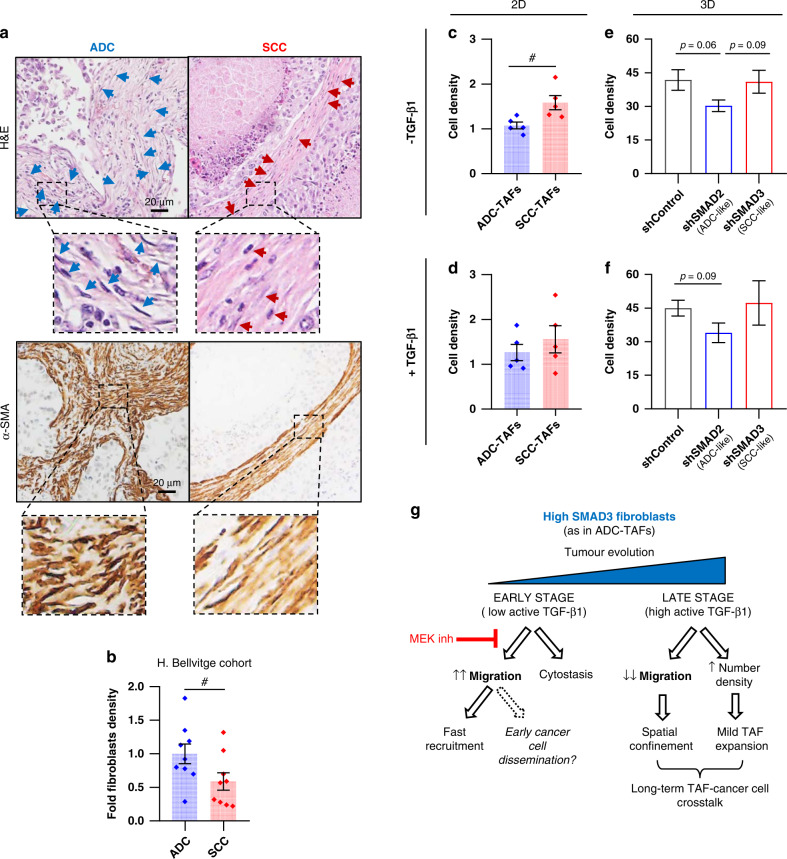
Results: High SMAD3 conditions as in shSMAD2 fibroblasts and ADC-TAFs exhibited a migratory advantage in terms of protrusions (fewer and longer) and migration (faster and more directional) selectively without TGF-β1 along with Erk1/2 hyperactivation. This enhanced migration was abrogated by TGF-β1 as well as low glucose medium and the MEK inhibitor Trametinib. In contrast, high SMAD2 fibroblasts were poorly responsive to TGF-β1, high glucose and Trametinib, exhibiting impaired migration in all conditions.

Conclusions: The basal migration advantage of high SMAD3 fibroblasts provides a straightforward mechanism underlying the larger accumulation of TAFs previously reported in ADC compared to SCC. Moreover, our results encourage using MEK inhibitors in ADC-TAFs but not SCC-TAFs.


Conflict of interest statement

The authors declare no competing interests.

Figures

Fig. 1
Fig. 1. Genetic models to mimic SMAD2/3 alterations in patient-derived ADC-TAFs and SCC-TAFs.
ac Fold SMAD3 (a) and SMAD2 (b) mRNA and corresponding ratio (c) in primary lung TAFs cultured in 2D for 3 days in basal conditions (i.e. without exogenous TGF-β1) (3 ADC, 3 SCC). df Fold SMAD3 (d) and SMAD2 (e) mRNA and corresponding ratio (f) in primary lung TAFs cultured in 2D for 3 days in the presence of 2.5 ng/ml TGF-β1 (7 ADC, 5 SCC). g Representative Western blot for total SMAD2, SMAD3 and β-actin of ADC-TAFs and SCC-TAFs from randomly selected patients at 0 min or 30 min after stimulation with TGF-β1. h, i Densitometry analysis of total SMAD3/SMAD2 ratio in TAFs from randomly selected patients (3 ADC, 3 SCC) at 0 min (h) or 30 min (i) after stimulation with TGF-β1. jl Fold SMAD3 (j), SMAD2 (k) and SMAD3/SMAD2 mRNA ratio (l) of shControl, shSMAD2 and shSMAD3 control fibroblasts from patient #5 cultured in 2D for 3 days in basal conditions. m Representative Western blot for total SMAD2, SMAD3 and β-actin of shControl, shSMAD2 and shSMAD3 control fibroblasts (#5) in basal conditions. Error bars represent mean ± s.e.m. Each dot corresponds to a different patient (ai). #p < 0.05; ##p < 0.01; ###p < 0.005 comparing either ADC-TAFs and SCC-TAFs or shSMAD2 and shSMAD3. **p < 0.01; ***p < 0.005 with respect to shControl. Statistical comparisons were done using Student’s t test.
Fig. 2
Fig. 2. Impact of altered SMAD2/3 in 3D collagen protrusions of lung fibroblasts and ADC-TAFs with or without exogenous TGF-β1.
a Outline of the microdevice-based analysis of protrusions (0–4 h) of single fibroblasts cultured in dense 3D collagen gels. b Representative phase contrast images of single control fibroblasts (#5) for each group (shControl, shSMAD2, shSMAD3) cultured in 3D collagen gels within the microdevice for 4 h in basal conditions (−TGF-β1). Scale bar, 50 μm. Representative images at other time points are shown in Supplementary Fig. 3A, B. c, d Time-course of the average number of protrusions (c) and protrusion length (d) of 4 fibroblasts for each group cultured in 3D in basal conditions. eg Number of protrusions (e), protrusion length (f) and evolution rate (g) averaged for 4 fibroblasts per group within the last 1 h (3–4 h) of the experimental time-window (e, f) or the full experiment (0–4 h) (g) in basal conditions (shown as bars). Each dot indicates the average of a single fibroblast henceforth. h Representative phase contrast images of single control fibroblasts (#5) for each group (shControl, shSMAD2, shSMAD3) cultured in 3D collagen gels within the microdevice for 4 h in the presence of TGF-β1. Scale bar, 50 μm. Representative images at other time points are shown in Supplementary Fig. 3A, B. i, j Time-course of the average number of protrusions (i) and protrusion length (j) of 4 fibroblasts for each group cultured in 3D in the presence of TGF-β1. km Number of protrusions (k), protrusion length (l) and evolution rate (m) averaged for 4 fibroblasts per group as in eg in the presence of TGF-β1. n Representative phase contrast images of the aspect ratio analysis of single shSMAD2 fibroblasts cultured in 3D collagen gels for 4 h without or with TGF-β1. Scale bar, 50 μm. Further details on the assessment of the aspect ratio shown in Supplementary Fig. 1. o, p Aspect ratio averaged for 4 fibroblasts per group at the end of the experimental time-window (4 h) in basal conditions (o) or in the presence of TGF-β1 (p). Error bars represent mean ± s.e.m. Each dot corresponds to the average of a different fibroblast (eg, km, o, p) examined within 3 independent microdevices. #p < 0.05 comparing shSMAD2 and shSMAD3. Other p-values comparing to shControl. Statistical comparisons were done using Student’s t test.
Fig. 3
Fig. 3. Impact of altered SMAD2/3 in 3D collagen migration in lung fibroblasts and ADC-TAFs in basal conditions (no exogenous TGF-β1).
a Outline of the microdevice-based analysis of migration (24–48 h) of single fibroblasts cultured in dense 3D collagen gels. b Representative phase contrast images of single control fibroblasts (#5) for each group (shControl, shSMAD2, shSMAD3) cultured in 3D collagen gels within the microdevice in basal conditions during the experimental time-window (24–48 h). Yellow, green and red dots indicate the position of the fibroblast centre at 24, 36 and 48 h, respectively. Scale bar, 50 μm. c Trajectory maps corresponding to the tracking of the centre of fibroblasts from each group in basal conditions throughout the experimental time-window. The starting of each fibroblast was shifted to the origin of coordinates for clarity here and thereafter. df Average cell speed (d), net displacement (e) and persistence ratio (f) in basal conditions of single control fibroblasts (#5) for each group (shControl, shSMAD2, shSMAD3) gathered from 3 independent microdevices per condition (shown as bars). Each dot indicates the average of a single fibroblast henceforth. Note that persistence values range between 0 and 1, where 1 indicates migration without changing direction [30]. g Fold SMAD3 mRNA of shControl and shSMAD3 ADC-TAFs (#37) cultured as in Fig. 1j. h Representative phase contrast images of single shControl or shSMAD3 ADC-TAFs (#37) cultured as in b. Yellow, green and red dots indicate the position of the fibroblast centre at 24, 36 and 48 h, respectively. Scale bar, 50 μm. i Trajectory maps corresponding to the tracking of the centre of ADC-TAFs from each group in basal conditions throughout the experimental time-window as in c. jl Average cell speed (j), net displacement (k) and persistence ratio (l) of single ADC-TAFs (#37) for each group (shown as bars) cultured as in b. Error bars represent mean ± s.e.m. ###p < 0.005 comparing shSMAD2 and shSMAD3. *p < 0.05; ***p < 0.005 with respect to shControl or comparing shControl and shSMAD3 ADC-TAFs. Statistical comparisons were done using Student’s t test or Mann–Whitney (df). Mean values correspond to three independent microdevices.
Fig. 4
Fig. 4. Impact of altered SMAD2/3 in 3D collagen migration in lung fibroblasts and ADC-TAFs stimulated with TGF-β1.
a Representative phase contrast images of single control fibroblasts (#5) for each group (shControl, shSMAD2, shSMAD3) cultured in 3D collagen gels within the microdevice with TGF-β1 during the experimental time-window (24–48 h). Yellow, green and red dots indicate the position of the fibroblast centre at 24 h, 36 h and 48 h, respectively. Scale bar, 50 μm. b Trajectory maps corresponding to the tracking of the centre of fibroblasts from each group in basal conditions throughout the experimental time-window. ce Average cell speed (c), net displacement (d) and persistence ratio (e) with TGF-β1 of single control fibroblasts (#5) for each group (shControl, shSMAD2, shSMAD3) gathered from three independent microdevices per condition (shown as bars). Each dot indicates the average of a single fibroblast. fh Fold average cell speed (f), net displacement (g) and persistence ratio (h) assessed in the presence and absence of TGF-β1. Error bars were computed using error propagation [67]. i Representative phase contrast images of single shControl or shSMAD3 ADC-TAFs (#37) cultured as in a. Yellow, green and red dots indicate the position of the fibroblast centre at 24, 36 and 48 h, respectively. Scale bar, 50 μm. j Trajectory maps corresponding to the tracking of the centre of ADC-TAFs from each group with TGF-β1 throughout the experimental time-window as in b. km Fold average cell speed (k), net displacement (l) and persistence ratio (m) of ADC-TAFs (#37) for each group assessed in the presence and absence of TGF-β1. ###p < 0.005 comparing shSMAD2 and shSMAD3. **p < 0.01; ***p < 0.005 with respect to shControl or comparing shControl and shSMAD3 ADC-TAFs. Statistical comparisons were done using Student’s t test or Mann–Whitney (ce). Mean values correspond to three independent microdevices.
Fig. 5
Fig. 5. Mechanistic insights on the intrinsic basal migration priming of shSMAD3 fibroblasts and ADC-TAFs: role of high glucose, insulin–transferrin–selenium and Erk1/2.
ac Average migration assessed using the Boyden Transwell assay of shSMAD2 and shSMAD3 control fibroblasts (#5) in the absence (a) or presence of TGF-β1 (b), and corresponding fold values (c). The same plots including shControl fibroblasts are shown in Supplementary Fig. 5A, B. Bottom panels show representative images of the porous membrane of the Transwell insert containing the migratory fibroblasts stained with crystal violet at the end of the experimental time-window (16 h) henceforth. d, e Average Transwell migration of shControl versus shSMAD3 ADC-TAFs (#37) (d) and siControl versus siSMAD3 ADC-TAFs (#13) (e) in the absence of TGF-β1. SMAD3 mRNA levels of siControl and siSMAD3 ADC-TAFs are shown in Supplementary Fig. 5C. f, g Average Transwell migration with low or standard high glucose concentration in either shSMAD2 and shSMAD3 control fibroblasts (#5) (f) or siControl and siSMAD3 ADC-TAFs (#13) (g) in the absence of TGF-β1 (i.e. basal conditions). Low glucose conditions started 3 days before seeding cells for the migration experiment. Basal average Transwell migration with low or high glucose in the presence or absence of insulin-transferrin-selenium (ITS) are shown in Supplementary Fig. 5F, G. h, i Representative Western blot analysis of phosphorylated Erk1/2 (pErk1/2), total Erk1/2 and loading (α-tubulin) of shSMAD2 and shSMAD3 fibroblasts cultured as in f and examined 30 min after seeding. Corresponding densitometric values of pErk1/2/α-tubulin are shown at the bottom (h) thereafter. Average densitometry ratio of pErk1/2 / α-tubulin in shSMAD2 with respect to shSMAD3 are shown in i. j Western blot of pErk1/2, total Erk1/2 and loading of siControl and siSMAD3 ADC-TAFs (#13) cultured as in h. Densitometry ratio of pErk1/2/α-tubulin in siControl with respect to siSMAD3 is shown at the bottom. km Average Transwell migration with or without the MEK1/2 inhibitor Trametinib (100 nM) in either shSMAD2 or shSMAD3 control fibroblasts (#5) (k), shControl and shSMAD3 ADC-TAFs (#37) (l) or siControl and siSMAD3 ADC-TAFs (#13) (m) in the absence of TGF-β1. Error bars represent mean ± s.e.m. #p < 0.05; ###p < 0.005 comparing shSMAD2 and shSMAD3. *p < 0.05; ***p < 0.005 with respect to shControl. +p < 0.05; +++p < 0.005 comparing either low and high glucose or the presence and absence of Trametinib. Statistical comparisons were done using Student’s t test. Mean values correspond to n ≥ 2 experiments.
Fig. 6
Fig. 6. Differential TAF number density in ADC and SCC and potential contribution of SMAD2/3-regulated migration versus proliferation.
a Illustrative haematoxylin–eosin (H&E) (top) and α-SMA (bottom) staining of ADC and SCC patients. Arrow heads point to scattered and spindle-shaped nuclei, which are histologic hallmarks of TAFs. b TAF number density assessed by morphometric analysis of haematoxylin images from the Hospital de Bellvitge patient cohort (10 ADC, 9 SCC). Independent validation with a smaller cohort is shown in Supplementary Fig. 6A. c, d Fibroblast number density of TAFs randomly selected from our cohort (5 ADC, 5 SCC) cultured in 2D in the absence (c) or presence (d) of TGF-β1. e, f Fibroblast number density of the control fibroblasts (#5) from all groups (shControl, shSMAD2, shSMAD3) cultured within the 3D collagen gels used to analyse migration in the absence (e) or presence (f) of TGF-β1. Corresponding values of fibroblasts cultured in 2D as in c are shown in Supplementary Fig. 6B, C. g Emerging model for the impact of the interplay between SMAD3, migration and proliferation in ADC-TAFs in early and late stages. Error bars represent mean ± s.e.m. Each dot corresponds to a different patient (bd). #p < 0.05; comparing either ADC-TAFs and SCC-TAFs or shSMAD2 and shSMAD3. Other p-values with respect to shControl. Statistical comparisons were done using Student’s t test. Mean values correspond to n ≥ 2 experiments.

References

    1. Siegel RL, Miller KD, Jemal A. Cancer statistics, 2019. CA Cancer J Clin. 2019;69:7–34. doi: 10.3322/caac.21551. - DOI - PubMed
    1. Chen Z, Fillmore CM, Hammerman PS, Kim CF, Wong K-K. Non-small-cell lung cancers: a heterogeneous set of diseases. Nat Rev Cancer. 2014;14:535–46. doi: 10.1038/nrc3775. - DOI - PMC - PubMed
    1. Kalluri R. The biology and function of fibroblasts in cancer. Nat Rev Cancer. 2016;16:582–98. doi: 10.1038/nrc.2016.73. - DOI - PubMed
    1. Ohlund D, Elyada E, Tuveson D. Fibroblast heterogeneity in the cancer wound. J Exp Med. 2014;211:1503–23. doi: 10.1084/jem.20140692. - DOI - PMC - PubMed
    1. Sahai E, Astsaturov I, Cukierman E, DeNardo DG, Egeblad M, Evans RM, et al. A framework for advancing our understanding of cancer-associated fibroblasts. Nat Rev Cancer. 2020;20:174–86. doi: 10.1038/s41568-019-0238-1. - DOI - PMC - PubMed

Publication types

MeSH terms

Grants and funding