. 2023 Feb;37(2):276-287.
doi: 10.1038/s41375-022-01801-z. Epub 2022 Dec 26.

Nuclear factor I-C overexpression promotes monocytic development and cell survival in acute myeloid leukemia

Affiliations

Nuclear factor I-C overexpression promotes monocytic development and cell survival in acute myeloid leukemia

Namrata Rastogi et al. Leukemia. 2023 Feb.

Abstract

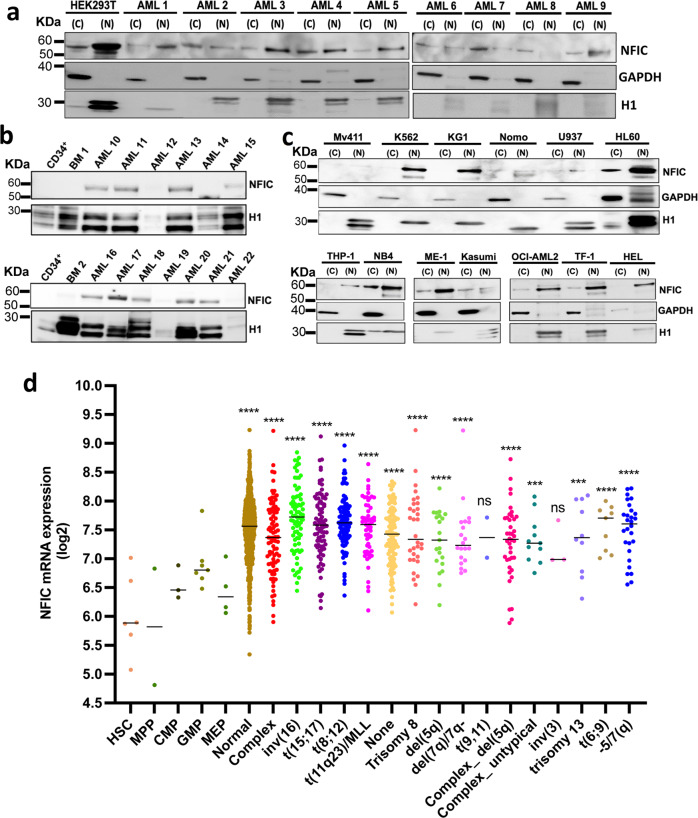
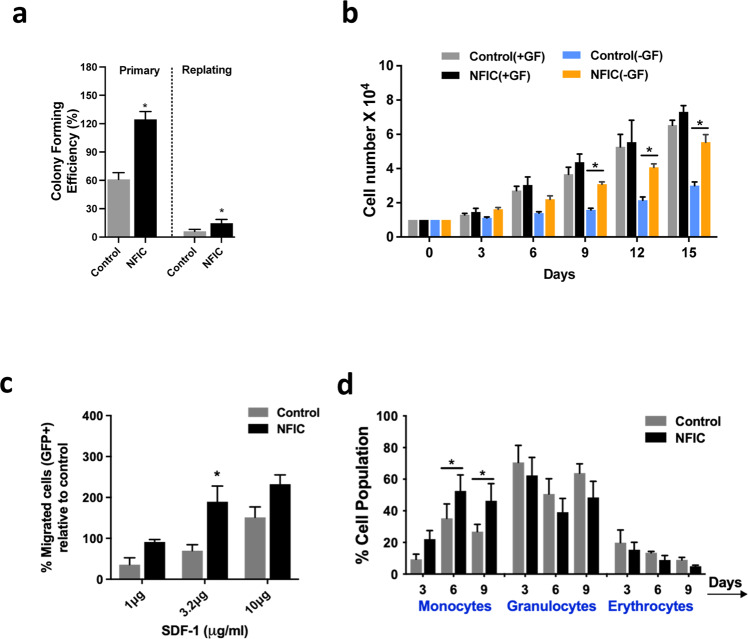
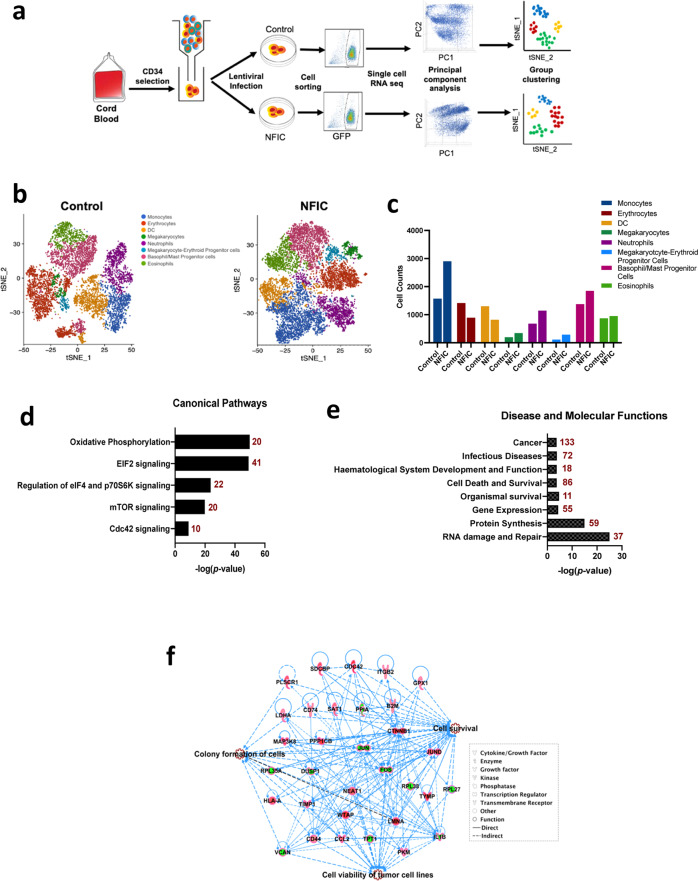
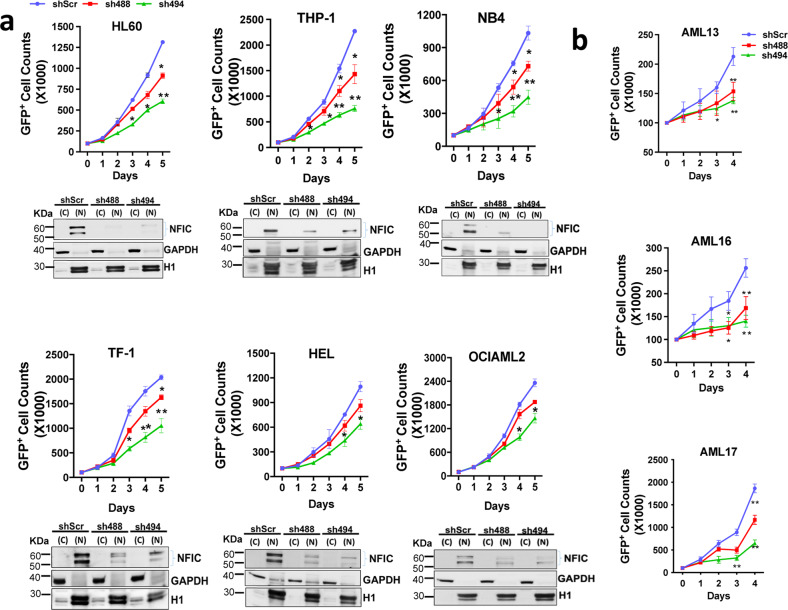
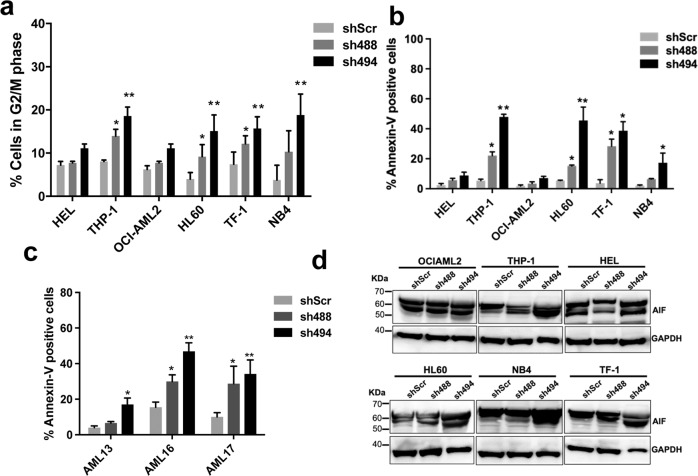
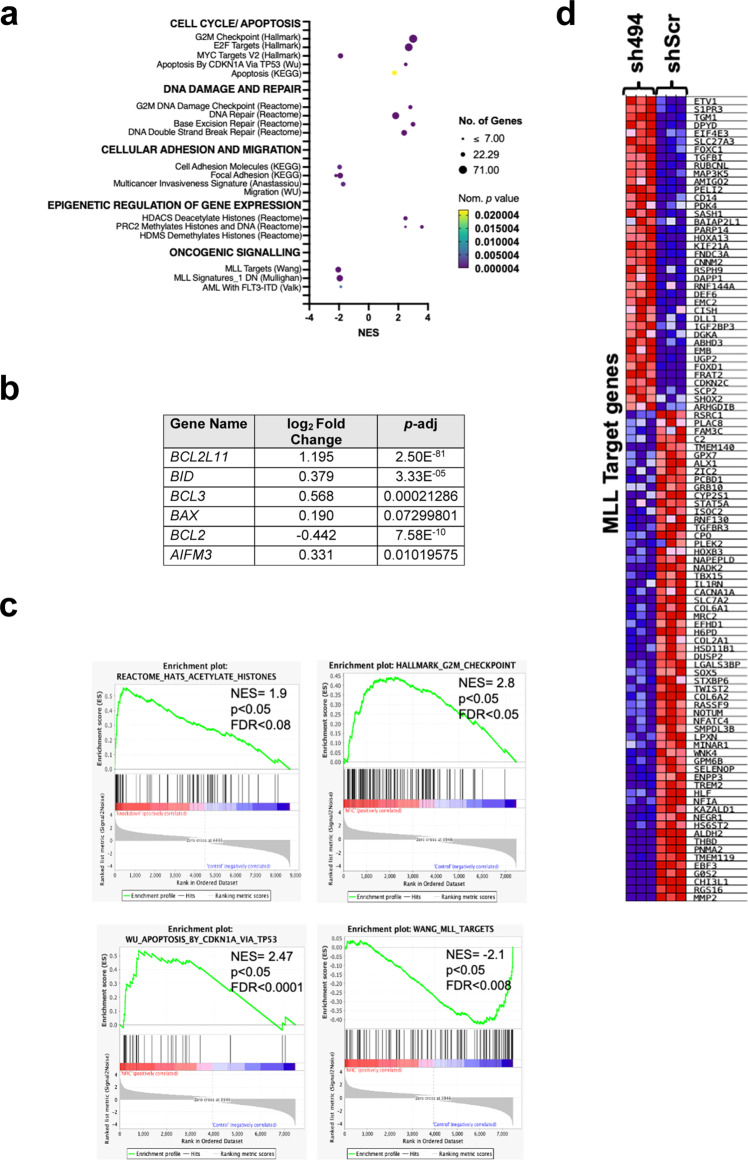
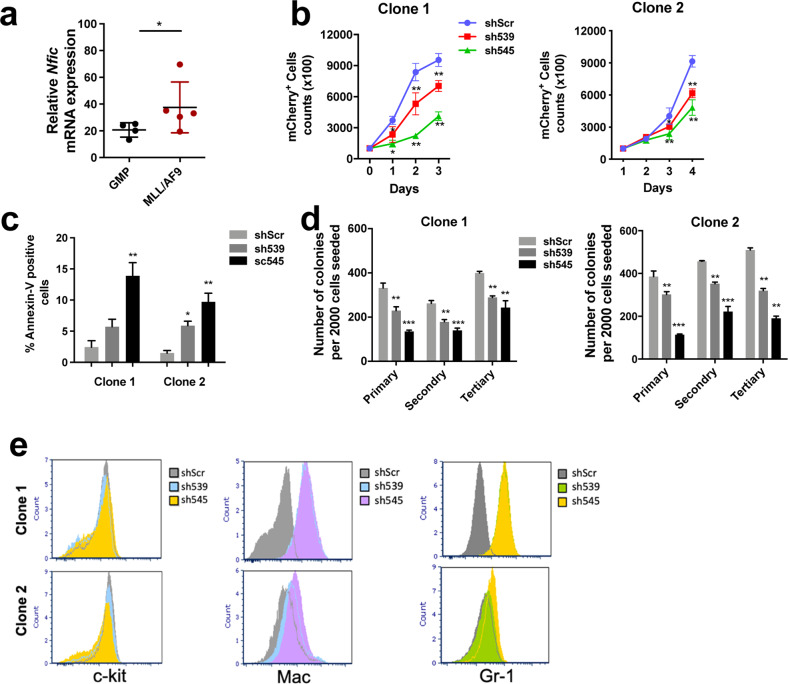
Nuclear factor I-C (NFIC) belongs to a family of NFI transcription factors that binds to DNA through CAATT-boxes and are involved in cellular differentiation and stem cell maintenance. Here we show NFIC protein is significantly overexpressed in 69% of acute myeloid leukemia patients. Examination of the functional consequences of NFIC overexpression in HSPCs showed that this protein promoted monocytic differentiation. Single-cell RNA sequencing analysis further demonstrated that NFIC overexpressing monocytes had increased expression of growth and survival genes. In contrast, depletion of NFIC through shRNA decreased cell growth, increased cell cycle arrest and apoptosis in AML cell lines and AML patient blasts. Further, in AML cell lines (THP-1), bulk RNA sequencing of NFIC knockdown led to downregulation of genes involved in cell survival and oncogenic signaling pathways including mixed lineage leukemia-1 (MLL-1). Lastly, we show that NFIC knockdown in an ex vivo mouse MLL::AF9 pre-leukemic stem cell model, decreased their growth and colony formation and increased expression of myeloid differentiation markers Gr1 and Mac1. Collectively, our results suggest that NFIC is an important transcription factor in myeloid differentiation as well as AML cell survival and is a potential therapeutic target in AML.


Conflict of interest statement

The authors declare no competing interests.

Figures

Fig. 1
Fig. 1. NFIC is overexpressed in AML.
a Immunoblot showing NFIC (~56KDa) protein expression in subcellular fractions of FAB-M1 AML patient blasts. NFIC overexpressing HEK-293T cells (Supplementary Fig S1b) were used as a positive control to determine NFIC expression. GAPDH and Histone 1 (H1) were used as loading controls for cytosolic (C) and nuclear (N) protein respectively. b Immunoblot of NFIC protein expression in AML patient blasts compared to CD34+ HSPCs and normal human bone marrow (BM) in nuclear lysates in a second independent patient cohort to that of samples previously analyzed by MS. c NFIC protein expression in AML cell lines. d NFIC mRNA expression (Log2) in Normal hematopoietic subsets and in different AML subtypes (For complete description of AML subtypes and normal blood cells refer to Bloodspot data set for BloodPool: AML samples with normal cells) and normal hematopoietic cells analyzed using BloodSpot and the following data sets: GSE13159, GSE15434, GSE61804, GSE14468, The Cancer Genome Atlas (TCGA) and GSE42519 (for normal blood cells) [–28] Horizontal markers indicate median expression intensities. Tukey’s test was used to analyze the level of statistical significance of individual AML subtype compared to normal HSC where ***p < 0.001, ****p < 0.001 and ‘ns’ is non-significant.
Fig. 2
Fig. 2. NFIC overexpression disrupts normal hematopoiesis.
a Bar graph represents average number of primary and secondary granulo-myelocytic (GM) colonies in NFIC overexpressed (NFIC) vs GFP only control. Infected CD34+ HSPCs were sorted for GFP three days post infection and seeded at a density of single cell per 3 wells in 96 well plates for colony formation assay. Myeloid colonies were counted after 14 days of culture. For replating assay, primary colonies were pooled, counted, and re-seeded by limiting dilution (1 cell/well) in 96 well plates and counted after 14 days. Data represents mean ± 1 SD (n = 3). Statistical significance was analyzed using Dunnett’s multiple comparison test with *p < 0.05 b Total cell counts represented as bar graphs. CD34+ HSPCs expressing NFIC or Control were sorted on day 3 for GFP+ and seeded in 24-well plate in IMDM with growth factor (+GF) or without growth factors (−GF) for cell growth and survival assay. Live cells were counted using trypan blue stain at indicated days. Data represents mean ± 1 SD (n = 3). Statistical significance was analyzed using Dunnett’s multiple comparison test with *p < 0.05. c GFP+ CD34+ HSPCs at 3 days post infection were seeded on top of transwell inserts in 24-well plates containing chemotactic media with SDF-1 at indicated concentrations. Migration response was calculated as the percentage of GFP-positive cells that migrated across the transwell membrane. Data represents mean ± 1 SD (n = 3). d Bar graphs represents percentage cell populations of monocytes, granulocytes, and erythrocytes at 3, 6, and 9 day of culture. CD34+ HSPCs, expressing NFIC or GFP only (Control) were seeded in cytokine-rich media to study differentiation at indicated days. Cell surface differentiation markers on GFP-gated cells were used to identify different cellular types (details in the Supplementary methods). Data represent mean ± 1 SD (n = 3). Statistical significance was analyzed using Dunnett’s multiple comparison test with test with *p < 0.05.
Fig. 3
Fig. 3. Single-cell RNA sequencing reveals increases in numbers and changes in cellular gene expression of NFIC overexpressing monocytes.
a Graphical representation of single-cell mRNA sequencing of NFIC overexpressing normal blood cells. 8000 GFP+ sorted cells were processed for nuclei isolation, library preparation, and single-cell RNA sequencing using Chromium 10x genomics. b t-distributed stochastic neighbor (t-SNE) embedding analysis for representing different cell clusters identified based on principal component analysis (PCA). Cells are colored on the basis of different cell type clusters formed. c Bar graph represents total cell numbers within each indicated cell type clusters in GFP only (Control) vs NFIC overexpressing (NFIC) group. d Differential gene expression analysis between NFIC overexpressing monocytes vs control identified top canonical pathways and e disease and molecular function terms enriched after differential gene expression within the monocytes cell cluster using IPA. Each bar graph represents the cellular pathway and x-axis represents the −log10(P) values which determine the level of significance and numbers besides each bar shows number of genes altered in within that pathway. f Network map for all significant genes associated within cell survival pathway with three most enriched functional nodes and their interconnections. Red shades indicate upregulation of genes whereas green shades indicate downregulation. A complete list of these genes is given in Supplementary Table 3. The network map was generated using IPA Path Designer tool. Legends show in the text box at the right of the map.
Fig. 4
Fig. 4. NFIC knockdown reduces growth of AML cells.
a Line graphs represent total cell counts at different days post NFIC knockdown (KD). AML cell lines HL60, THP-1, NB4, TF-1, HEL and OCIAML2 were infected with either of the two NFIC shRNAs (sh488 and sh494) or scrambled shRNA (shScr). Forty-eight hours post-infection cells were seeded in 24-well plates designated as Day 0. GFP+ viable (7-AAD) cells were counted every 24 h for up to 5 days of culture. Immunoblots below each graph show KD of NFIC protein compared to control. GAPDH and Histone H1 were used as loading controls for cytosolic (C) and nuclear (N) extracts respectively. Data is represented as mean ± 1 SD (n = 3). b Line graphs showing total GFP+ cell counts of primary AML patient-derived blasts infected with shRNA or control. Forty-eight hours post-infection cell were seeded and GFP+ cell counts were performed every 24 h for four days. KD efficiency of shRNAs was also evaluated through intracellular staining and flow cytometric analysis (Supplementary Fig S4b). Data represented are mean ± 1 SD (n = 3). Statistical significance denoted with *p < 0.05 and **p < 0.01 when analyzed by Dunnett’s multiple comparison test.
Fig. 5
Fig. 5. NFIC knockdown reduces survival of AML cells by inducing apoptosis and cell cycle arrest.
a Cell cycle analysis of NFIC KD AML cell lines. Bar graphs represent percentage of cells in G2/M cell cycle phase. Cell cycle analysis was performed after four days of infection with NFIC shRNAs as compared to scrambled RNA. Data represents mean±1 SD with *p < 0.05 and **p < 0.01 as analyzed by Dunnett’s multiple comparison test. b Bar graph represents percentage of Annexin-V+ cells. AML cell lines were infected with NFIC shRNA (sh488 and sh494) or scrambled shRNA (shScr) and after four days, stained with Annexin-V and 7-AAD and analyzed by flow cytometry. The percentage of Annexin-V+ (early apoptotic) and Annexin-V+/7-AAD+ (late apoptotic) were pooled together to represent the extent of apoptosis in these cells. Data is represented as mean±1 SD with *p < 0.05 and **p < 0.01 as analyzed by Dunnett’s multiple comparisons test. c Bar graph represents percentage of Annexin-V+ cells. Primary AML patient PBMCs were infected with NFIC shRNAs or scrambled control. After four days cells were analyzed by flow cytometry. Bar graphs represent mean±1SD with *p < 0.05 as analyzed by Dunnett’s multiple comparison test, d Western blots representing expression of Apoptosis-inducing factor (AIF) Mol. Wt. 66 KDa. Infection efficiency was >95% in all cases. GAPDH was used for endogenous loading control.
Fig. 6
Fig. 6. NFIC KD induces differential expression (DE) of genes in THP-1 cells.
a Multivariable graph represents a list of pathways enriched after Gene Set Enrichment Analysis (GSEA) of all differentially expressed genes with significance (FDR < 0.05) and log2 fold change >1.5 or <−1.5 in THP-1 cells following NFIC KD (sh494) vs scrambled (shScr). b Table showing DE apoptotic-related genes in THP-1 cells following NFIC knockdown (sh494) vs scrambled (shScr). c GSEA shows that NFIC KD increases expression of genes involved in G2M checkpoints histone acetylation and epigenetic regulation of genes expression with a positive Normalized Enrichment Score (NES). Pathway enrichment analysis showed upregulation of genes downregulated by fusion oncogene NUP98-HOXA9 with a positive NES and downregulation of genes that are targets of MLL with a negative NES. Enriched pathway with nominal p < 0.05 and False Discovery Rate (FDR) < 0.05 was selected for investigation. d Heat map showing DEG in THP-1 cells following NFIC knockdown (sh494) vs scrambled (shScr) enriched for MLL target genes. Data represents n = 3 for each group.
Fig. 7
Fig. 7. NFIC KD reduces growth, survival and clonogenicity of MLL::AF9 pre-LSCs and induces differentiation and apoptosis.
a Expression of Nfic mRNA in pre-LSCs clones isolated from MLL::AF9 transformed mice (n = 5) as compared to their normal counter-part granulo-monocytic myeloid progenitor (GMP) cells (n = 4). Each dot represents an individual mouse. Data was analyzed using Mann-Whitney test. b Line graph represents growth curve of MLL::AF9 (with GFP) transduced pre-LSCs after Nfic knockdown. MLL::AF9 transformed pre-LSCs clones (Clone 1 and 2) form two different mice models were repeat-infected with either Nfic shRNAs (sh539 and sh545) or scrambled (shScr) vectors containing m-Cherry. Cells were seeded 48 h post infection. Total cell counts were performed every 24 h for 4 days. Cells were initially gated on GFP for MLL::AF9 and then on m-Cherry. 7-AAD was used to exclude dead cells. Data are mean ± 1 SD with *p < 0.05 and **p < 0.01, analyzed by Dunnett’s multiple comparison test as compared to scramble control. c Colony formation assay. The bar graph represents number of colonies per 2000 cells seeded. MLL::AF9 transformed cells were infected with Nfic shRNAs or scrambled for 48 h, sorted as GFP+/m-Cherry+ and seeded in six-well plates containing MethoCult for primary, secondary, and tertiary colony. Colonies were counted and phenotyped after seven days and re-seeded for subsequent colony. Data represented are mean±1 SD (n = 4) with *p < 0.05, **p < 0.01 and ***p < 0.001 as analyzed by Tukey’s multiple comparison test. d Bar graph represents Annexin-V+ cells. MLL::AF9 transformed pre-LSCs were infected with Nfic shRNAs or scrambled for 72 h and analyzed for apoptosis assay. 7-AAD was used for necrotic and late-apoptotic cells. Each bar graph shows sum of both Annexin-V+ (early apoptotic) and 7-AAD+/Annexin-V+ (late apoptotic) cell populations. Data represented are mean ± 1 SD (n = 4) with *p < 0.05 and **p < 0.01 as analyzed by Dunnett’s multiple comparison test. e Flow cytometric histogram plots for c-kit, Mac and Gr-1 expression in tertiary colonies of MLL::AF9 transformed pre-LSCs infected with Nfic shRNAs as compared to control (n = 4).

References

    1. Dohner H, Weisdorf DJ, Bloomfield CD. Acute myeloid leukemia. N Engl J Med. 2015;373:1136–52. doi: 10.1056/NEJMra1406184. - DOI - PubMed
    1. Ferrara F, Schiffer CA. Acute myeloid leukaemia in adults. Lancet. 2013;381:484–95. doi: 10.1016/S0140-6736(12)61727-9. - DOI - PubMed
    1. Burnett A, Wetzler M, Lowenberg B. Therapeutic advances in acute myeloid leukemia. J Clin Oncol. 2011;29:487–94. doi: 10.1200/JCO.2010.30.1820. - DOI - PubMed
    1. Grimwade D, Mistry AR, Solomon E, Guidez F. Acute promyelocytic leukemia: a paradigm for differentiation therapy. Cancer Treat Res. 2010;145:219–35. doi: 10.1007/978-0-387-69259-3_13. - DOI - PubMed
    1. Cucchi DGJ, Polak TB, Ossenkoppele GJ, Uyl-De Groot CA, Cloos J, Zweegman S, et al. Two decades of targeted therapies in acute myeloid leukemia. Leukemia. 2021;35:651–60. doi: 10.1038/s41375-021-01164-x. - DOI - PubMed

Publication types

MeSH terms

Substances