. 2022 Dec 27;10(1):241.
doi: 10.1186/s40168-022-01424-7.

Global patterns of diversity and metabolism of microbial communities in deep-sea hydrothermal vent deposits

Affiliations

Global patterns of diversity and metabolism of microbial communities in deep-sea hydrothermal vent deposits

Zhichao Zhou et al. Microbiome. .

Abstract

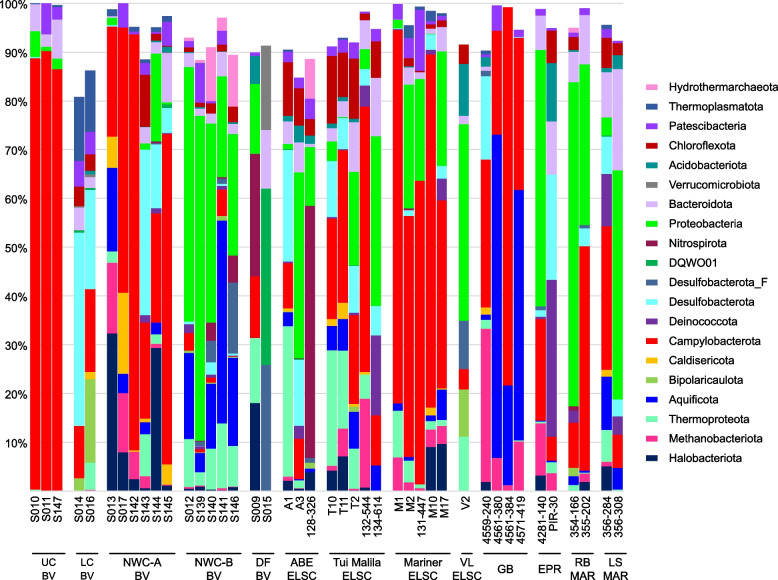
Background: When deep-sea hydrothermal fluids mix with cold oxygenated fluids, minerals precipitate out of solution and form hydrothermal deposits. These actively venting deep-sea hydrothermal deposits support a rich diversity of thermophilic microorganisms which are involved in a range of carbon, sulfur, nitrogen, and hydrogen metabolisms. Global patterns of thermophilic microbial diversity in deep-sea hydrothermal ecosystems have illustrated the strong connectivity between geological processes and microbial colonization, but little is known about the genomic diversity and physiological potential of these novel taxa. Here we explore this genomic diversity in 42 metagenomes from four deep-sea hydrothermal vent fields and a deep-sea volcano collected from 2004 to 2018 and document their potential implications in biogeochemical cycles.

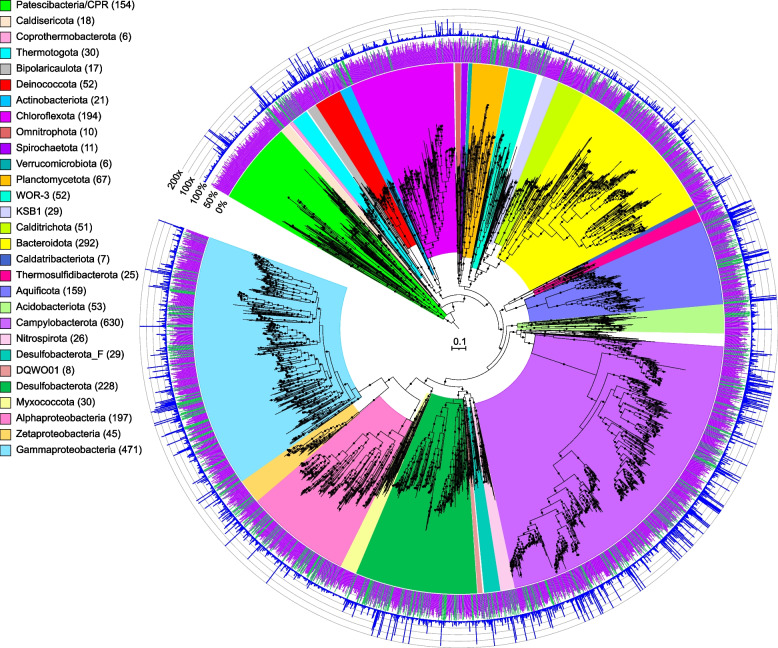
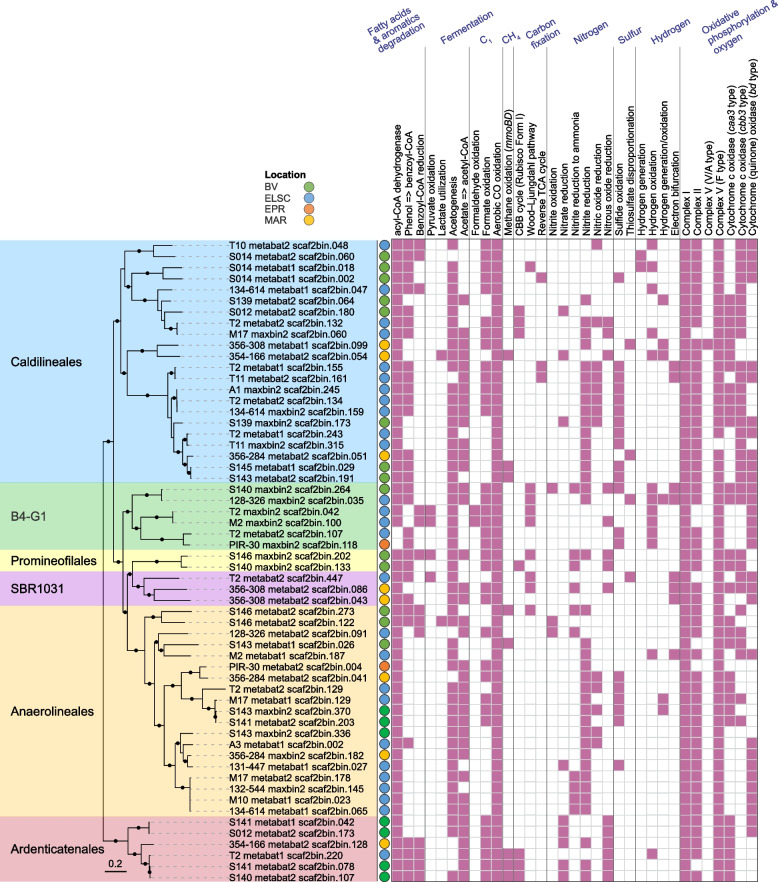
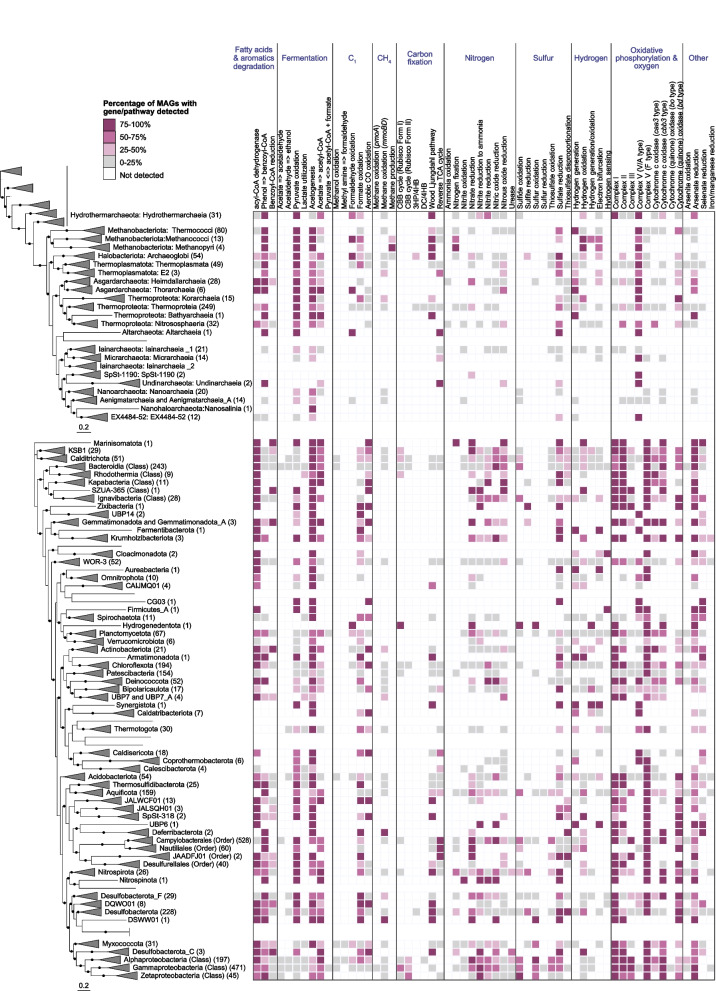
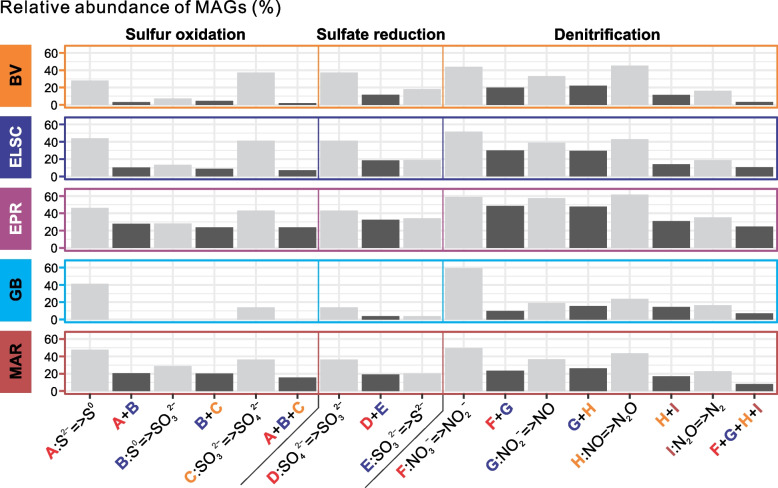
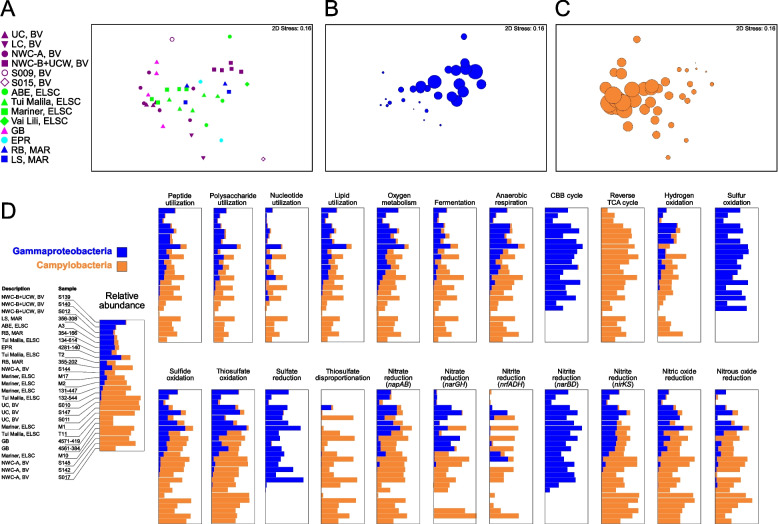
Results: Our dataset represents 3635 metagenome-assembled genomes encompassing 511 novel and recently identified genera from deep-sea hydrothermal settings. Some of the novel bacterial (107) and archaeal genera (30) that were recently reported from the deep-sea Brothers volcano were also detected at the deep-sea hydrothermal vent fields, while 99 bacterial and 54 archaeal genera were endemic to the deep-sea Brothers volcano deposits. We report some of the first examples of medium- (≥ 50% complete, ≤ 10% contaminated) to high-quality (> 90% complete, < 5% contaminated) MAGs from phyla and families never previously identified, or poorly sampled, from deep-sea hydrothermal environments. We greatly expand the novel diversity of Thermoproteia, Patescibacteria (Candidate Phyla Radiation, CPR), and Chloroflexota found at deep-sea hydrothermal vents and identify a small sampling of two potentially novel phyla, designated JALSQH01 and JALWCF01. Metabolic pathway analysis of metagenomes provides insights into the prevalent carbon, nitrogen, sulfur, and hydrogen metabolic processes across all sites and illustrates sulfur and nitrogen metabolic "handoffs" in community interactions. We confirm that Campylobacteria and Gammaproteobacteria occupy similar ecological guilds but their prevalence in a particular site is driven by shifts in the geochemical environment.

Conclusion: Our study of globally distributed hydrothermal vent deposits provides a significant expansion of microbial genomic diversity associated with hydrothermal vent deposits and highlights the metabolic adaptation of taxonomic guilds. Collectively, our results illustrate the importance of comparative biodiversity studies in establishing patterns of shared phylogenetic diversity and physiological ecology, while providing many targets for enrichment and cultivation of novel and endemic taxa. Video Abstract.

Keywords: Archaea; Bacteria; Deep-sea hydrothermal vents; Metagenomics; Thermophiles.


Conflict of interest statement

The authors declare that they have no competing interests.

Figures

Fig. 1
Fig. 1
Maximum-likelihood phylogenomic tree of bacterial metagenome-assembled genomes, constructed using 120 bacterial marker genes in GTDB-Tk. Major taxonomic groups are highlighted, and the number of MAGs in each taxon is shown in parentheses. See Table S2 for details. Bacterial lineages are shown at the phylum classification, except for the Proteobacteria which are split into their component classes. The inner ring displays quality (green: high quality, > 90% completion, < 5% contamination; purple: medium quality, ≥ 50% completion, ≤ 10% contamination), while the outer ring shows normalized read coverage up to 200x. The scale bar indicates 0.1 amino acid substitutions per site, and filled circles are shown for SH-like support values ≥ 80%. The tree was artificially rooted with the Patescibacteria using iTOL. The Newick format tree used to generate this figure is available in Data S4, and the formatted tree is available online at https://itol.embl.de/shared/alrlab
Fig. 2
Fig. 2
Maximum-likelihood phylogenomic reconstruction of deep-sea hydrothermal vent archaeal metagenome-assembled genomes generated in GTDB-Tk. The tree was generated with 122 archaeal marker genes. Taxa are shown at the phylum level, except for the Thermoproteota, Asgardarchaeota, Halobacteriota, and Methanobacteriota, shown at the class level. The number of MAGs in each highlighted taxon is shown in parentheses. See Table S2 for details. Quality is shown on the inner ring (green: high quality, purple: medium quality, with one manually curated Nanoarchaeota MAG below the 50% completion threshold also displayed as medium quality), while the outer ring displays normalized read coverage up to 200x. SH-like support values ≥ 80% are indicated with filled circles, and the scale bar represents 0.1 amino acid substitutions per site. The tree was artificially rooted with the Iainarchaeota, Micrarchaeota, SpSt-1190, Undinarchaeota, Nanohaloarchaeota, EX4484-52, Aenigmarchaeota, Aenigmarchaeota_A, and Nanoarchaeota using iTOL. The tree used to create this figure is available in Newick format (Data S5), and the formatted tree is publicly available on iTOL at https://itol.embl.de/shared/alrlab
Fig. 3
Fig. 3
Relative abundance of MAG phyla, based on normalized read coverage. The phyla shown comprise ≥ 10% of the MAG relative abundance in at least one metagenomic assembly. Read coverage was normalized to 100 M reads per sample, and coverage values for MAGs were summed and expressed as a percent. UC, Upper Cone; LC, Lower Cone, NWC-A, Northwest Caldera Wall A; NWC-B, Northwest Caldera Wall B and Upper Caldera Wall; DF, diffuse flow; VL, Vai Lili; RB, Rainbow; LS, Lucky Strike
Fig. 4
Fig. 4
Non-metric multidimensional scaling (NMDS) plots showing taxonomic diversity of MAGs. Plots depict A all samples in this study and B a subset of the data, limited to locations with three or more samples. Plots were generated using Bray–Curtis matrices of the relative abundance of GTDB taxa, based on normalized read coverage of medium- and high-quality MAGs (Table S4; set to 100 M reads and expressed as a percentage of MAG read coverage per sample). Points that are closer together in the plots represent a higher degree of similarity
Fig. 5
Fig. 5
Phylogenomic placement and relative abundance of Patescibacteria MAGs, displayed at the class rank. A Blue clades in the maximum-likelihood phylogenomic tree contain MAGs from this study, with the number of MAGs shown in parentheses. The scale bar shows 0.5 substitutions per amino acid, and filled circles indicate SH-like support (≥ 80%). B Relative abundance of Patescibacteria MAGs was calculated using normalized read coverage for MAGs in each assembly (set to 100 M reads and expressed as a percentage of MAG read coverage per sample)
Fig. 6
Fig. 6
Phylogenetic tree of 58 ≥ 80%-completeness Chloroflexota MAGs with predicted functional capabilities. Nodes with ultrafast bootstrap support values ≥ 90% are shown with filled circles, and the scale bar shows 0.2 substitutions per site. One genome from the GTDB r202 database (GTDB accession GB_GCA_007123655.1) was used to re-root the tree. Hydrothermal vent fields: Brothers volcano (green), Eastern Lau Spreading Center (blue), East Pacific Rise (orange), Mid Atlantic Ridge (yellow)
Fig. 7
Fig. 7
Core metabolic gene presence across phylogenetic clusters in deep-sea hydrothermal vent deposits. The number of MAGs in each clade is shown in parentheses, and MAGs belonging to unclassified lineages or falling outside their corresponding phylogenetic cluster due to unstable tree topology are shown without names. In instances where a phylum was not recovered as a monophyletic lineage within the tree (e.g., Iainarchaeia), MAG count and gene distribution for the entire phylum is only shown on one of the branches. Unless otherwise indicated, archaeal clades are shown at the class level, while bacterial clades are shown at the phylum level. Nodes with ultrafast bootstrap support ≥ 90% are shown with filled circles, and scale bars indicating 0.2 amino acid substitutions per site are provided for both archaeal and bacterial trees. Detailed metabolic gene presence information can be found in Table S9
Fig. 8
Fig. 8
Heatmap displaying the metabolic potential for each metagenome. Within each metagenomic dataset, functional abundance values were calculated as described in the methods. Functional abundances were then log-transformed, with abundance values equal to zero replaced by 10−3 to avoid negative infinite values
Fig. 9
Fig. 9
Bar plots showing the sequential steps of sulfur oxidation, denitrification, and sulfate reduction. Bar height indicates the percent relative abundance of MAGs in each metagenome with genes for a particular function(s), averaged across hydrothermal vent sites
Fig. 10
Fig. 10
Comparative taxonomic and functional gene abundance of the Campylobacteria and Gammaproteobacteria. NMDS plots were generated using a Bray–Curtis matrix of relative MAG abundance, based on GTDB-assigned taxonomy at the class level. Plots are shown for A all sample sites, and for all sample sites with bubbles proportional to the relative abundance of B Gammaproteobacteria and C Campylobacteria. D Comparative functional distribution is also shown for the Gammaproteobacteria and Campylobacteria for the 26 samples that had a summed relative abundance of both Gammaproteobacteria and Campylobacteria of ≥ 30%. The 22 functions depicted were selected as the Gammaproteobacteria and Campylobacteria accounted for an average of ≥ 20% of the total abundance for each function across the metagenomes

References

    1. Nakagawa S, Takai K, Inagaki F, Chiba H, Ishibashi JI, Kataoka S, et al. Variability in microbial community and venting chemistry in a sediment-hosted backarc hydrothermal system: impacts of subseafloor phase-separation. FEMS Microbiol Ecol. 2005;54:141–155. doi: 10.1016/j.femsec.2005.03.007. - DOI - PubMed
    1. Nunoura T, Takai K. Comparison of microbial communities associated with phase-separation- induced hydrothermal fluids at the Yonaguni Knoll IV hydrothermal field, the Southern Okinawa Trough. FEMS Microbiol Ecol. 2009;67:351–370. doi: 10.1111/j.1574-6941.2008.00636.x. - DOI - PubMed
    1. Flores GE, Campbell JH, Kirshtein JD, Meneghin J, Podar M, Steinberg JI, et al. Microbial community structure of hydrothermal deposits from geochemically different vent fields along the Mid-Atlantic Ridge. Environ Microbiol. 2011;13:2158–2171. doi: 10.1111/j.1462-2920.2011.02463.x. - DOI - PubMed
    1. Flores GE, Shakya M, Meneghin J, Yang ZK, Seewald JS, Geoff Wheat C, et al. Inter-field variability in the microbial communities of hydrothermal vent deposits from a back-arc basin. Geobiology. 2012;10:333–346. doi: 10.1111/j.1472-4669.2012.00325.x. - DOI - PubMed
    1. Dahle H, Økland I, Thorseth IH, Pederesen RB, Steen IH. Energy landscapes shape microbial communities in hydrothermal systems on the Arctic Mid-Ocean Ridge. ISME J. 2015;9:1593–1606. doi: 10.1038/ismej.2014.247. - DOI - PMC - PubMed

Publication types

LinkOut - more resources