

Development of Multiplexed Bead-Based Immunoassays for Profiling Soluble Cytokines and CD163 Using Mass Cytometry
- PMID: 36573076
- PMCID: PMC9783081
- DOI: 10.1021/acsmeasuresciau.2c00038
Development of Multiplexed Bead-Based Immunoassays for Profiling Soluble Cytokines and CD163 Using Mass Cytometry
Abstract
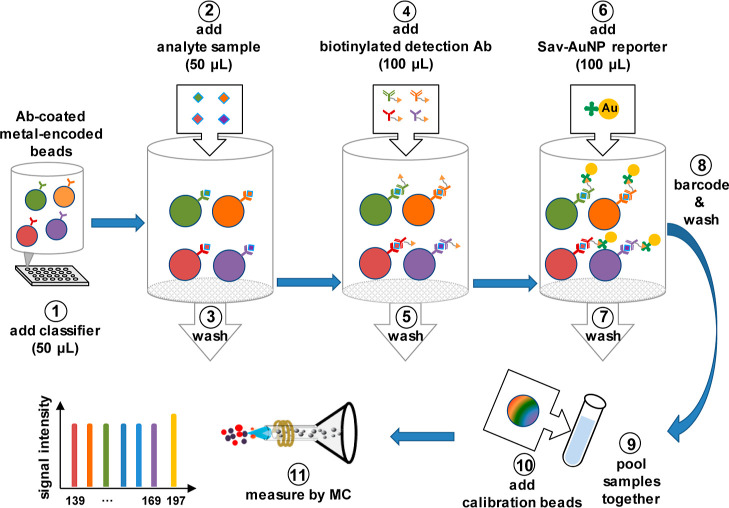
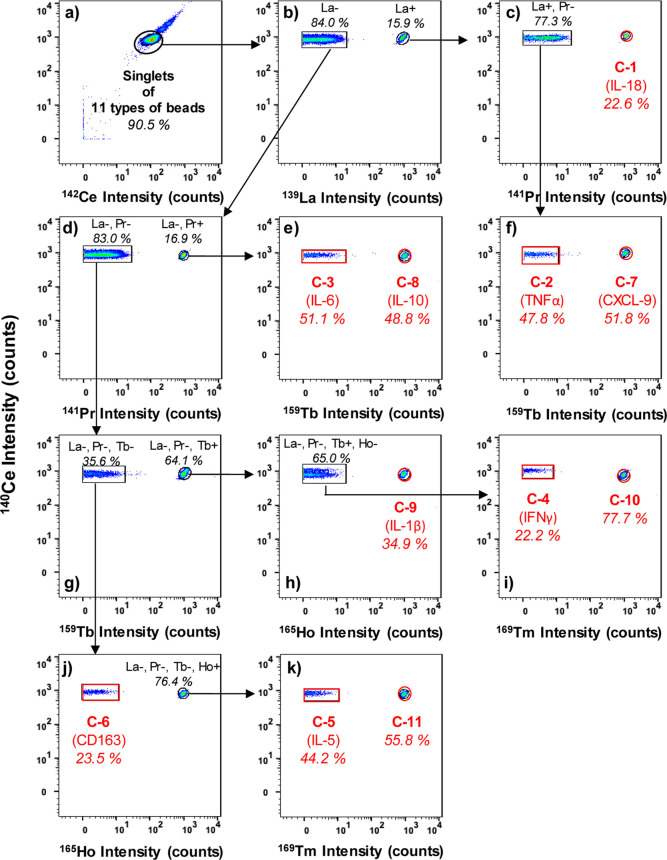
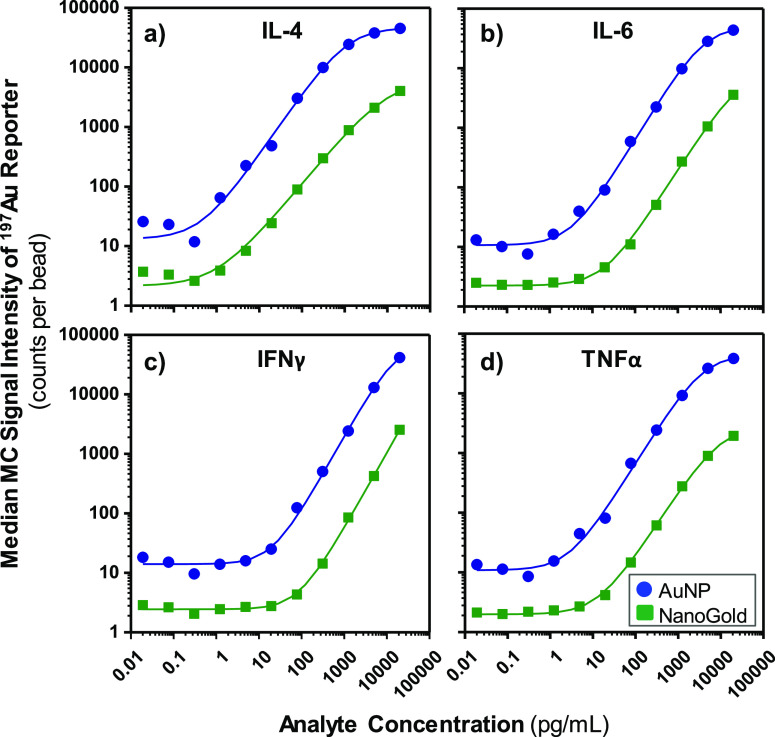
Bead-based immunoassays are multiparametric analysis allowing for the simultaneous quantification of a large number of biomarkers within a single sample. Mass cytometry is an emerging cytometric technique that offers a high multiplexing capacity in a high-throughput setting but has not yet been applied to bead-based assays. In this study, we developed a multiplex bead-based immunoassay of cytokines and CD163 designed for mass cytometry (MC). A set of 11 types of lanthanide-encoded microbeads were synthesized by two-stage dispersion polymerization as classifier candidates for the assay. These beads were then decorated with different Abs on the surface to capture the target cytokines in solution. Gold nanoparticles were employed as reporters to identify the binding of target cytokines on the classifier surface. As a proof-of-concept study, we first developed four-plex and nine-plex assays of mixtures of cytokines in standard solutions. The MC signal intensities of these immunoassays were responsive to the concentration differences in the standard solutions with high detection sensitivities at low analyte concentrations. Finally, we examined a sample of peripheral blood mononuclear cells (PBMCs) with the nine-plex assay, comparing an unstimulated sample with a sample stimulated to promote cytokine secretion.
© 2022 The Authors. Published by American Chemical Society.
Conflict of interest statement
The authors declare the following competing financial interest(s): Dr. Allo was an employee of Fluidigm Canada (now Standard BioTools Canada). He has since left the company.
Figures


Similar articles
-
Multiplex Cytokine Profiling of Stimulated Mouse Splenocytes Using a Cytometric Bead-based Immunoassay Platform.J Vis Exp. 2017 Nov 9;(129):56440. doi: 10.3791/56440. J Vis Exp. 2017. PMID: 29155764 Free PMC article.
-
A Silica Coating Approach to Enhance Bioconjugation on Metal-Encoded Polystyrene Microbeads for Bead-Based Assays in Mass Cytometry.Langmuir. 2021 Jul 13;37(27):8240-8252. doi: 10.1021/acs.langmuir.1c00954. Epub 2021 Jun 25. Langmuir. 2021. PMID: 34170710
-
How to: Measuring blood cytokines in biological psychiatry using commercially available multiplex immunoassays.Psychoneuroendocrinology. 2017 Jan;75:72-82. doi: 10.1016/j.psyneuen.2016.10.010. Epub 2016 Oct 20. Psychoneuroendocrinology. 2017. PMID: 27810706
-
Bead-based microfluidic immunoassays: the next generation.Biosens Bioelectron. 2007 Feb 15;22(7):1197-204. doi: 10.1016/j.bios.2006.06.005. Epub 2006 Jul 20. Biosens Bioelectron. 2007. PMID: 16857357 Review.
-
Cross-reactivity in antibody microarrays and multiplexed sandwich assays: shedding light on the dark side of multiplexing.Curr Opin Chem Biol. 2014 Feb;18:29-37. doi: 10.1016/j.cbpa.2013.11.012. Epub 2013 Dec 25. Curr Opin Chem Biol. 2014. PMID: 24534750 Review.
Cited by
-
Polymer-Based Mass Cytometry Reagents: Synthesis and Biomedical Applications.Molecules. 2025 Jul 19;30(14):3034. doi: 10.3390/molecules30143034. Molecules. 2025. PMID: 40733298 Free PMC article. Review.
-
High-throughput multiplexed serology via the mass-spectrometric analysis of isotopically barcoded beads.Nat Biomed Eng. 2025 Jul;9(7):1117-1128. doi: 10.1038/s41551-025-01349-0. Epub 2025 Feb 12. Nat Biomed Eng. 2025. PMID: 39939547 Free PMC article.
-
Persistent human babesiosis with low-grade parasitemia, challenges for clinical diagnosis and management.Heliyon. 2024 Nov 3;10(22):e39960. doi: 10.1016/j.heliyon.2024.e39960. eCollection 2024 Nov 30. Heliyon. 2024. PMID: 39634383 Free PMC article. Review.
References
-
- Chatenoud L.; Ferran C.; Bach J.-F.. The Anti-CD3-Induced Syndrome: A Consequence of Massive In Vivo Cell Activation. In Superantigens; Fleischer B., Sjögren H. O., Eds.; Current Topics in Microbiology and Immunology; Springer: Berlin, Heidelberg, 1991; pp 121–134. - PubMed
-
- Finco D.; Grimaldi C.; Fort M.; Walker M.; Kiessling A.; Wolf B.; Salcedo T.; Faggioni R.; Schneider A.; Ibraghimov A.; Scesney S.; Serna D.; Prell R.; Stebbings R.; Narayanan P. K. Cytokine Release Assays: Current Practices and Future Directions. Cytokine 2014, 66, 143–155. 10.1016/j.cyto.2013.12.009. - DOI - PubMed
-
- Vessillier S.; Eastwood D.; Fox B.; Sathish J.; Sethu S.; Dougall T.; Thorpe S. J.; Thorpe R.; Stebbings R. Cytokine release assays for the prediction of therapeutic mAb safety in first-in man trials - Whole blood cytokine release assays are poorly predictive for TGN1412 cytokine storm. J. Immunol. Methods 2015, 424, 43–52. 10.1016/j.jim.2015.04.020. - DOI - PMC - PubMed
LinkOut - more resources
Full Text Sources
Research Materials