. 2023 May 9;33(10):6207-6227.
doi: 10.1093/cercor/bhac496.

Auditory cortical connectivity in humans

Affiliations

Auditory cortical connectivity in humans

Edmund T Rolls et al. Cereb Cortex. .

Abstract

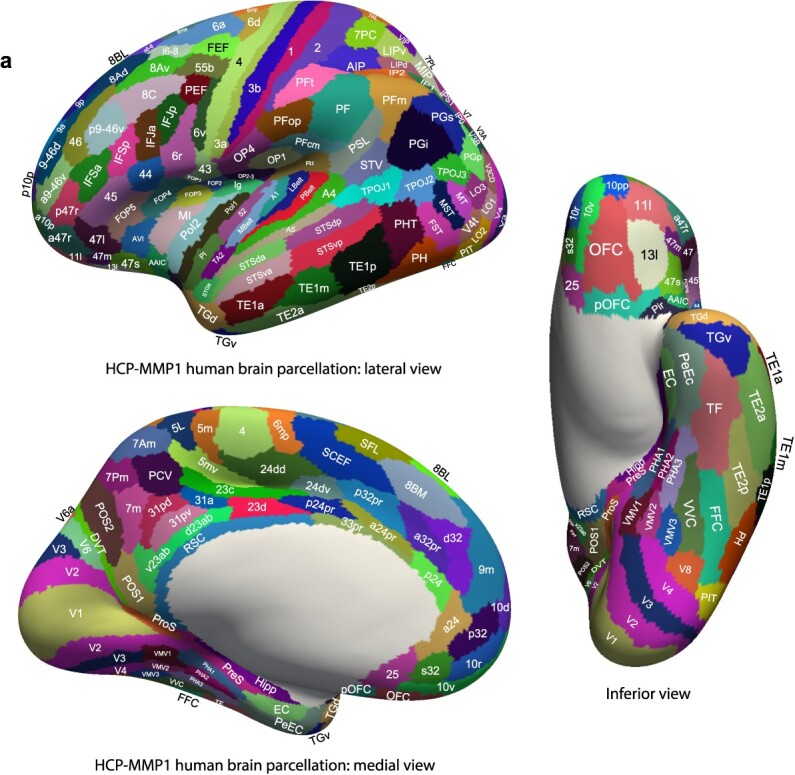
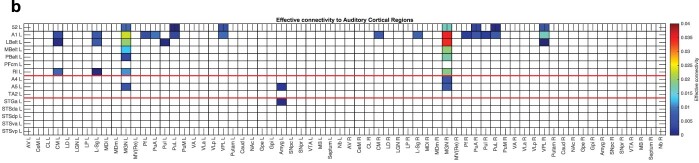
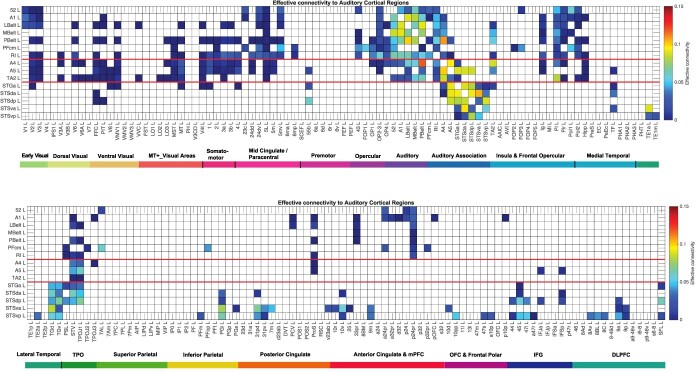
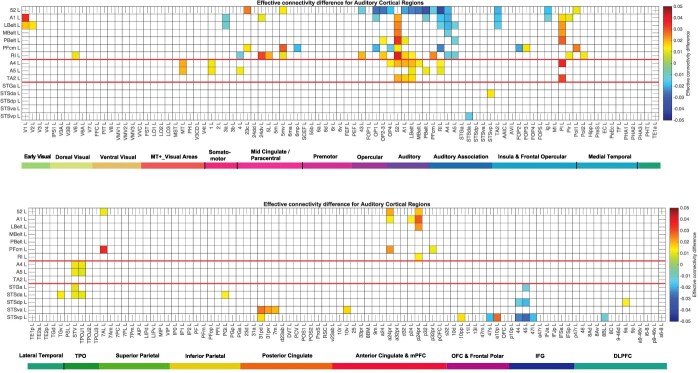
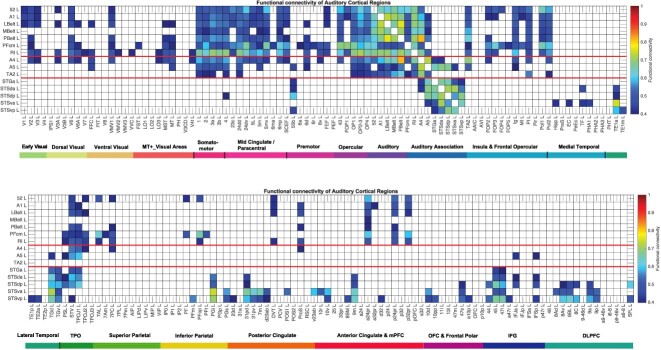
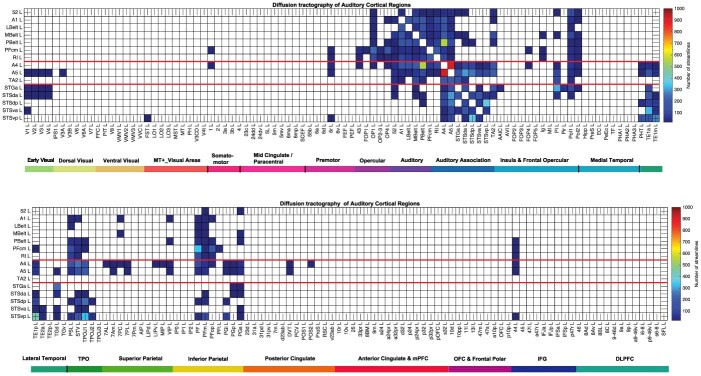
To understand auditory cortical processing, the effective connectivity between 15 auditory cortical regions and 360 cortical regions was measured in 171 Human Connectome Project participants, and complemented with functional connectivity and diffusion tractography. 1. A hierarchy of auditory cortical processing was identified from Core regions (including A1) to Belt regions LBelt, MBelt, and 52; then to PBelt; and then to HCP A4. 2. A4 has connectivity to anterior temporal lobe TA2, and to HCP A5, which connects to dorsal-bank superior temporal sulcus (STS) regions STGa, STSda, and STSdp. These STS regions also receive visual inputs about moving faces and objects, which are combined with auditory information to help implement multimodal object identification, such as who is speaking, and what is being said. Consistent with this being a "what" ventral auditory stream, these STS regions then have effective connectivity to TPOJ1, STV, PSL, TGv, TGd, and PGi, which are language-related semantic regions connecting to Broca's area, especially BA45. 3. A4 and A5 also have effective connectivity to MT and MST, which connect to superior parietal regions forming a dorsal auditory "where" stream involved in actions in space. Connections of PBelt, A4, and A5 with BA44 may form a language-related dorsal stream.

Keywords: auditory cortex; diffusion tractography; effective connectivity; functional connectivity; language; ventral and dorsal auditory streams.


Conflict of interest statement

The authors have no competing interests to declare.

Figures

Fig. 1a
Fig. 1a
Anatomical regions of the human visual and other cortical regions. Regions are shown as defined in the HCP-MMP atlas (Glasser et al. 2016a), and in its extended version HCPex (Huang et al. 2022). The regions are shown on images of the human brain with the sulci expanded sufficiently to allow the regions within the sulci to be shown. Supplementary Figs. S1-S7 Shows the brain without the sulci opened to help show which regions/areas are normally visible. Abbreviations are provided in Supplementary Table S1.
Fig. 1b
Fig. 1b
Subcortical connectivity of auditory cortical regions. The effective connectivity of auditory cortex regions in the left hemisphere. The connectivity is read from column to row. L = left; R = right; CM = central median nucleus of the thalamus; L-sg = Limitans Suprageniculate of the thalamus; MGN = medial geniculate nucleus; pf = Parafascicular nucleus of the thalamus; PuA = Pulvinar anterior; PuI = Pulvinar inferior; PuL = Pulvinar lateral; VPL = ventrolateral nucleus of the thalamus; Amyg = amygdala. The abbreviations for the cortical regions (the rows) are in Supplementary Table S1, and the abbreviations for the subcortical regions are in Supplementary Table S2. The regions above the upper red line are in the HCP-MMP “early auditory” division; between the two red lines are in the “auditory association” division; and below the lower red line are for the cortex in and related to the superior temporal sulcus (STS). This analysis was performed using the subcortical regions defined in the HCPex atlas (Huang et al. 2022).
Fig. 2
Fig. 2
Effective connectivity TO auditory cortical regions (the rows) FROM 180 cortical areas (the columns) in the left hemisphere. The effective connectivity is read from column to row. Effective connectivities of 0 are shown as blank. All effective connectivity maps are scaled to show 0.15 as the maximum, as this is the highest effective connectivity found between this set of brain regions. The effective connectivity color scale has been set to have a maximum of 0.15 as that is the range for the auditory regions, with the maximum value of 0.2 set by the connectivity between V1L and V2L. The regions above the upper red line are in the HCP-MMP “early auditory” division; between the two red lines are in the “auditory association” division; and below the lower red line are for the cortex in and related to the superior temporal sulcus (STS). The effective connectivity for the first set of cortical regions is shown in the top panel; and for the second set of regions in the lower panel. Abbreviations: See Supplementary Table S1. The colored labeled bars show the cortical divisions in the HCP-MMP atlas (Glasser et al. 2016a). The order of the cortical regions is that in Huang, Rolls et al (2022).
Fig. 3
Fig. 3
Effective connectivity FROM the auditory cortical regions TO 180 cortical areas in the left hemisphere. The effective connectivity is read from column to row. Effective connectivities of 0 are shown as blank. Abbreviations: See Supplementary Table S1. The groups of auditory cortex regions are separated by red lines. Conventions as in Fig. 2.
Fig. 4
Fig. 4
Difference of the effective connectivity for auditory cortical regions with other cortical regions. For a given link, if the effective connectivity difference is positive, the connectivity is stronger in the direction from column to row. For a given link, if the effective connectivity difference is negative, the connectivity is weaker in the direction from column to row. This is calculated from 171 participants in the HCP imaged at 7T. the threshold value for any effective connectivity difference to be shown is 0.01. The color scale shows effective connectivity differences in the range − 0.05 to +0.05. The abbreviations for the brain regions are shown in Supplementary Table S1, and the brain regions are shown in Fig. 1 and Supplementary Fig. S1. The effective connectivity difference for the first set of cortical regions is shown in the top panel; and for the second set of regions in the lower panel. Conventions as in Fig. 2.
Fig. 5
Fig. 5
Functional connectivity between auditory cortical regions and 180 other cortical regions in the left hemisphere. Functional connectivities less than 0.4 are shown as blank. The upper figure shows the functional connectivity of the auditory cortical regions with the first half of the cortical regions; the lower figure shows the functional connectivity with the second half of the cortical regions. The color scale shows the value of the functional connectivity from the threshold used here of 0.4 to a maximum possible value of 1.0. Abbreviations: See Supplementary Table S1. Conventions as in Fig. 2.
Fig. 6
Fig. 6
Connections between the auditory cortical regions and 180 other cortical regions in the left hemisphere as shown by diffusion tractography using the same layout as in Figs. 2 and 5. The number of streamlines shown was thresholded at 10 and values less than this are shown as blank. The color bar maximum was set to 1000 streamlines to show some detail for the lower values, and the maximum number of streamlines across the brain regions shown was 1100 (excluding a few outliers). Abbreviations: See Supplementary Table S1. Conventions as in Fig. 2.
Fig. 7a
Fig. 7a
Effective connectivity of human auditory cortical regions shown schematically. The widths of the lines and the size of the arrowheads indicate the magnitude and direction of the effective connectivity. The red arrows show the main auditory HCP-MMP division connectivity (regions 52 to TA2), and the green arrows further connectivity (involving STS regions). A simplified schematic organization is that region A1 > LBelt, MBelt and 52 > PBelt > A4 > A5 > STGa, STSda, STSdp > TPOJ1, STV, PGi (Here > indicates has effective connectivity to, though some connectivity may cross levels of the hierarchy.) somatosensory cortical regions have connectivity with A1, RI, TA2, etc. MT has connectivity to A5. TPOJ1, STV, PSL, STSdp and STSda are involved in language as analyzed elsewhere (Rolls et al. 2022e). Connections between early cortical auditory regions and area 44 in what may be a dorsal language related auditory stream are described in the text. Lbelt, Pbelt, A4 and A5 have effective connectivity with MT/MST regions as indicated, and this may be part of a dorsal “where” stream leading to intraparietal and area 7 regions (see text).
Fig. 7b
Fig. 7b
Effective connectivity of the auditory cortical regions with other cortical regions. The widths of the lines and the size of the arrowheads indicate the magnitude and direction of the effective connectivity. The red arrows show the main auditory HCP-MMP division connectivity (regions 52 to TA2), and the green arrows further connectivity (involving STS regions). Conventions as in Fig. 7a.

References

    1. Ahveninen J, Huang S, Nummenmaa A, Belliveau JW, Hung AY, Jaaskelainen IP, Rauschecker JP, Rossi S, Tiitinen H, Raij T. Evidence for distinct human auditory cortex regions for sound location versus identity processing. Nat Commun. 2013:4:2585. - PMC - PubMed
    1. Amunts K, Zilles K. Architecture and organizational principles of Broca's region. Trends Cogn Sci. 2012:16:418–426. - PubMed
    1. Amunts K, Lenzen M, Friederici AD, Schleicher A, Morosan P, Palomero-Gallagher N, Zilles K. Broca's region: novel organizational principles and multiple receptor mapping. PLoS Biol. 2010:8:9. - PMC - PubMed
    1. Archakov D, DeWitt I, Kusmierek P, Ortiz-Rios M, Cameron D, Cui D, Morin EL, VanMeter JW, Sams M, Jaaskelainen IP et al. Auditory representation of learned sound sequences in motor regions of the macaque brain. Proc Natl Acad Sci U S A. 2020:117:15242–15252. - PMC - PubMed
    1. Bajaj S, Adhikari BM, Friston KJ, Dhamala M. Bridging the gap: dynamic causal Modeling and Granger causality analysis of resting state functional magnetic resonance imaging. Brain Connect. 2016:6:652–661. - PubMed

Publication types