. 2023 Feb;113(4):749-771.
doi: 10.1111/tpj.16080. Epub 2023 Jan 18.

Unraveling the genetics underlying micronutrient signatures of diversity panel present in brown rice through genome-ionome linkages

Affiliations

Unraveling the genetics underlying micronutrient signatures of diversity panel present in brown rice through genome-ionome linkages

Erstelle A Pasion et al. Plant J. 2023 Feb.

Abstract

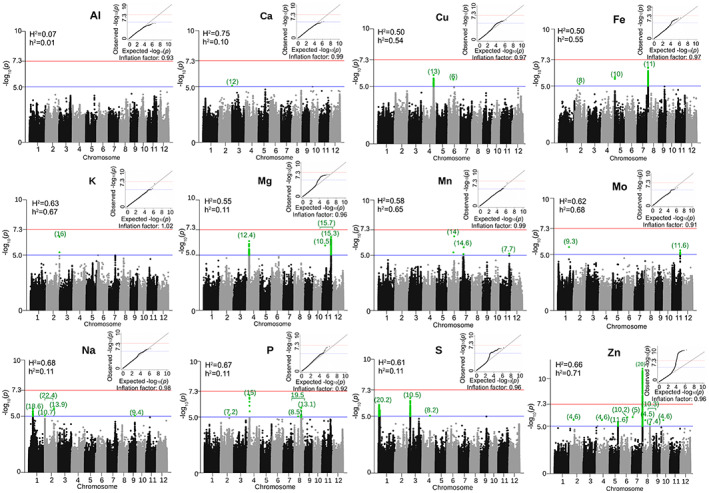
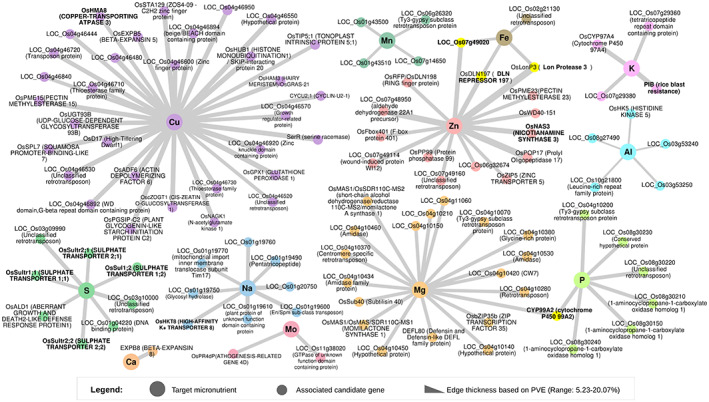
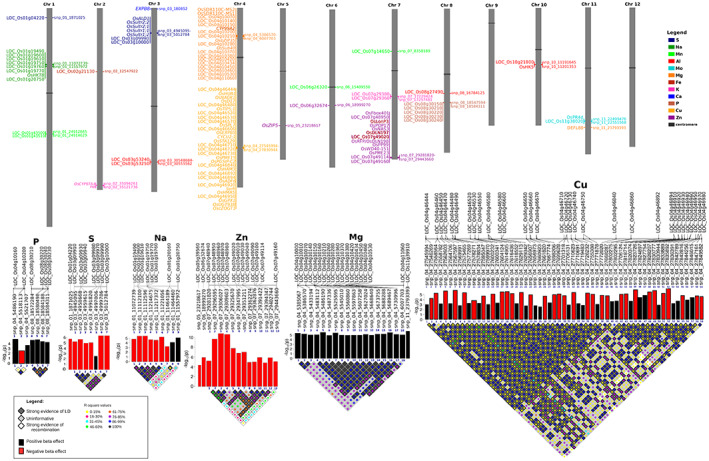
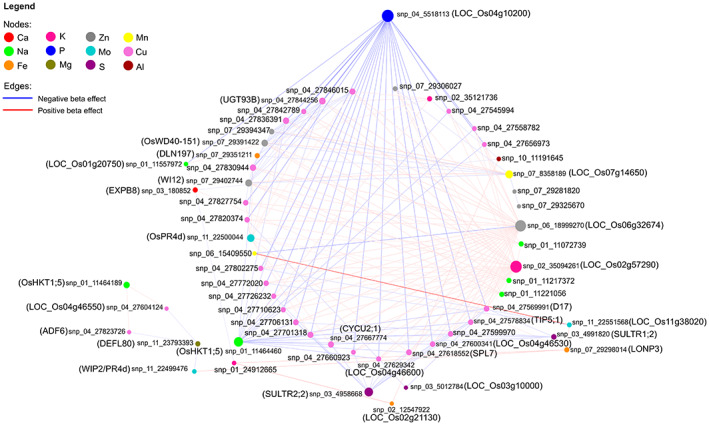
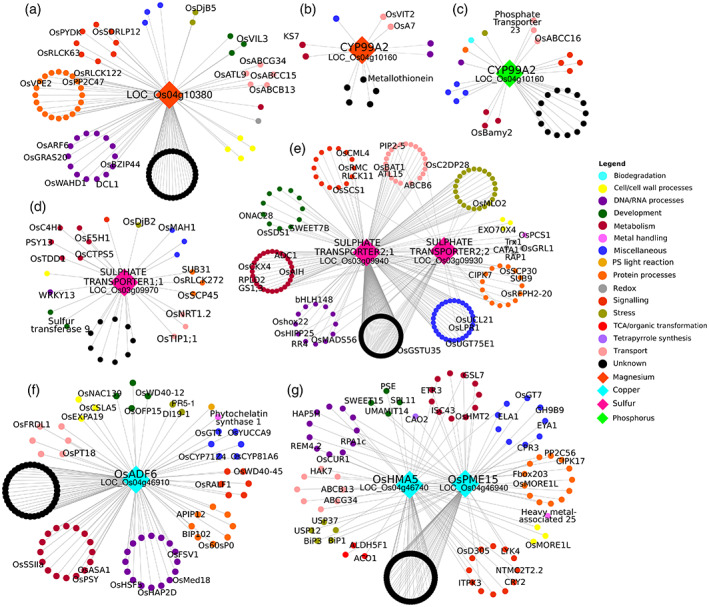
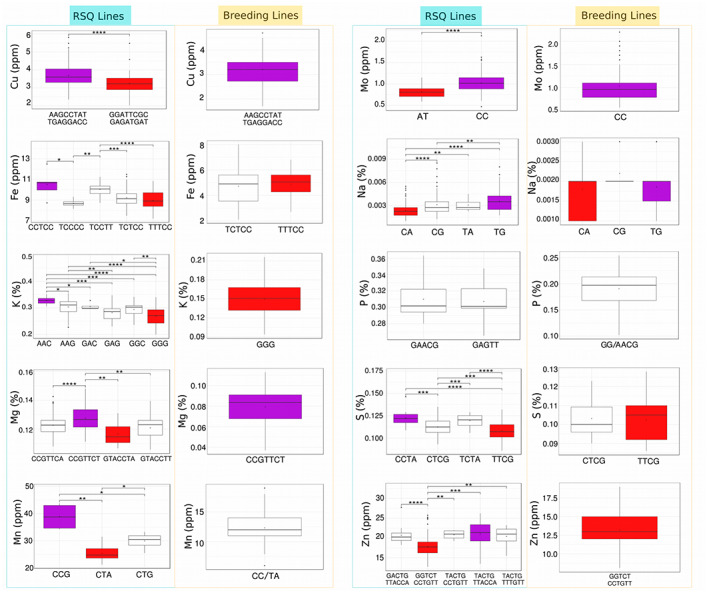
Rice (Oryza sativa) is an important staple crop to address the Hidden Hunger problem not only in Asia but also in Africa where rice is fast becoming an important source of calories. The brown rice (whole grain with bran) is known to be more nutritious due to elevated mineral composition. The genetics underlying brown rice ionome (sum total of such mineral composition) remains largely unexplored. Hence, we conducted a comprehensive study to dissect the genetic architecture of the brown rice ionome. We used genome-wide association studies, gene set analysis, and targeted association analysis for 12 micronutrients in the brown rice grains. A diverse panel of 300 resequenced indica accessions, with more than 1.02 million single nucleotide polymorphisms, was used. We identified 109 candidate genes with 5-20% phenotypic variation explained for the 12 micronutrients and identified epistatic interactions with multiple micronutrients. Pooling all candidate genes per micronutrient exhibited phenotypic variation explained values ranging from 11% to almost 40%. The key donor lines with larger concentrations for most of the micronutrients possessed superior alleles, which were absent in the breeding lines. Through gene regulatory networks we identified enriched functional pathways for central regulators that were detected as key candidate genes through genome-wide association studies. This study provided important insights on the ionome variations in rice, on the genetic basis of the genome-ionome relationships and on the molecular mechanisms underlying micronutrient signatures.

Keywords: GWAS; biofortification; epigenetics; gene regulatory network; micronutrients; systems-genetics.


Conflict of interest statement

We declare no conflict of interest regarding this manuscript.

Figures

Figure 1
Figure 1
Mineral contents and grain quality traits of a diverse collection panel of Oryza sativa subsp. indica. Frequency distribution and principal components analysis for the 12 micronutrients of resequenced indica accessions (RSQ, blue color) and four IRRI breeding lines (yellow color). Also shown are the frequency distribution of five grain quality traits of the RSQ accessions.
Figure 2
Figure 2
Genome‐wide associations of 12 micronutrients from a diverse panel of Oryza sativa subsp. indica RSQ accessions. These Manhattan plots reflect the results of genome‐wide association studies for each of the 12 micronutrients from RSQ panel showing significant single nucleotide polymorphism (SNPs) passing the Bonferroni cutoff (red line) or the suggestive blue line (P < 0.00001). Green numbers on top of each peak are the approximate percentage variation explained by the significant SNPs. Also shown in each Manhattan figure are the broad‐sense (H 2) and narrow‐sense (h 2) heritability values, as well as the quantile‐quantile (QQ) plots for each mineral.
Figure 3
Figure 3
Association network summary of candidate genes linked with the 12 micronutrients of a diverse panel of Oryza sativa subsp. indica RSQ accessions. Central nodes represent the micronutrients of interest and the smaller nodes are the associated candidate genes, while the edge thickness (gray line) represents the percentage variation explained value (PVE) of the candidate gene (range: 5.2–20.1%). These candidate genes were determined through targeted association analysis after genome‐wide association studies and gene set analyses, with their top non‐redundant single nucleotide polymorphisms filtered based on Bonferroni cutoff and beta effect values (β > 2.0 or β < −2.0). Further filtering was performed based on the PVE range of candidate genes per mineral with the following thresholds: PVE >8% was used for Fe and Mn, >5% for Al, and >10% for Cu, S, Na, Mg, P, Zn, Ca, and K.
Figure 4
Figure 4
Chromosomal positions of the candidate genes linked with the 12 micronutrients of a diverse panel of Oryza sativa subsp. indica RSQ accessions. Top candidate genes per mineral are mapped to corresponding chromosome positions. In addition, the linkage maps of tag single nucleotide polymorphisms (SNPs) from the candidate genes per mineral based on 95% confidence intervals on D′ (background color of diamond pattern represents LD, while colored circles inside each diamond pattern represent r 2 values for each SNP pair). The corresponding –log10 P values and beta effect of the SNPs are also shown (bar width represents absolute beta effects: thicker bar = higher absolute beta effect). LD, linkage disequilibrium.
Figure 5
Figure 5
Epistatic interactions of the top non‐redundant SNPs from the candidate genes for various micronutrients of a diverse panel of Oryza sativa subsp. indica RSQ accessions. These SNPs from the candidate genes for different micronutrients specified in parentheses showed significant pairwise interactions P < 0.001 with at least two other SNPs and were also epistatically linked with other micronutrients color based on legend. Edge colors: red for positive beta effect, and blue for negative beta effect; node size signifies number of interactors. SNP, single nucleotide polymorphism.
Figure 6
Figure 6
Differentially expressed candidate genes for various micronutrients of contrasting Oryza sativa subsp. indica RSQ lines along with their coexpressed genes. Candidate genes for Mg (a, b), P (c), S (d, e), and Cu (f, g) were found to be differentially expressed among RSQ lines with contrasting levels of corresponding micronutrients based on transcriptome data of developing seeds (16 days after fertilization). First‐neighbor coexpressed genes for each candidate differentially expressed gene are shown as connected smaller nodes and grouped classified based on corresponding gene ontologies.
Figure 7
Figure 7
Functional haplotypes formed from common top non‐redundant single nucleotide polymorphisms of candidate genes per micronutrient mined in the RSQ panel and IRRI breeding lines showing varying levels of micronutrients. Alleles of the top candidate genes per micronutrient were mined and compared for the RSQ and breeding lines. Superior and inferior alleles per mineral comparing the two sets of lines are colored in purple and red, respectively. Statistical significance of differences is indicated by asterisks: *P < 0.05; **P < 0.01; ***P < 0.001; ****P < 0.0001.

Similar articles

Cited by

References

    1. Aung, M.S. , Masuda, H. , Nozoye, T. , Kobayashi, T. , Jeon, J.‐S. , An, G. et al. (2019) Nicotianamine synthesis by OsNAS3 is important for mitigating iron excess stress in rice. Frontiers in Plant Science, 10, 660. Available from: 10.3389/fpls.2019.00660 - DOI - PMC - PubMed
    1. Barrett, J.C. , Fry, B. , Maller, J. & Daly, M.J. (2005) Haploview: analysis and visualization of LD and haplotype maps. Bioinformatics, 21, 263–265. - PubMed
    1. Benjamini, Y. & Hochberg, Y. (1995) Controlling the false discovery rate: a practical and powerful approach to multiple testing. Journal of the Royal Statistical Society, 57(1), 289–300 https://www.jstor.org/stable/2346101/
    1. Bollinedi, H. , Yadav, A.K. , Vinod, K.K. , Gopala, K.S. , Bhowmick, P.K. , Nagarajan, M. et al. (2020) Genome‐wide association study reveals novel marker‐trait associations (MTAs) governing the localization of Fe and Zn in the rice grain. Frontiers in Genetics, 11, 213. Available from: 10.3389/fgene.2020.00213 - DOI - PMC - PubMed
    1. Bouis, H.E. & Saltzman, A. (2017) Improving nutrition through biofortification: a review of evidence from harvest plus, 2003 through 2016. Global Food Security, 12, 49–58. Available from: 10.1016/j.gfs.2017.01.009 - DOI - PMC - PubMed

Publication types

LinkOut - more resources