

The implication of calf circumference and grip strength in osteoporosis and bone mineral density among hemodialysis patients
- PMID: 36574105
- PMCID: PMC10023647
- DOI: 10.1007/s10157-022-02308-8
The implication of calf circumference and grip strength in osteoporosis and bone mineral density among hemodialysis patients
Abstract
Background: Chronic kidney disease-mineral and bone disorder (CKD-MBD), nutritional status, and uremia management have been emphasized for bone management in hemodialysis patients. Nevertheless, valuable data on the importance of muscle mass in bone management are limited, including whether conventional management alone can prevent osteoporosis. Thus, the importance of muscle mass and strength, independent of the conventional management in osteoporosis prevention among hemodialysis patients, was evaluated.
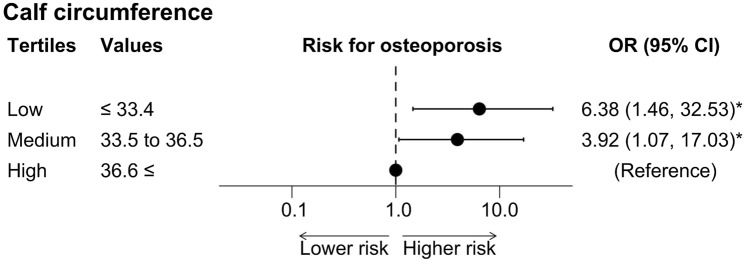
Methods: Patients with a history of hemodialysis 6 months or longer were selected. We assessed the risk for osteoporosis associated with calf circumference or grip strength using multivariable adjustment for indices of CKD-MBD, nutrition, and dialysis adequacy. Moreover, the associations between bone mineral density (BMD), calf circumference, grip strength, and bone metabolic markers were also evaluated.
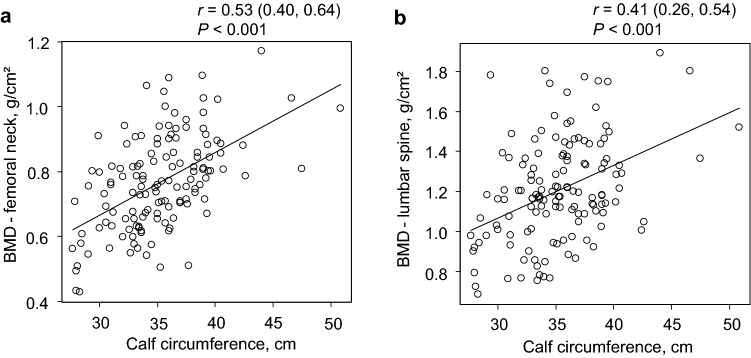
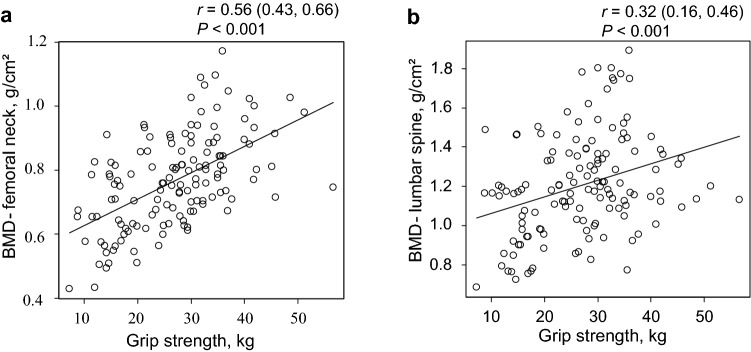
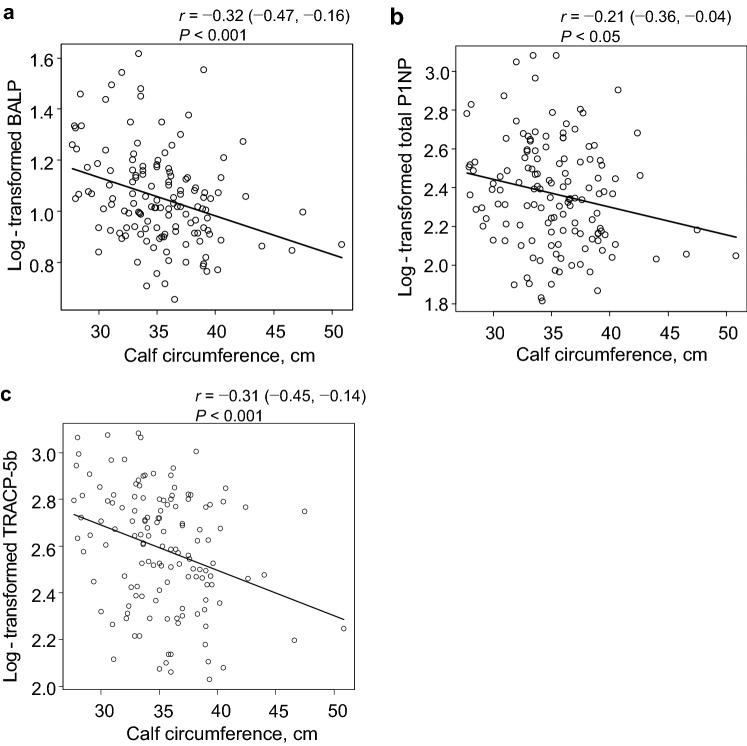
Results: A total of 136 patients were included. The odds ratios (95% confidence interval) for osteoporosis at the femoral neck were 1.25 (1.04-1.54, P < 0.05) and 1.08 (1.00-1.18, P < 0.05) per 1 cm shorter calf circumference or 1 kg weaker grip strength, respectively. Shorter calf circumference was significantly associated with a lower BMD at the femoral neck and lumbar spine (P < 0.001). Weaker grip strength was also associated with lower BMD at the femoral neck (P < 0.01). Calf circumference or grip strength was negatively correlated with bone metabolic marker values.
Conclusion: Shorter calf circumference or weaker grip strength was associated with osteoporosis risk and lower BMD among hemodialysis patients, independent of the conventional therapies.
Keywords: Hemodialysis; Osteoporosis; Sarcopenia.
© 2022. The Author(s).
Figures
Similar articles
-
The relationship between sarcopenia-related measurements and osteoporosis: The SARCOP study.Osteoporos Int. 2023 Jan;34(1):53-58. doi: 10.1007/s00198-022-06563-z. Epub 2022 Oct 4. Osteoporos Int. 2023. PMID: 36194277
-
Association between grip strength and bone mineral density in general US population of NHANES 2013-2014.Arch Osteoporos. 2020 Mar 16;15(1):47. doi: 10.1007/s11657-020-00719-2. Arch Osteoporos. 2020. PMID: 32173776
-
Interrelationships between sarcopenia, bone turnover markers and low bone mineral density in patients on hemodialysis.Ren Fail. 2023 Dec;45(1):2200846. doi: 10.1080/0886022X.2023.2200846. Ren Fail. 2023. PMID: 37122165 Free PMC article.
-
Osteoporosis, bone mineral density and CKD-MBD: treatment considerations.J Nephrol. 2017 Oct;30(5):677-687. doi: 10.1007/s40620-017-0404-z. Epub 2017 Apr 21. J Nephrol. 2017. PMID: 28432640 Review.
-
Management of osteoporosis in patients with chronic kidney disease.Osteoporos Int. 2022 Nov;33(11):2259-2274. doi: 10.1007/s00198-022-06462-3. Epub 2022 Jun 24. Osteoporos Int. 2022. PMID: 35748896 Review.
Cited by
-
Association of calf circumference with osteoporosis and hip fracture in middle-aged and older adults: a secondary analysis.BMC Musculoskelet Disord. 2024 Dec 30;25(1):1095. doi: 10.1186/s12891-024-08237-9. BMC Musculoskelet Disord. 2024. PMID: 39736558 Free PMC article.
-
Depression as a risk factor for osteoporosis independent of sarcopenia in hemodialysis patients: findings from a multicenter cross-sectional study.BMC Nephrol. 2025 Jan 23;26(1):35. doi: 10.1186/s12882-025-03963-1. BMC Nephrol. 2025. PMID: 39849392 Free PMC article.
-
Mendelian randomization study on association between grip strength and BMD in different age groups.J Bone Miner Metab. 2024 Sep;42(5):564-581. doi: 10.1007/s00774-024-01519-1. Epub 2024 Jun 17. J Bone Miner Metab. 2024. PMID: 38884649 Free PMC article.
-
The associations of calf circumference and cardiovascular and all-cause mortality among population with chronic kidney disease stages 3-5.Sci Rep. 2025 Jul 23;15(1):26764. doi: 10.1038/s41598-025-12753-6. Sci Rep. 2025. PMID: 40702088 Free PMC article.
-
3D Topographical Scanning for the Detection of Osteoporosis.J Frailty Sarcopenia Falls. 2024 Mar 1;9(1):4-9. doi: 10.22540/JFSF-09-004. eCollection 2024 Mar. J Frailty Sarcopenia Falls. 2024. PMID: 38444543 Free PMC article.
References
MeSH terms
LinkOut - more resources
Full Text Sources
Medical
