. 2023 Feb;49(1):97-116.
doi: 10.1007/s10695-022-01163-4. Epub 2022 Dec 27.

Acute stress response on Atlantic salmon: a time-course study of the effects on plasma metabolites, mucus cortisol levels, and head kidney transcriptome profile

Affiliations

Acute stress response on Atlantic salmon: a time-course study of the effects on plasma metabolites, mucus cortisol levels, and head kidney transcriptome profile

Angelico Madaro et al. Fish Physiol Biochem. 2023 Feb.

Abstract

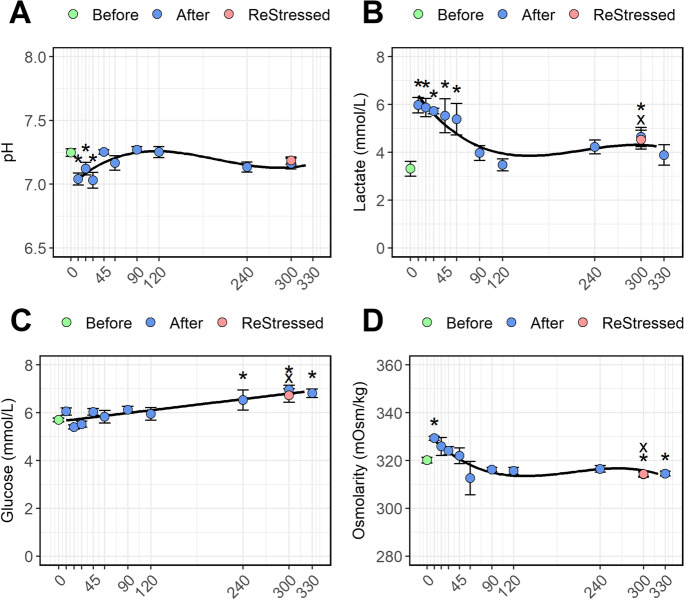
Farmed Atlantic salmon (Salmo salar) welfare and performance can be strongly influenced by stress episodes caused by handling during farming practices. To better understand the changes occurring after an acute stress response, we exposed a group of Atlantic salmon parr to an acute stressor, which involved netting and transferring fish to several new holding tanks. We describe a time-course response to stress by sampling parr in groups before (T0) and 10, 20, 30, 45, 60, 120, 240, 300, and 330 min post-stress. A subgroup of fish was also subjected to the same stressor for a second time to assess their capacity to respond to the same challenge again within a short timeframe (ReStressed). Fish plasma was assessed for adrenocorticotropic hormone (ACTH), cortisol, and ions levels. Mucus cortisol levels were analyzed and compared with the plasma cortisol levels. At 5 selected time points (T0, 60, 90, 120, 240, and ReStressed), we compared the head kidney transcriptome profile of 10 fish per time point. The considerably delayed increase of ACTH in the plasma (60 min post-stress), and the earlier rise of cortisol levels (10 min post-stress), suggests that cortisol release could be triggered by more rapidly responding factors, such as the sympathetic system. This hypothesis may be supported by a high upregulation of several genes involved in synaptic triggering, observed both during the first and the second stress episodes. Furthermore, while the transcriptome profile showed few changes at 60 min post-stress, expression of genes in several immune-related pathways increased markedly with each successive time point, demonstrating the role of the immune system in fish coping capacity. Although many of the genes discussed in this paper are still poorly characterized, this study provides new insights regarding the mechanisms occurring during the stress response of salmon parr and may form the basis for a useful guideline on timing of sampling protocols.

Keywords: Acute stress; Head kidney transcriptome profile; Mucus cortisol; Parr; Plasma ACTH; Plasma cortisol; Plasma ions; Salmo salar.


Conflict of interest statement

The authors declare no competing interests.

Figures

Fig. 1
Fig. 1
Plasma ACTH levels of Atlantic salmon parr subjected to a stressor consisting of netting transport and transfer into a new tank. Fish were sampled before (0, green dot) and 10, 20, 30, 45, 60, 90, 120, 240, and 300 min post-stress (blue dots). After 240 min post-stress, one group of fish was exposed for a second time to the same stressor and sampled 1 h after (ReStressed, red dot). Values are represented as mean ± SE (n = 8–9). Asterisks and the x (for the ReStressed vs time 0 group) show the significance (P > 0.05) of each point comparison towards the pre-stress control group (0). There was no significant change with minutes post-stress, and a regression line is therefore not included in the figure
Fig. 2
Fig. 2
Plasma (A) and mucus (B) cortisol levels of Atlantic salmon parr subjected to a stressor consisting of netting transport and transfer into a new tank. Fish were sampled before (0, green dot) and 10, 20, 30, 45, 60, 90, 120, 240, and 300 min post-stress (blue dots). After 240 min post-stress, one group of fish was exposed for a second time to the same stressor and sampled 1 h after (ReStressed, red dot). Values are represented as mean ± se (n = 10). Asterisks and the x (for the ReStressed vs time 0 group) show the significance (P > 0.05) of each point comparison towards the pre-stress control group (0). Significant trends in the post-stress cortisol levels are represented by the regression lines in the figures
Fig. 3
Fig. 3
A time variation of plasma pH (A), lactate (B), glucose (c), and osmolarity (D) of Atlantic salmon parr subjected to a stressor consisting of netting transport and transfer into a new tank. Fish were sampled before (0, green dot) and 10, 20, 30, 45, 60, 90, 120, 240, and 300 min post-stress (blue dots). After 240 min post-stress, one group of fish was exposed for a second time to the same stressor and sampled 1 h after (ReStressed, red dot). Values are represented as mean ± se (n = 10). Asterisks and the x (for the ReStressed group) show the significance (P > 0.05) of each point comparison towards the pre-stress control group (0). Significant trends in the post-stress metabolite levels are represented by the regression lines in the figures
Fig. 4
Fig. 4
A time variation of plasma K+(A), Cl- (B), Ca++ (C), Na(D) ions of Atlantic salmon parr subjected to a stressor consisting of netting transport and transfer into a new tank. Fish were sampled before (0, green dot) and 10, 20, 30, 45, 60, 90, 120, 240, and 300 min post-stress (blue dots). After 240 min post-stress, one group of fish was exposed for a second time to the same stressor and sampled 1 h after (ReStressed, red dot). Values are represented as mean ± se (n = 10). Asterisks and the x (for the ReStressed vs time 0 group) show the significance (P > 0.05) of each point comparison towards the pre-stress control group (0). Significant trends in the post-stress ions are represented by the regression lines in the figures
Fig. 5
Fig. 5
Proportion of upregulated and downregulated genes. Log2 fold change scores of significantly DE genes are represented by scattered dots (green, significantly upregulated; red, significantly downregulated). Violin plot represents non-significant log2 fold change scores
Fig. 6
Fig. 6
Venn diagram of the different expressed genes (DEGs) in the Atlantic salmon head kidney between pre-stress fish (T0) and 60, 90, 240 min (after stress), and ReStressed groups. The diagram shows the number DEG count and the proportion of the DEG out of all identified DEGs from T0 vs T60, T0 vs T90, T0 vs T240, and T0 vs ReStressed genes occurring in each comparison as well as the DEGs that are shared between several comparisons. The intensity of the background red color in each section indicated the number of DEGs
Fig. 7
Fig. 7
KEEG pathway enrichment analysis belonging. The node (square) divided into four proportions shows Z-scores of T60, T90, T240 and ReStressed group compared to T0. The red bar in each proportion mean show significant pathways with high Z-score (upregulated), and blue bar indicates significant pathway with lower Z-score than 0 (downregulated) at each time point. Edge colors indicate the pathways’ similarity in each groups’ comparison: T0 vs T60, T0 vs T90, T0 vs 240, and T0 vs ReStressed. The edge thickness shows the degree of similarity between pathways; therefore, the thicker lines display the higher number of shared genes between the pathways

References

    1. Aballai V, et al. RNA-seq analysis of the head-kidney transcriptome response to handling-stress in the red cusk-eel (Genypterus chilensis) Comp Biochem Physiol Part D Genomics Proteomics. 2017;24:111–117. doi: 10.1016/j.cbd.2017.09.002. - DOI - PubMed
    1. Agulleiro MJ, et al. Role of melanocortin receptor accessory proteins in the function of zebrafish melanocortin receptor type 2. Mol Cell Endocrinol. 2010;320(1–2):145–152. doi: 10.1016/j.mce.2010.01.032. - DOI - PubMed
    1. Arends RJ, et al. The stress response of the gilthead sea bream (Sparus aurata L.) to air exposure and confinement. J Endocrinol. 1999;163(1):149–57. doi: 10.1677/joe.0.1630149. - DOI - PubMed
    1. Balasch JC, Tort L (2019) Netting the stress responses in fish. Front Endocrinol (Lausanne)10:62. 10.3389/fendo.2019.00062 - PMC - PubMed
    1. Barton B. Stress in fishes: a diversity of responses with particular reference to changes in circulating corticosteroids. Integr Comp Biol. 2002;42(3):517–525. doi: 10.1093/icb/42.3.517. - DOI - PubMed

LinkOut - more resources