. 2023 Feb 6;222(2):e202108144.
doi: 10.1083/jcb.202108144. Epub 2022 Dec 27.

TBK1 phosphorylation activates LIR-dependent degradation of the inflammation repressor TNIP1

Affiliations

TBK1 phosphorylation activates LIR-dependent degradation of the inflammation repressor TNIP1

Jianwen Zhou et al. J Cell Biol. .

Abstract

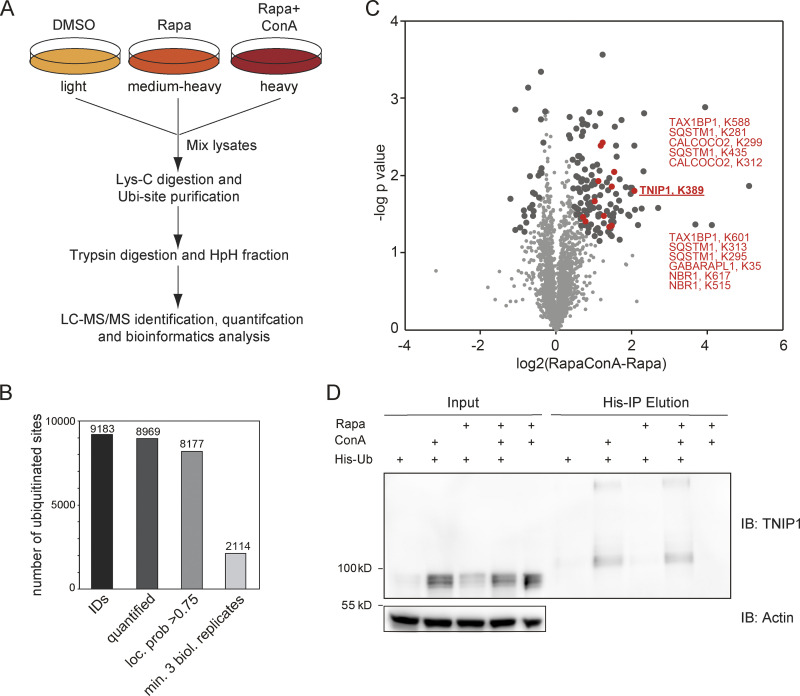
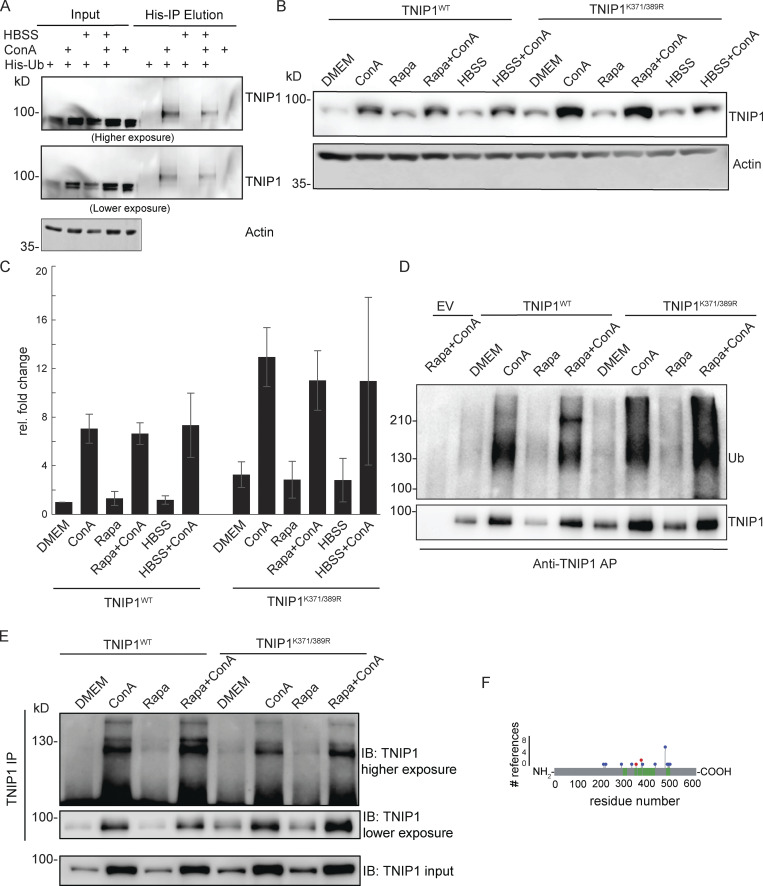
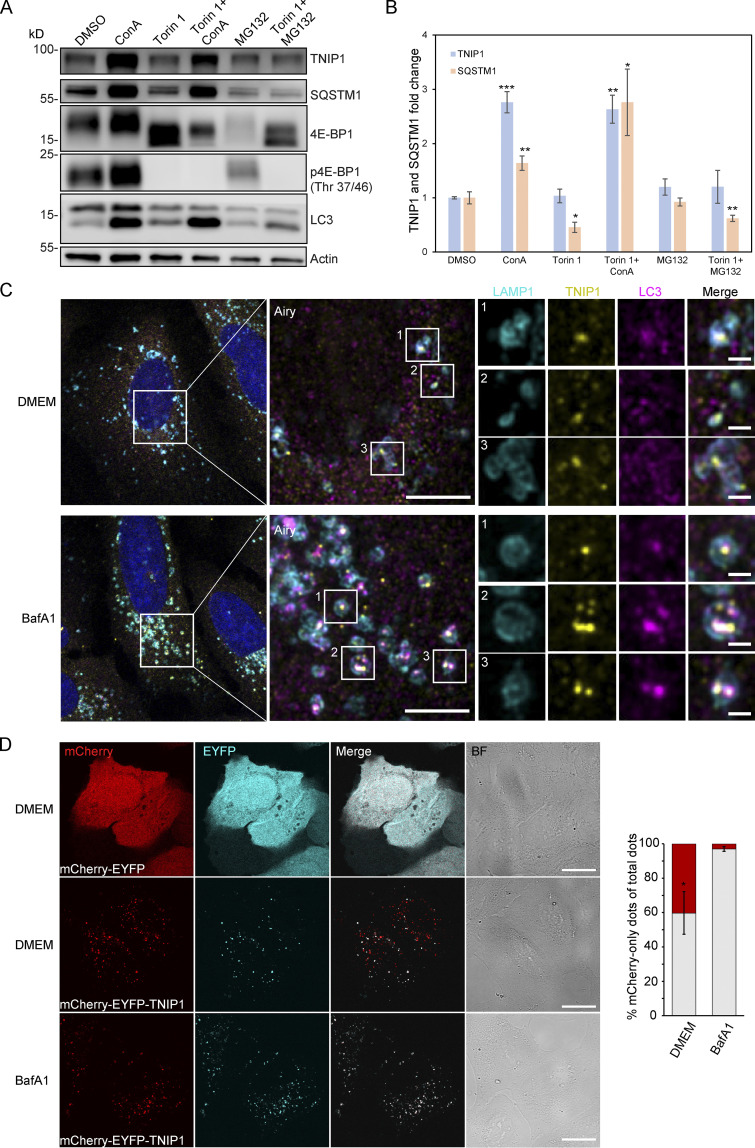
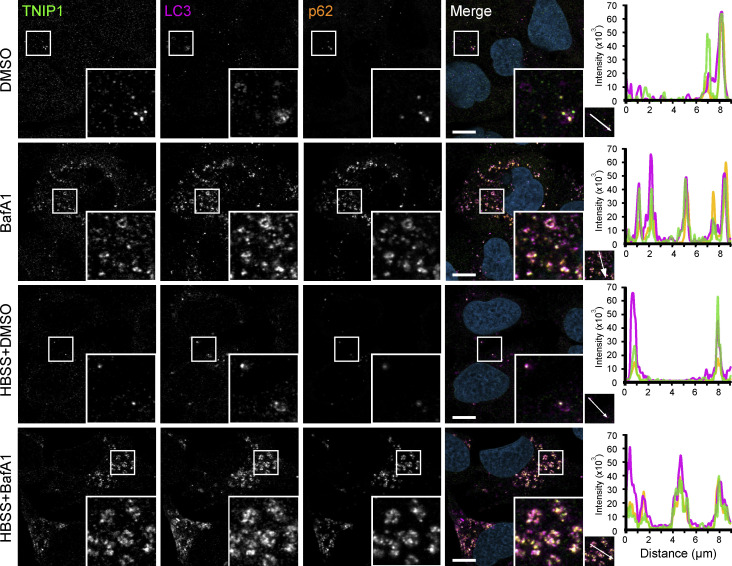
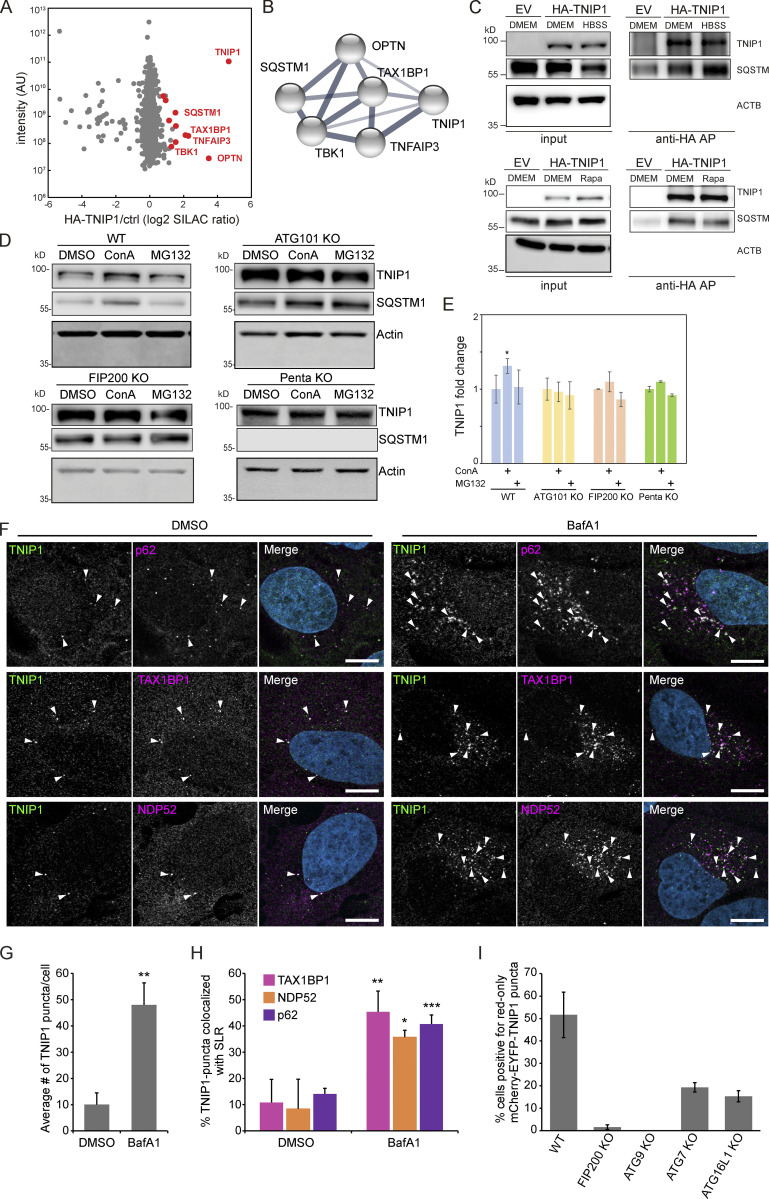
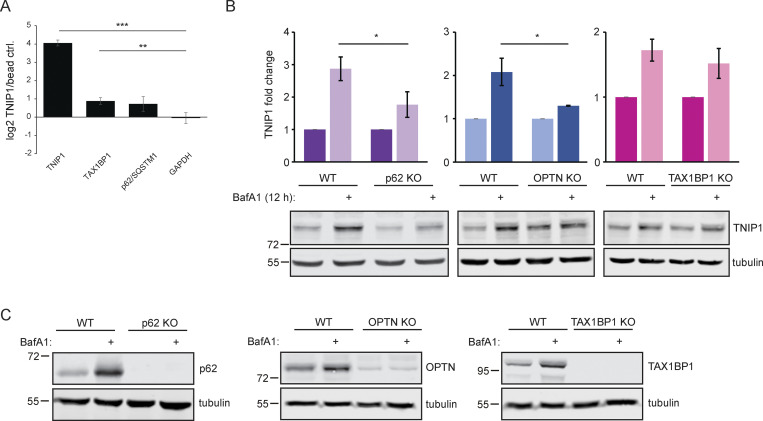
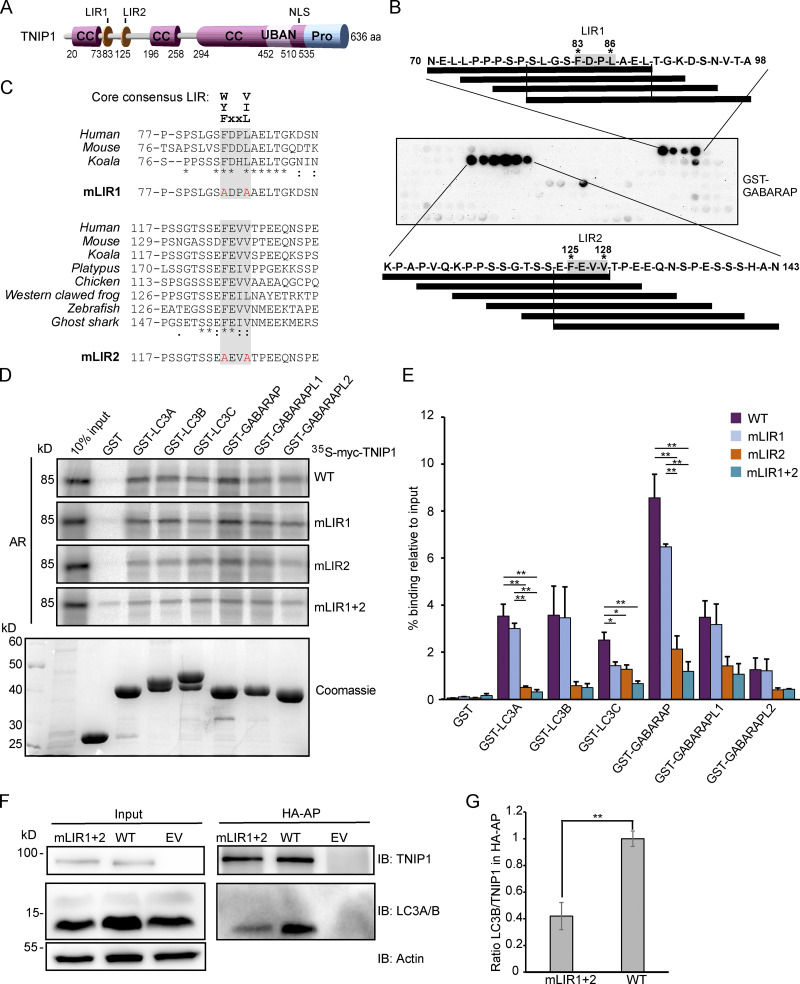
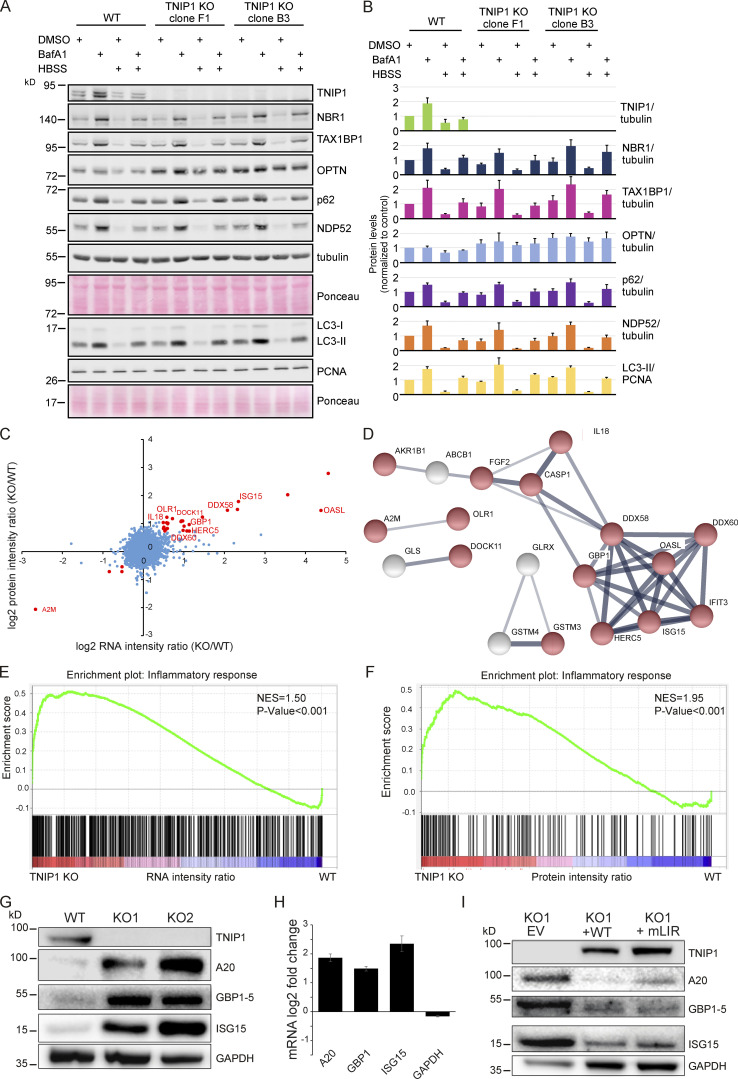
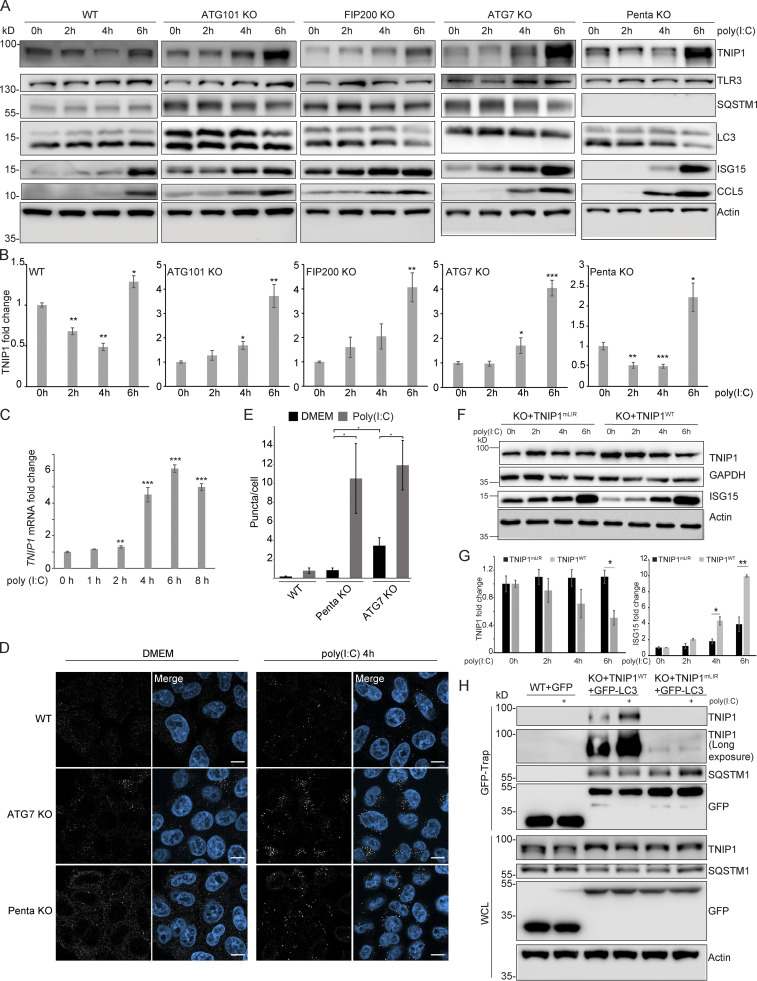
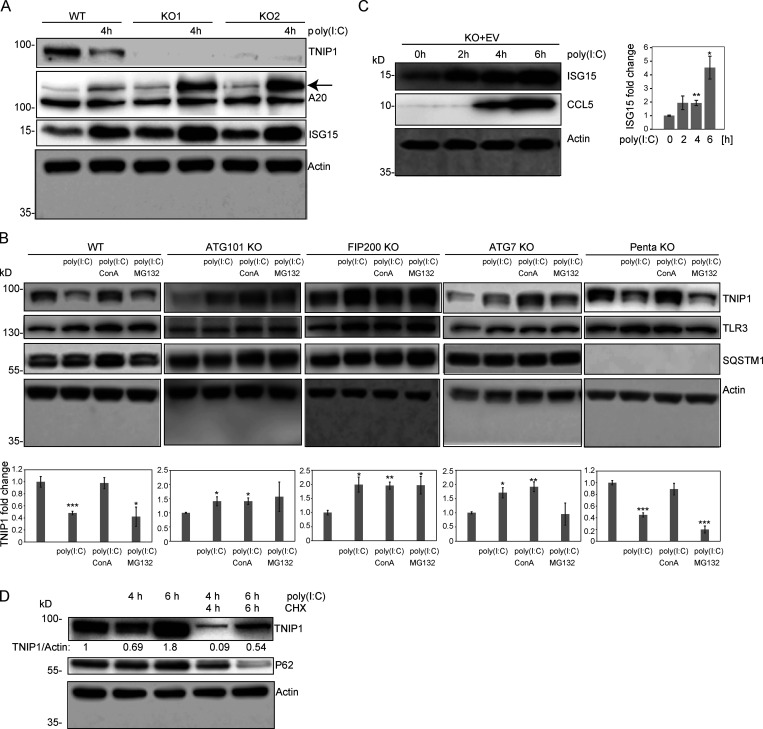
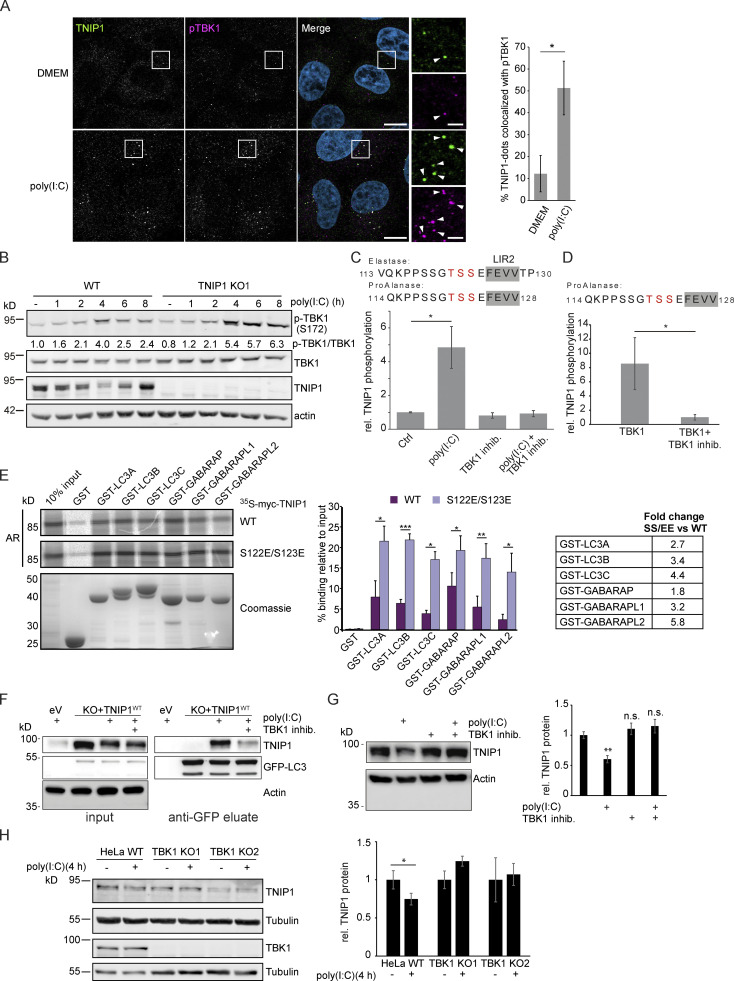
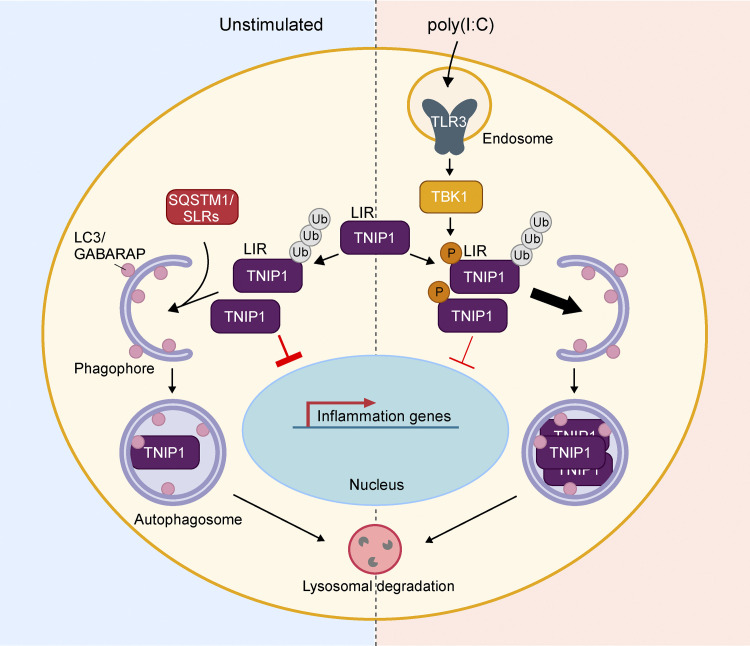
Limitation of excessive inflammation due to selective degradation of pro-inflammatory proteins is one of the cytoprotective functions attributed to autophagy. In the current study, we highlight that selective autophagy also plays a vital role in promoting the establishment of a robust inflammatory response. Under inflammatory conditions, here TLR3-activation by poly(I:C) treatment, the inflammation repressor TNIP1 (TNFAIP3 interacting protein 1) is phosphorylated by Tank-binding kinase 1 (TBK1) activating an LIR motif that leads to the selective autophagy-dependent degradation of TNIP1, supporting the expression of pro-inflammatory genes and proteins. This selective autophagy efficiently reduces TNIP1 protein levels early (0-4 h) upon poly(I:C) treatment to allow efficient initiation of the inflammatory response. At 6 h, TNIP1 levels are restored due to increased transcription avoiding sustained inflammation. Thus, similarly as in cancer, autophagy may play a dual role in controlling inflammation depending on the exact state and timing of the inflammatory response.


Conflict of interest statement

Disclosures: The authors declare no competing financial interests.

Figures

Figure 1.
Figure 1.
Ubiquitination and lysosomal degradation of TNIP1. (A) MS workflow to quantify ubiquitination sites potentially involved in autophagy-dependent lysosomal protein degradation. U2OS and HeLa cells were SILAC labeled and treated for 4 h with 100 nM rapamycin (Rapa), Rapa and 2 nM concanamycin A (ConA), or DMSO as control. After mixing of lysates, proteins were digested with Lys-C endoproteinase and ubiquitinated peptides were enriched using the UbiSite approach (Akimov et al., 2018). Enriched peptides were digested with trypsin, followed by high-pH reversed phase fractionation (Batth and Olsen, 2016) and shotgun LC-MS/MS analysis. (B) Detected ubiquitination sites. In three biological replicates, 9,183 ubiquitination sites were identified of which 8,969 were quantified. (C) Volcano plot highlighting significantly regulated ubiquitination sites. Significantly regulated sites comparing Rapa with Rapa + ConA treated cells are highlighted in dark grey (n = 3, paired two-sided t test, FDR < 0.05, S0 = 0.1, 148 sites in total; see Table S1). Data distribution was assumed to be normal but this was not formally tested. Non-regulated sites are colored in light gray. Sites identified on known autophagy receptors are colored in red exemplifying data quality. The newly identified site on TNIP1, K389, is highlighted in bold red. (D) TNIP1 gets ubiquitinated and degraded in the lysosome. U2-OS-StUbEx cells inducibly expressing His-FLAG-tagged ubiquitin at endogenous levels were used to enrich ubiquitinated proteins (Akimov et al., 2014). Under control conditions as well as under 4 h 100 nM rapamycin treatment TNIP1 got ubiquitinated as shown by anti-TNIP1 immunoblots. Ubiquitinated TNIP1 was stabilized by the addition of concanamycin A indicating its lysosomal degradation in treated and nontreated cells. The same was observed for starved cells (HBSS treatment; see Fig. S1). Actin was used as loading control. Note: Due to the design of the experiment and the used gels, the molecular weight marker (PageRuler Plus, #26619; Thermo Fisher Scientific) and the Rapa+/ConA+ sample were run in the same lane. In the respective source data, an additional replicate is shown in which samples ran separately. Source data are available for this figure: SourceData F1.
Figure S1.
Figure S1.
TNIP1 gets ubiquitinated and degraded in the lysosome. (A) U2-OS-StUbEx cells inducibly expressing His-FLAG-tagged ubiquitin at endogenous levels were used to enrich ubiquitinated proteins (Akimov et al., 2014). Under control conditions as well as under starvation treatment (HBSS), TNIP1 gets ubiquitinated as shown by anti-TNIP1 immunoblots. Ubiquitinated TNIP1 was stabilized by the addition of concanamycin A (ConA) indicating its lysosomal degradation in treated and nontreated cells. Actin was used as loading control. (B and C) Mutations of identified TNIP1 ubiquitination sites do not lead to reduced lysosomal degradation as indicated by stabilized protein amounts by ConA treatment. This is the case for fed control conditions (DMEM) as well as under active autophagy (Rapa and HBSS treatment). C shows quantification of blots exemplified in B (n = 3, error bars indicate SD). (D and E) Mutated TNIP1K371/389R is still getting ubiquitinated as indicated by anti-TNIP1 IP followed by anti-ubiquitin (D) and anti-TNIP1 (E) Western blot. The addition of ConA leads in all cases to a stabilization of non-ubiquitinated and polyubiquitinated protein variants. (F) Identified ubiquitination sites according to PhosphoSitePlus database and this study. Gray bar depicts the amino acid sequence of TNIP1. Sections in green mark tryptic peptides identified in this study, i.e., sequence coverage of TNIP1. Amino acids marked in blue highlight published ubiquitination sites, number of references shown on y-axis. Amino acids marked in red were identified in this study. Source data are available for this figure: SourceData FS1.
Figure 2.
Figure 2.
TNIP1 is degraded by autophagy. (A) U2OS cells were treated with 1 μM Torin-1 for 4 h; proteasomal or lysosomal degradation were inhibited by 10 μM MG132 or 2 nM ConA, respectively. Under fed conditions (DMSO) and in Torin-1 treated cells blockage of lysosomal acidification led to a significant increase of TNIP1 protein abundance. Shown are representative blots of three biological replicates. (B) Quantification of blots shown in A (n = 3). * = P < 0.05, ** = P < 0.01, *** = P < 0.001 unpaired, two-sided t test compared to DMSO treated samples. Error bars indicate SEM. (C) Confocal images showing colocalization between endogenous TNIP1, LAMP1 and LC3 in U2OS cells treated for 5 h with either BafA1 or vehicle DMSO. Cells were immunostained against endogenous TNIP1 (yellow), LAMP1 (cyan), and LC3 (purple) and imaged by Airyscan using the Zeiss LSM880 confocal microscope. Inserts highlight TNIP1 localized in LAMP1- and LC3-positive structures. Due to BafA1 treatment leading to accumulation of the immunostained proteins, signal intesities in the DMSO image have been increased relative to the BafA1 treated image during post-processing. Scale bars are 5 µm for the airyscan images and 1 µm for the inserts. (D) U2OS cells were transiently transfected with either mCherry-EYFP or mCherry-EYFP-TNIP1. 24 h after transfection, cells were either left untreated or treated with BafA1 for 4 h. BF = bright field. Scale bars, 20 µm. Quantification of red-only TNIP1 dots over total TNIP1 dots was done using Volocity software (PerkinElmer), with intensity cut-offs based on BafA1 intensity of red and green dots (n = 3). Around 2,000–3,000 dots were counted for each condition within each replicate. * = P < 0.05, unpaired, two-sided t test. Error bars indicates SD. In B and D, data distribution was assumed to be normal, but this was not formally tested. Source data are available for this figure: SourceData F2.
Figure S2.
Figure S2.
TNIP1 localizes to autophagosomes. U2OS cells kept in either fed or starved (HBSS) conditions and treated with either vehicle (DMSO) or BafA1 for 8 h. Cells were fixed and stained with antibodies against endogenous TNIP1 (green), p62 (orange), and LC3 (purple) and imaged using the Zeiss LSM800 confocal microscope. Line-profile co-localization plots were made using the line-profile quantification tool in the Zen blue imaging software (Zeiss). Vertical axis represents measurements of fluorescent intensity and the horizontal axis the drawn distances. Scale bar = 10 µm.
Figure 3.
Figure 3.
TNIP1 localizes to p62 bodies. (A) HA-TNIP1 affinity purification (AP)-MS highlights its interaction with autophagy receptors. HeLa cells expressing HA-TNIP1 and vector control cells (ctrl.) were differentially SILAC-labeled and anti-HA APs were performed under basal conditions, followed by quantitative MS analyses (n = 3). Proteins that were significantly enriched in minimum two out of three replicates are highlighted in red (P < 0.05, BH corrected). Proteins with known functions in autophagy and inflammation are annotated. (B) TNIP1 interactome. STRING DB was used to highlight the TNIP1 interactome identified in A (Szklarczyk et al., 2019). Thickness of edges indicate confidence of interaction. (C) TNIP1 interacts with p62/SQSTM1. Anti-HA affinity purifications followed by Western blot analyses were performed to test for HA-TNIP1-p62/SQSTM1 interactions as identified in A in basal (DMEM), stress conditions (amino acid starvation, HBSS) and after rapamycin (Rapa) treatment each for 4 h. EV, empty vector. (D and E) TNIP1 is degraded in an autophagy- and SLR-dependent manner. Shown are representative blots of three biological replicates. HeLa WT cells, ATG101 KO cells, FIP200 KO cells and PentaKO cells were treated with 10 μM MG132 or 2 nM ConA for 4 h. TNIP1 abundance was significantly increased in ConA-treated HeLa WT cells, while treatment had no effect in HeLa ATG101 KO, FIP200 KO, and pentaKO cells. E shows quantifications of D (n = 3). * = P < 0.05, unpaired, two-sided t test. Error bars indicates SEM. (F) U2OS cells were treated with either vehicle (DMSO) or BafA1 for 5 h and stained for endogenous TNIP1 (green) together with either endogenous p62, NDP52 or TAX1BP1. Representative images are shown. Colocalization between TNIP1 and respective SLRs are indicated by arrowheads. Scale bars, 10 µm. (G) Quantification of the average number of TNIP1 puncta per cell imaged in F (>40 cells analyzed for each condition within each replicate [n = 3]). ** = P < 0.01, unpaired two-sided t test. Error bars indicate SD. (H) Quantification of percent TNIP1 puncta colocalizing with the indicated SLRs in F (>40 cells analyzed for each condition within each replicate [n = 3]). *** = P < 0.001, ** = P < 0.01, * = P < 0.05, unpaired, two-sided t test. Error bars indicate SD. (I) Transient transfection of mCherry-EGFP-TNIP1 in WT U2OS cells and indicated KO cell lines. The graph bars indicate the percentage of transfected cells containing >5 red-only puncta indicative of autophagic degradation. Each graph bar shows the mean value from three separate transfections (n = 3, >100 cells counted per transfection, unpaired, two-sided t test). Error bars indicate SD. In E and G–I, data distribution was assumed to be normal, but this was not formally tested. Source data are available for this figure: SourceData F3.
Figure S3.
Figure S3.
Endogenous TNIP1 interacts with TAX1BP1 and p62/SQSTM1 under basal conditions. (A) SILAC-based, IP-MS analyses of anti-TNIP1 immunoprecipitations identified TAX1BP1 and p62/SQSTM1 as enriched compared to negative control IPs using beads only. GAPDH is shown as negative control. Shown are average values of three biological replicates (n = 3). Error bars: SD, ** = P < 0.01, *** = P < 0.001, unpaired, two-sided t test. (B and C) Lysosomal turnover of TNIP1 is mediated by several SLRs. HeLa WT and HeLa p62, OPTN, and TAX1BP1 KO cells were either left untreated or treated with 200 nM BafA1 for 12 h. Shown are average values of three biological replicates. Error bars: SD, * = P < 0.05, unpaired, two-sided t test. Source data are available for this figure: SourceData FS3.
Figure 4.
Figure 4.
TNIP1 interacts with human ATG8 family proteins through a LIR motif. (A) Schematic drawing of the domain architecture of TNIP1, showing possible LIRs. (B) Peptide array of 20-mer peptides covering full length TNIP1 was used to probe for possible LIRs, using GST-GABARAP. (C) Amino-acid sequence alignment showing conservation of the core consenesus LIRs in TNIP1 across species. TNIP1 amino acid sequences were collected from UniProt, and multiple sequence alignment performed with Clustal Omega. Asterisk (*) indicates fully conserved residues; colon (:) indicates conservation between groups of strongly similar properties (>0.5 Gonnet PAM 250 matrix); and a period (.) indicates conservation between groups of weakly similar properties (0–0.5 Gonnet PAM 250 matrix). Mutated residues for the LIR mutants (mLIR1 and mLIR2) are shown in red. (D) In vitro GST-pulldown assay using 35S-labeled myc-TNIP1, myc-TNIP1-F83A/L86A (mLIR1), myc-TNIP1-F125A/V128A (mLIR2) and myc-TNIP1-F83A/L86A/F125A/V128A (mLIR1+2) against recombinant GST and GST-tagged human ATG8s. Bound myc-TNIP1 WT and LIR mutants were detected by autoradiography (AR). (E) Quantification of GST-pulldown from D. Relative % binding was quantified against 10% input (n = 3). * = P < 0.05, ** = P < 0.01, based on one-way ANOVA (post hoc Tukey test). Error bars indicate SEM. (F) LIR mutation impacts in vivo interaction with LC3A/B. Anti-HA AP of cells expressing HA-TNIP1WT and HA-TNIP1mLIR1+2 were performed followed by Western blot against indicated proteins. LIR mutation reduced the interaction between TNIP1 and LC3A/B. (G) Quantification of blots exemplified in panel F (n = 3). Error bars indicate SEM. ** = P < 0.01, unpaired, two-sided t test. In E and G, data distribution was assumed to be normal, but this was not formally tested. Source data are available for this figure: SourceData F4.
Figure 5.
Figure 5.
Loss of TNIP1 leads to an increase in inflammatory proteins. (A) Loss of TNIP1 does not alter autophagy flux under basal and starvation conditions. TNIP1 knock out HeLa cells generated by CRISPR/Cas9 were used to study its effect on autophagy. Wild-type HeLa cells and the two TNIP1 knockout clones denoted KO1 and KO2 were kept in either fed or starved (HBSS) conditions and treated with either vehicle (DMSO) or BafA1 for 8 h. Blots were probed for several known SLRs as well as LC3. (B) Quantification of blots shown in A (n = 3). Error bars indicate SD. (C) Loss of TNIP1 leads to an increased transcription of inflammatory genes. Fold changes of RNA and protein intensities of TNIP1 KO and WT cells were compared. Shown are average values of two KO clones compared to WT cells (n = 3 per cell type for RNAseq; n = 5 per cell type for proteomics). Genes that were significantly regulated on RNA and protein level are highlighted in red (P < 0.01). Genes linked to immune effector processes and interferon-stimulated genes are annotated. (D) Protein-protein interactions of significantly regulated proteins. Proteins highlighted in red in C were analyzed on known interactions using STRING DB (Szklarczyk et al., 2019). Interactions between 17 proteins were identified, of which 13 are linked to stress response (marked in red). Thickness of edges indicate confidence of interaction. (E and F) Gene set enrichment analysis of significantly dysregulated mRNAs and proteins identifies an increased transcription and translation of genes involved in inflammation. NES denotes normalized enrichment score. (G–I) TNIP1 represses translation of pro-inflammatory gene products. Whereas knockout of TNIP1 led to an increased abundance of indicated inflammatory proteins (G), which is likely due to transcriptional changes (H, n = 3, error bars indicate SEM), re-expression of TNIP1WT or TNIP1mLIR1+2 blunted this phenotype (I). Source data are available for this figure: SourceData F5.
Figure 6.
Figure 6.
Poly(I:C) stimulation induces LIR-dependent, specific degradation of TNIP1 by autophagy. (A) Poly(I:C) treatment leads to time-dependent changes in TNIP1 abundance. Poly(I:C) stimulation leads to an autophagy dependent and SLR independent decrease of TNIP1 abundance within the first 4 h as indicated by a block of degradation in ATG101, FIP200 and ATG7 KO cells. Autophagy receptors appear to have a minor influence as degradation still occurs in pentaKO cells. (B) Quantification of blots shown in A (n = 3). Error bars indicate SEM. * = P < 0.05, ** = P < 0.01, *** = P < 0.001 unpaired, two-sided t test compared to 0 h values of respective cell lines. (C) After 2–4 h of poly(I:C) treatment TNIP1 transcription is significantly upregulated. Bar diagrams show quantification of three biological replicates (n = 3), error bars: SEM. * = P < 0.05, ** = P < 0.01, *** = P < 0.001; unpaired, two-sided t test. (D) Representative immunofluorescent images showing endogenous TNIP1 response to poly(I:C) in WT, ATG7 KO, and pentaKO. Cells were either left untreated or treated with 5 µg/ml poly(I:C) for 4 h. Scale bar = 10 µm. (E) Quantification of images shown in D, error bars indicate SEM. * = P < 0.05, unpaired two-sided t test. (F and G) The degradation of TNIP1 depends on functional LIR motifs. TNIP1 WT is degraded in a time-dependent fashion after poly(I:C) stimulation. The double LIR mutant TNIP1 (LIR1+2, TNIP1mLIR) is spared from degradation. Note: Protein amounts of TNIP1 and ISG15 correlate inversely. Due to ectopic expression of TNIP1 variants regulation based on transcriptional/translational control as shown in A is lost. E shows quantification of blots exemplified in D (n = 3). Error bars indicate SEM. * = P < 0.05, unpaired, two-sided t test. KO1 cells were used for reconstitution. (H) Poly(I:C) induces a LIR-dependent interaction with LC3. Indicated HeLa cells expressing GFP-LC3 were used for anti-GFP AP. Cells expressing TNIP1mLIR do not exhibit an increased interaction between TNIP1 and GFP-LC3 after poly(I:C) treatment, in contrast to cells expressing TNIP1WT. KO1 cells were used for reconstitution. In B, C, E, and G, data distribution was assumed to be normal, but this was not formally tested. Source data are available for this figure: SourceData F6.
Figure S4.
Figure S4.
Regulation of TNIP1 protein abundance. (A) Reduction of TNIP1 correlates with an increase of ISG15 and TNFAIP3/A20 in HeLa cells. The increase of the TNIP1 interaction partner TNFAIP3 under poly(I:C) treatment indicates the existence of distinct TNIP1 pools, i.e., free and bound to TNFAIP3. Arrow marks A20 band. (B) Poly(I:C) treatment leads to an autophagy-dependent and SLR-independent lysosomal degradation of TNIP1. Whereas lysosomal inhibition by ConA treatment leads to a significant block of TNIP1 degradation in WT and pentaKO cells, proteasomal inhibition by MG132 treatment has no effect. In ATG101 KO, FIP200 KO and ATG7 KO, autophagy incompetent cell lines poly(I:C) does not lead to TNIP1 degradation. TLR3 and SQSTM1 are monitored as positive controls, actin as loading control. Shown are representative blots of three biological replicates each. Bar diagram shows quantification, error bars: SEM. * = P < 0.05, ** = P < 0.01, *** = P < 0.001, unpaired, two-sided t test. (C) TNIP1 KO cells transfected with an empty control vector (EV) do also respond to poly(I:C) treatment by an upregulation of ISG15 and CCL5 similar to KO cells transfected with a TNIP1 expression construct. This indicates that ISG15 and CCL5 abundances are not only regulated by TNIP1. Shown are representative blots of three biological replicates. Bar diagram shows quantification. Error bars represent SEM. * = P < 0.05, ** = P < 0.01, *** = P < 0.001; unpaired, two-sided t test. (D) Blockage of protein translation by cycloheximide (CHX) treatment reduced the time- and poly(I:C)-dependent increase of TNIP1 after 6 h of treatment indicating a regulation on translational level. Source data are available for this figure: SourceData FS4.
Figure 7.
Figure 7.
Poly(I:C) stimulation induces TBK1-dependent, specific degradation of TNIP1 by autophagy. (A) Immunofluorescence images showing colocalization between TNIP1 and pTBK1 upon poly(I:C) treatment. Cells were either left untreated or treated with 5 µg/ml poly(I:C) for 4 h, and subsequently stained for endogenous TNIP1 and pTBK1. Colocalization between TNIP1 and pTBK1 is indicated by arrowheads. Quantification of TNIP1 dots colocalizing with pTBK1 was done using Volocity software (PerkinElmer). Around 160–220 cells were counted for each condition in each independent experiment (n = 3). * = P < 0.05, unpaired two-sided t test. Error bars indicate SD. Scale bar in overview image is 10 µm, and scale bar in insert is 2 µm. (B) Time-course effect of poly(I:C) treatment on TBK1 activation and TNIP1. Representative blot and the corresponding quantification of the relative pTBK1 over total TBK1 levels are shown. (C and D) TBK1 phopshorylates TNIP1 N-terminal of LIR2. (C) In vivo phosphoproteomics using Elastase or ProAlanase as proteolytic enzymes identified indicated phosphopeptides. The single phosphorylation site could not be unambiguously localized to one of the three amino acid residues highlighted in red. Inhibition of TBK1 blocked the respective phosphorylation event (n ≥ 3). (D) In vitro kinase assay using purified TBK1 and TNIP1 coupled to phosphoproteomics indicates that TBK1 directly phosphorylates TNIP1 on one of the amino acid residues highlighted in red. * = P < 0.05, unpaired two-sided t test. Error bars indicate SEM. (E) In vitro GST-pulldown assay using 35S-labeled myc-TNIP1 and myc-TNIP1-S122E/S123E against recombinant GST and GST-tagged human ATG8s. Bound myc-TNIP1 WT and S122E/S123E was detected using autoradiography (AR). Quantification and fold change of n = 3, * = P < 0.05, ** = P < 0.01, *** = P < 0.001; unpaired two-sided t test. Error bars indicate SD. (F) The interaction between TNIP1 and LC3B is regulated by TBK1. GFP-LC3B is purified using GFP trap beads. Bound TNIP1 is deteced by Western blot. Inhibition of TBK1 by MRT67307 negatively regulates the poly(I:C)-dependent interaction of TNIP1 with LC3. KO1 cells were used for reconstitution. (G) Inhibition of TBK1 negatively interferes with poly(I:C)-dependent degradation of TNIP1. Western blots of whole cell lysate indicate TNIP1 stabilization by TBK1 inhibition. Actin was used as loading control (n = 3). Error bars indicate SEM. ** = P < 0.01, unpaired, two-sided t test. (H) TBK1 KO negatively interferes with poly(I:C)-dependent degradation of TNIP1. Western blots of whole cell lysate indicate TNIP1 stabilization by TBK1 KO in two independent cell lines. Tubulin was used as loading control (n = 3). Error bars indicate SD. ** = P < 0.01, unpaired, two-sided t test. In A, C, D, E, G, and H, data distribution was assumed to be normal, but this was not formally tested. Source data are available for this figure: SourceData F7.
Figure 8.
Figure 8.
Model of TNIP1 regulation. Under basal, unstimulated conditions (left panel), TNIP1 functions as a negative regulator of inflammatory signaling and is subject to constitutive autophagic degradation through interaction with autophagy receptors such as p62/SQSTM1. Upon poly(I:C)-induced activation of TLR3 (right panel), activated TBK1 phosphorylates TNIP1 in the vicinity of its LIR, increasing TNIP1 affinity for human LC3 and GABARAP proteins. This, in turn, leads to a LIR-dependent increase in TNIP1 degradation through selective autophagy. The removal of TNIP1 relieves the negative effect on inflammatory signaling, allowing the establishment of a robust inflammatory response upon antiviral signaling.

Similar articles

Cited by

References

    1. Abudu, Y.P., Shrestha B.K., Zhang W., Palara A., Brenne H.B., Larsen K.B., Wolfson D.L., Dumitriu G., Øie C.I., Ahluwalia B.S., et al. . 2021. SAMM50 acts with p62 in piecemeal basal- and OXPHOS-induced mitophagy of SAM and MICOS components. J. Cell Biol. 220:220. 10.1083/jcb.202009092 - DOI - PMC - PubMed
    1. Akimov, V., Barrio-Hernandez I., Hansen S.V.F., Hallenborg P., Pedersen A.-K., Bekker-Jensen D.B., Puglia M., Christensen S.D.K., Vanselow J.T., Nielsen M.M., et al. . 2018. UbiSite approach for comprehensive mapping of lysine and N-terminal ubiquitination sites. Nat. Struct. Mol. Biol. 25:631–640. 10.1038/s41594-018-0084-y - DOI - PubMed
    1. Akimov, V., Henningsen J., Hallenborg P., Rigbolt K.T., Jensen S.S., Nielsen M.M., Kratchmarova I., and Blagoev B.. 2014. StUbEx: Stable tagged ubiquitin exchange system for the global investigation of cellular ubiquitination. J. Proteome Res. 13:4192–4204. 10.1021/pr500549h - DOI - PubMed
    1. Alemu, E.A., Lamark T., Torgersen K.M., Birgisdottir A.B., Larsen K.B., Jain A., Olsvik H., Øvervatn A., Kirkin V., and Johansen T.. 2012. ATG8 family proteins act as scaffolds for assembly of the ULK complex: Sequence requirements for LC3-interacting region (LIR) motifs. J. Biol. Chem. 287:39275–39290. 10.1074/jbc.M112.378109 - DOI - PMC - PubMed
    1. Allanore, Y., Saad M., Dieudé P., Avouac J., Distler J.H., Amouyel P., Matucci-Cerinic M., Riemekasten G., Airo P., Melchers I., et al. . 2011. Genome-wide scan identifies TNIP1, PSORS1C1, and RHOB as novel risk loci for systemic sclerosis. PLoS Genet. 7:e1002091. 10.1371/journal.pgen.1002091 - DOI - PMC - PubMed

Publication types