. 2023 Feb 8;8(3):e163397.
doi: 10.1172/jci.insight.163397.

TRPM7 kinase is required for insulin production and compensatory islet responses during obesity

Affiliations

TRPM7 kinase is required for insulin production and compensatory islet responses during obesity

Noushafarin Khajavi et al. JCI Insight. .

Abstract

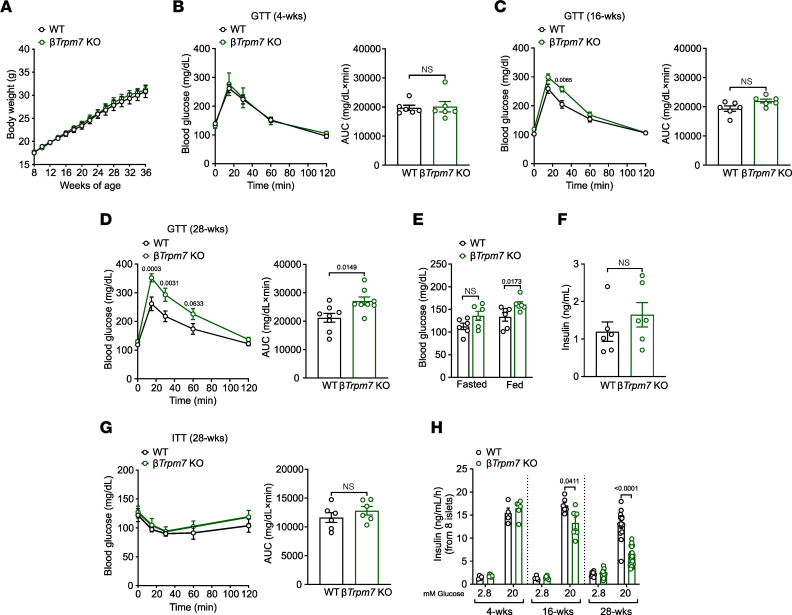
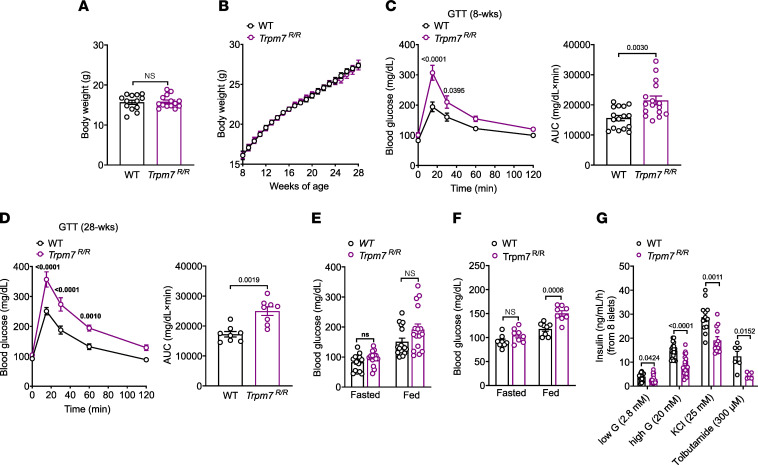
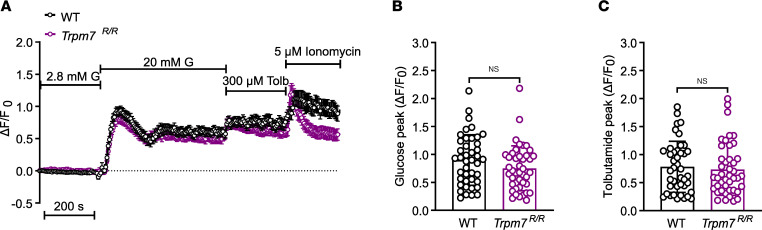
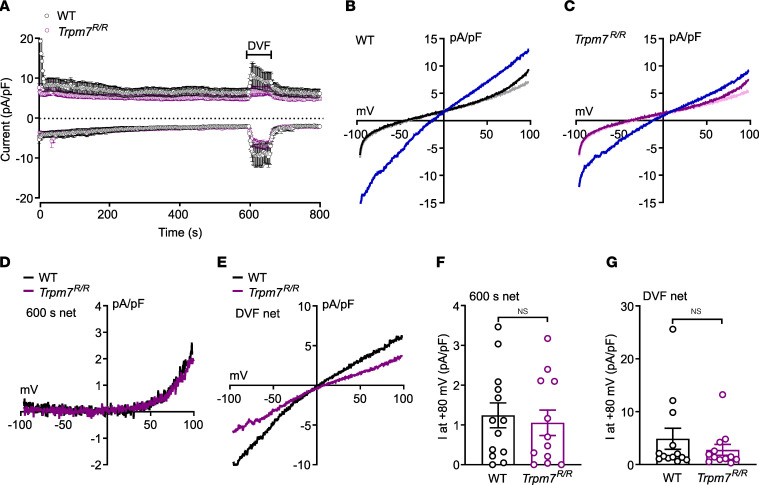
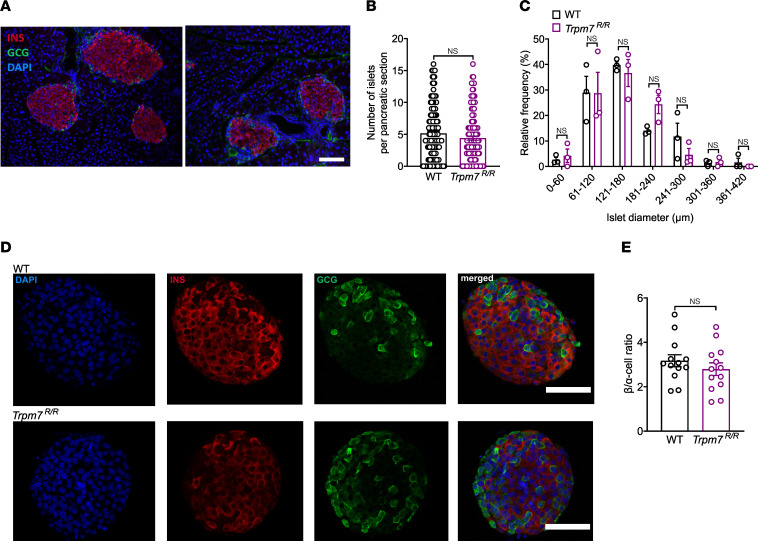
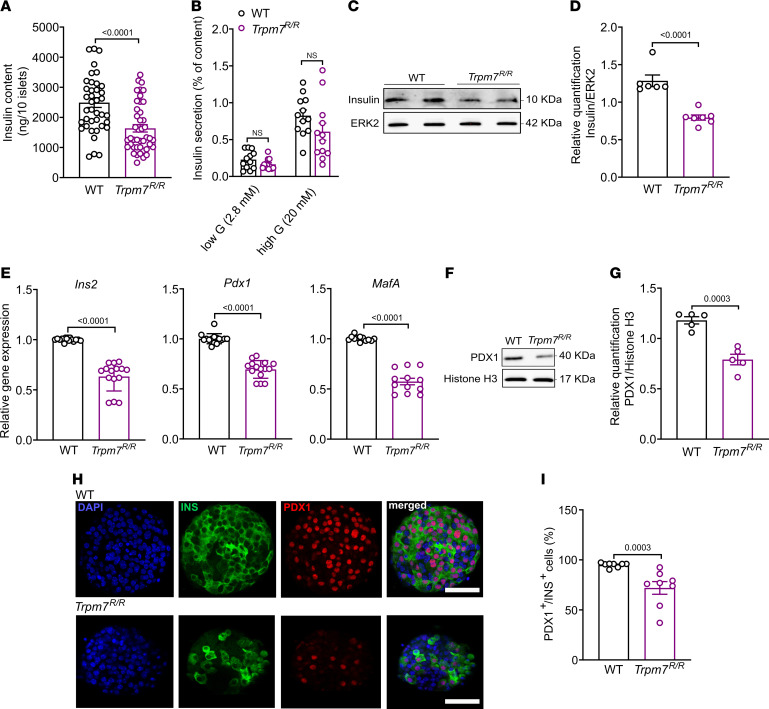
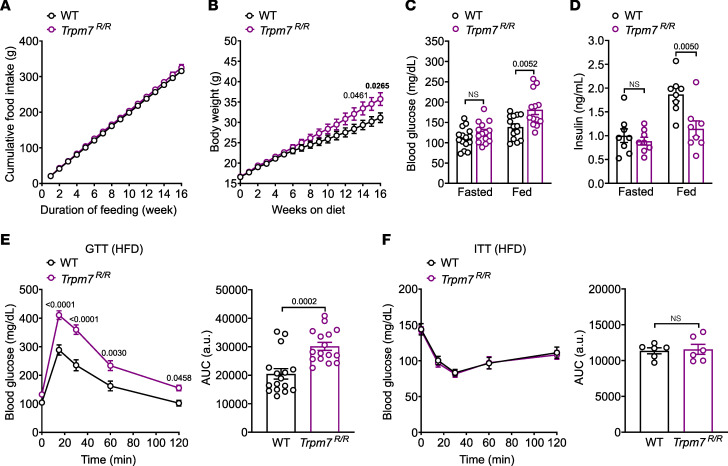
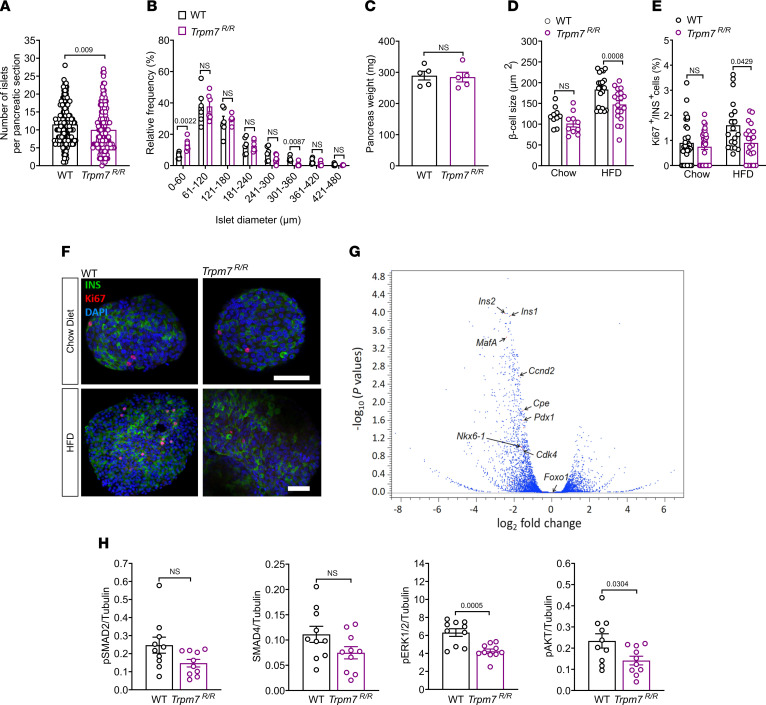
Most overweight individuals do not develop diabetes due to compensatory islet responses to restore glucose homeostasis. Therefore, regulatory pathways that promote β cell compensation are potential targets for treatment of diabetes. The transient receptor potential cation channel subfamily M member 7 protein (TRPM7), harboring a cation channel and a serine/threonine kinase, has been implicated in controlling cell growth and proliferation. Here, we report that selective deletion of Trpm7 in β cells disrupted insulin secretion and led to progressive glucose intolerance. We indicate that the diminished insulinotropic response in β cell-specific Trpm7-knockout mice was caused by decreased insulin production because of impaired enzymatic activity of this protein. Accordingly, high-fat-fed mice with a genetic loss of TRPM7 kinase activity displayed a marked glucose intolerance accompanied by hyperglycemia. These detrimental glucoregulatory effects were engendered by reduced compensatory β cell responses because of mitigated protein kinase B (AKT)/ERK signaling. Collectively, our data identify TRPM7 kinase as a potentially novel regulator of insulin synthesis, β cell dynamics, and glucose homeostasis under obesogenic diet.

Keywords: Beta cells; Cell Biology; Insulin; Ion channels.


Conflict of interest statement

Conflict of interest: TDM receives research funding from Novo Nordisk.

Figures

Figure 1
Figure 1. Tissue-specific TRPM7 deletion in β cells impairs glucose homeostasis and glucose-induced insulin secretion.
(A) Body weight development for 36 weeks (n = 6 mice per genotype) monitored in male βTrpm7-KO and control littermate mice on chow diet. (BD) For glucose tolerance test (GTT) mice were fasted overnight (n = 6 mice per genotype). Blood glucose levels (mg/dL) before and within 2 hours after i.p. injection of glucose (2 g/kg of body weight) in wild-type (WT) and βTrpm7-KO mice (left panels) and area under the curves (AUC in mg/dL × min; right panels) 4 (B), 16 (C), and 28 weeks (D) postrecombination. (E) Blood glucose (mg/dL) in freely fed (n = 6 per genotype) or fasted (n = 6 mice per genotype) and (F) plasma insulin levels (ng/mL) in freely fed (n = 6 mice per genotype) were measured in 36-week-old βTrpm7-KO and control littermate mice. (G) For insulin tolerance test (ITT) mice were fasted for 4 hours at the onset of the light cycle (n = 6 mice per genotype). Blood glucose levels (mg/dL) before and within 2 hours after i.p. injection of insulin (0.75 U/kg of body weight) in WT and βTrpm7-KO mice (left) and AUC (mg/dL × min; right). (H) Insulin secretion (ng/mL/h/8 islets) in isolated islets of male βTrpm7-KO and control littermate mice 4, 16, and 28 weeks postrecombination. Islets were incubated for 1 hour in the presence of low glucose and high glucose (n ≥ 3 mice per genotype, measured in duplicate). Data show means ± SEM, and statistical differences were assessed by 2-way ANOVA (B left–D left, and G left) or unpaired 2-tailed Student’s t test (B right–D right, E, F, G, right, H). Circles in bar graphs represent single values. P values are shown above the bars.
Figure 2
Figure 2. TRPM7 kinase disruption impairs glucose homeostasis and GIIS.
(A and B) Body weight at 8–9 weeks (n ≥ 14 mice per genotype) (A) and its development for 28 weeks (n = 10 mice per genotype) (B) monitored in male and female Trpm7R/R and control littermate mice on chow diet. (C and D) Blood glucose levels (mg/dL) before and within 2 hours after i.p. injection of glucose (2 g/kg of body weight) and in WT and Trpm7R/R mice (left panels) and area under the curve (AUC in mg/dL × min; right panels) at age 8–9 weeks (C) and 28 weeks (D). For glucose tolerance test (GTT) mice were fasted overnight (n = 16 mice per genotype (n ≥ 8 mice per genotype). (E and F) Blood glucose (mg/dL) in freely fed (n ≥ 8 per genotype) or fasted (n ≥ 8 mice per genotype) were measured in Trpm7R/R and control littermate mice at age 8–9 weeks (E) and 28 weeks (F). (G) Insulin secretion (ng/mL/h/8 islets) in isolated islets of male and female Trpm7R/R and control littermate mice at 8 weeks of age. Islets were incubated for 1 hour in the presence of low glucose (2.8 mM), high glucose (20 mM), 25 mM KCl or 300 μM tolbutamide (n ≥ 3 mice per genotype, measured in duplicate). Data show means ± SEM, and statistical differences were assessed by unpaired 2-tailed Student’s t test (A, C right, D right, EG) or 2-way ANOVA (C left, D left). Circles in bar graphs represent single values. P values are shown above the bars.
Figure 3
Figure 3. TRPM7 kinase disruption has no effect on glucose-induced Ca2+ responses.
(A) Intact WT (n = 42 cells, from 3 mice) and Trpm7R/R (n = 43, from 3 mice) islets were loaded with 4 μM fluo-4 AM, and alterations in [Ca2+]i of individual cells were monitored by confocal microscopy after increasing the extracellular glucose concentration from 2.8 to 20 mM and applying 300 μM tolbutamide. Ionomycin (5 μM) was used as a positive control. (B and C) Average of Ca2+ influx peaks assessed from baseline after glucose (B) and tolbutamide (C) stimulation in WT and Trpm7R/R β cells. The cells that displayed no increase in [Ca2+]i in response to high glucose concentration are excluded from the results. Data are given as mean ± SEM (circles in bar graphs represent single values), and statistical differences were assessed by unpaired 2-tailed Student’s t test (B and C).
Figure 4
Figure 4. TRPM7 kinase inactivation has no effect on TRPM7 current activity.
Whole-cell currents recorded from islet cells of WT (A, D, E, black trace, B) and Trpm7R/R mice (A, D, E, purple trace, C), using Mg2+-free pipette solution (buffered by 10 mM EDTA). (A) In- and outward current amplitudes at –80 mV (lower traces) and +80 mV (upper traces), extracted from whole-cell currents mediated by voltage ramps, applied at 0.5 Hz, spanning from –100 mV to 100 mV within 50 ms, in the absence of intracellular Mg2+ in WT and Trpm7R/R islet cells, plotted versus time. Divalent-free solution (DVF, buffered by EDTA) was applied from 600 to 660 seconds (bar). (B and C) Current-voltage relationships (IVs) of the minimal basic current (gray, light purple), the current at 600 seconds (black, purple, right before DVF) and in DVF solution (blue) in WT (B) and in Trpm7R/R islet cells (C). (D and E) IVs of the net current at 600 seconds (600 s net = current at 600 seconds minus basic current) and in DVF solution (DVF net = current in DVF minus basic current) in WT (black) and Trpm7R/R islet cells (purple). (F and G) Summary of the net current amplitudes at +80 mV from IVs at 600 seconds (600 s net; F) and in DVF solution (DVF net; G) in cells isolated from WT (black) and Trpm7R/R mice (purple). All currents were normalized to the cell capacitance (pA/pF). Data are plotted as means ± SEM (A, F, and G) or means (BE). Data are from 13 cells for WT and 12 cells for Trpm7R/R. Data are given as means ± SEM (circles in bar graphs represent single values), and statistical differences were assessed by unpaired 2-tailed Student’s t test (F and G).
Figure 5
Figure 5. Morphology of WT and Trpm7R/R pancreatic islets.
(A) Immunofluorescent insulin (INS, red) and glucagon (GCG, green) staining of pancreatic cryosections of WT and Trpm7R/R mice. Nuclei were stained with DAPI (blue) and scale bars represent 100 μm. (B) Number of islets per pancreatic cryosection (n = 140 slides, 3 mice per genotype) and (C) relative frequency plot of islet diameter comparing WT with Trpm7R/R islets (n = 140 slides, 3 mice per genotype). (D) Confocal images of WT and Trpm7R/R islets stained for insulin (β cells, red) and glucagon (α cells, green). Nuclei were stained with DAPI (blue) and scale bars represent 100 μm. (E) Quantification of the ratio of the number of β and α cells per pancreatic islet in WT and Trpm7R/R mice (n = 13, 3 mice per genotype). Data are given as means ± SEM (circles in bar graphs represent single values), and statistical differences were assessed by Mann-Whitney test (B) and unpaired 2-tailed Student’s t test (C and E).
Figure 6
Figure 6. TRPM7 kinase disruption impairs insulin production.
(A) Total insulin content of pooled WT versus Trpm7R/R islets. At least 40 groups of 10 size-matched WT and Trpm7R/R islets were compared. (B) Percentage of insulin content secreted from intact WT or Trpm7R/R islets after incubation with either low glucose (2.8 mM) or high glucose (20 mM) (n = 6 mice per genotype, measured in duplicate). (C and D) Western blot detection of the insulin in lysates of purified islets from WT and Trpm7R/R mice (n ≥ 5, 4 mice per genotype). Insulin was normalized to ERK2 as loading control. (E) Expression levels of Ins2, Pdx1, and MafA analyzed by qRT-PCR from RNAs isolated from pancreatic islet from WT and Trpm7R/R mice. (F and G) Western blot detection of the PDX1 in lysates of purified islets from WT and Trpm7R/R mice (n = 4, 4 mice per genotype). PDX1 was normalized to histone H3 as loading control. (H) Confocal images of WT and Trpm7R/R islets stained for DAPI (blue), insulin (green), PDX1 (red). The scale bar represents 100 μm. (I) Percentage of PDX1-positive cells from the population (100%) of insulin-positive cells per pancreatic islet in WT and Trpm7R/R mice (n = 8, 4 mice per genotype). Data are given as means ± SEM (circles in bar graphs represent single values), and statistical differences were assessed by Mann-Whitney test (A) or unpaired 2-tailed Student’s t test (B, D, E, G, and I). P values are shown above the bars.
Figure 7
Figure 7. TRPM7 kinase disruption impairs glucose homeostasis in obese mice.
Adult mice (Trpm7R/R and control littermates) maintained on an HFD for 16 weeks. (A) Cumulative food intake (n ≥ 6 mice per genotype), (B) body weight (n ≥ 14 mice per genotype), (C) blood glucose (mg/dL) in freely fed (n ≥ 14 mice per genotype) or fasted (n ≥ 12 mice per genotype), and (D) plasma insulin levels (ng/mL) in freely fed (n = 8 mice per genotype) or fasted (16 hours overnight) (n = 8 mice per genotype) in male and female Trpm7R/R and control littermate mice were measured. (E and F) Blood glucose levels (mg/dL) before and within 2 hours after i.p. injection of (E) glucose (2 g/kg of body weight) and (F) insulin (0.75 U/kg of body weight) in WT and Trpm7R/R mice (left panels) and area under the curves (AUC in mg/dL × min; right panels). For glucose tolerance test (GTT; E) mice were fasted overnight (n ≥ 20 mice per genotype) and for insulin tolerance test (ITT; F) mice were fasted for 4 hours at the onset of the light cycle (n ≥ 14 mice per genotype). Data show means ± SEM and statistical differences were assessed by unpaired 2-tailed Student’s t test (C, D, E right, and F right) or 2-way ANOVA (E and F, left panels). Circles in bar graphs represent single values. P values are shown above the bars.
Figure 8
Figure 8. TRPM7 kinase disruption reduces compensatory β cell responses due to a mitigated AKT/ERK signaling.
(A) Number of islets per pancreatic cryosection (n = 144 slides, 3 mice per genotype), (B) relative frequency plot of islet diameter comparing WT with Trpm7R/R islets (n = 144 slides, 6 mice per genotype). (C) Pancreas weight of WT and Trpm7R/R mice maintained on an HFD for approximately 16 weeks (n = 5 mice per genotype). (D) β Cell size (≥10 islets, at least 3 mice per genotype) and (E) percentage of Ki67-positive cells from the population (100%) of the insulin-positive cells per pancreatic islet in WT and Trpm7R/R mice under the chow or HFD for 16 weeks (n = 20, 5 mice per genotype). (F) Confocal images of WT and Trpm7R/R islets stained for DAPI (blue), insulin (green), and Ki67 (red). The scale bar represents 100 μm. (G) For RNA-Seq analysis, islet RNA was collected from Trpm7R/R mice and the control littermates that had been maintained on an HFD for approximately 16 weeks (n = 3 mice per genotype, age: ~24 weeks). Volcano plot with downregulated and upregulated genes. Differentially expressed genes (DEGs) were identified (P < 0.05) by using EdgeR method. DEGs are expressed as log2 fold change over control with an adjusted P value for each gene. (H) Assessment of the activity of the cell signaling molecules SMAD2, SMAD4, ERK1/2, and AKT using Bio-Plex assay and phospho-specific antibodies on lysates of isolated islets from WT and Trpm7R/R mice (n = 10, measured in duplicates, 10 mice per genotype) under 16 weeks of HFD. Data are normalized to Tubulin content. Data show means ± SEM and statistical differences were assessed by Mann-Whitney test (A) or unpaired 2-tailed Student’s t test (BE, and H). Circles in bar graphs represent single values. P values are shown above the bars.

Similar articles

Cited by

References

    1. Prentki M, Nolan CJ. Islet beta cell failure in type 2 diabetes. JCI Insight. 2006;116(7):1802–1812. doi: 10.1172/JCI29103. - DOI - PMC - PubMed
    1. Schmitz C, et al. Regulation of vertebrate cellular Mg2+ homeostasis by TRPM7. Cell. 2003;114(2):191–200. doi: 10.1016/S0092-8674(03)00556-7. - DOI - PubMed
    1. Mittermeier L, et al. TRPM7 is the central gatekeeper of intestinal mineral absorption essential for postnatal survival. Proc Natl Acad Sci U S A. 2019;116(10):4706–4715. doi: 10.1073/pnas.1810633116. - DOI - PMC - PubMed
    1. Pham PC, et al. Hypomagnesemia in patients with type 2 diabetes. Clin J Am Soc Nephrol. 2007;2(2):366–373. doi: 10.2215/CJN.02960906. - DOI - PubMed
    1. Rodríguez-Morán M, Guerrero-Romero F. Oral magnesium supplementation improves insulin sensitivity and metabolic control in type 2 diabetic subjects: a randomized double-blind controlled trial. Diabetes Care. 2003;26(4):1147–1152. doi: 10.2337/diacare.26.4.1147. - DOI - PubMed

Publication types