

Cell Phase Identification in a Three-Dimensional Engineered Tumor Model by Infrared Spectroscopic Imaging
- PMID: 36574385
- PMCID: PMC10214899
- DOI: 10.1021/acs.analchem.2c04554
Cell Phase Identification in a Three-Dimensional Engineered Tumor Model by Infrared Spectroscopic Imaging
Abstract
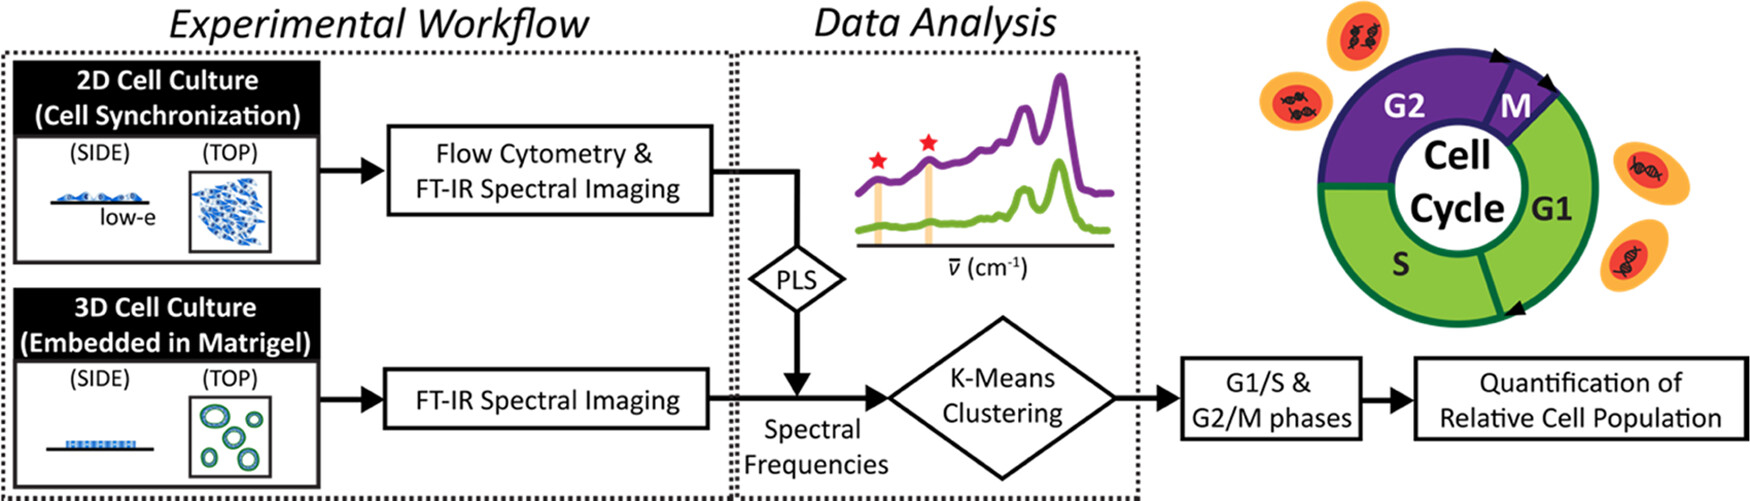
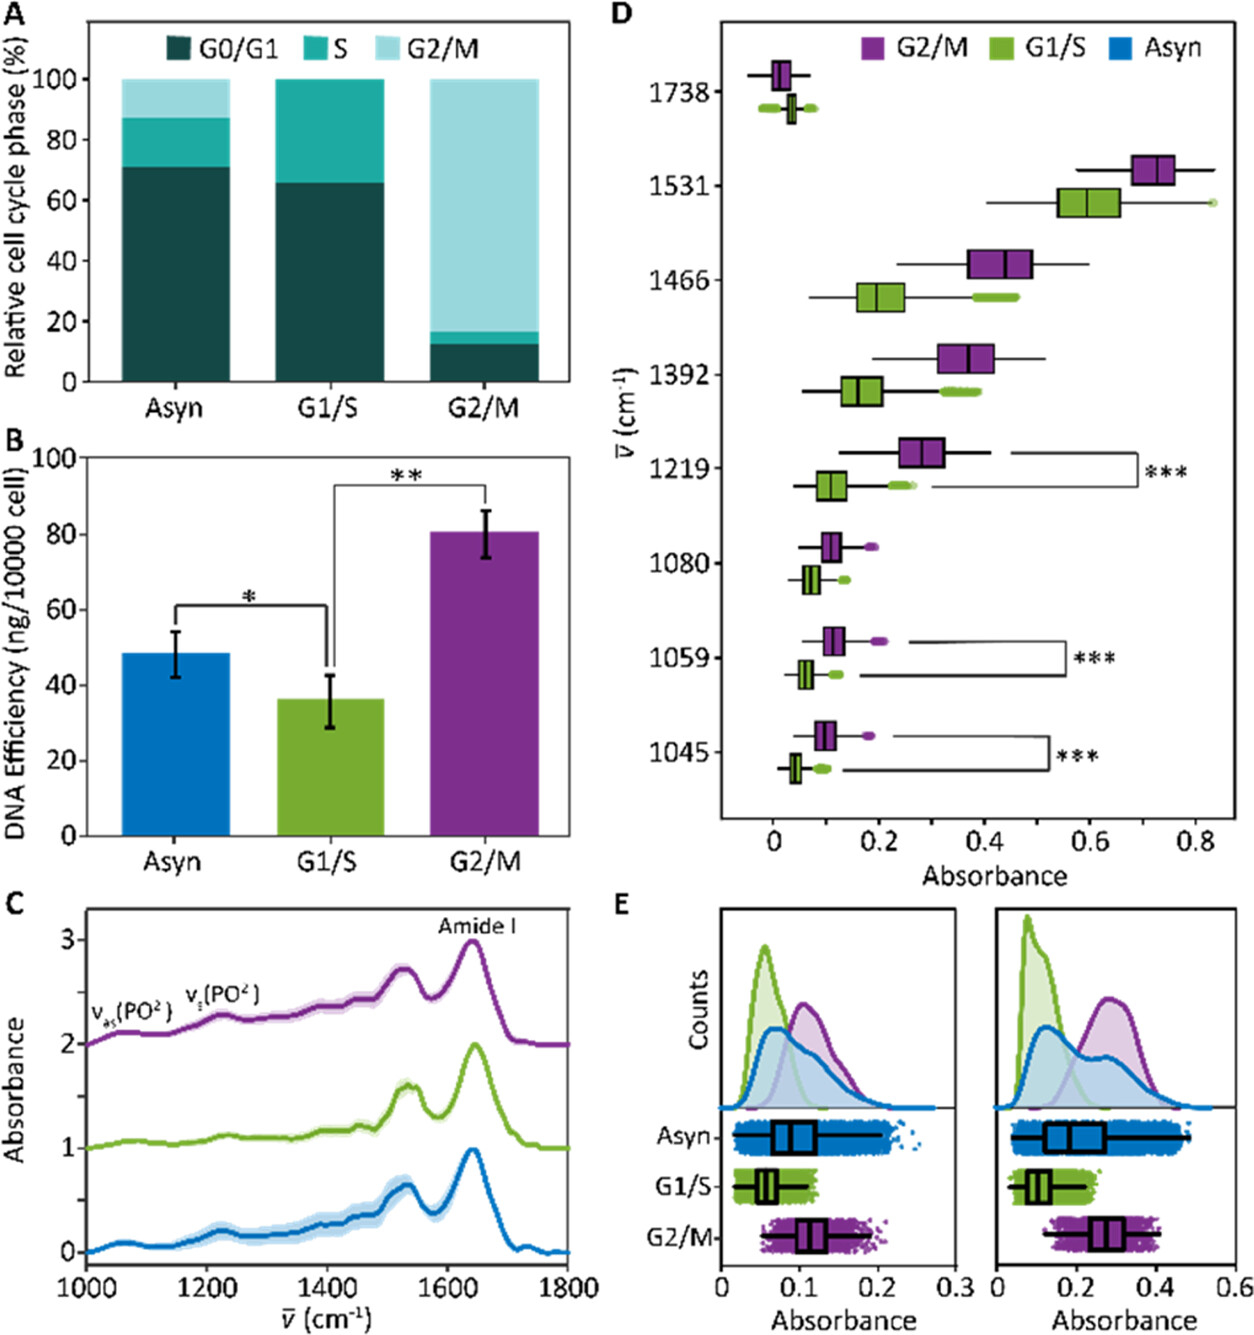
Cell cycle progression plays a vital role in regulating proliferation, metabolism, and apoptosis. Three-dimensional (3D) cell cultures have emerged as an important class of in vitro disease models, and incorporating the variation occurring from cell cycle progression in these systems is critical. Here, we report the use of Fourier transform infrared (FT-IR) spectroscopic imaging to identify subtle biochemical changes within cells, indicative of the G1/S and G2/M phases of the cell cycle. Following previous studies, we first synchronized samples from two-dimensional (2D) cell cultures, confirmed their states by flow cytometry and DNA quantification, and recorded spectra. We determined two critical wavenumbers (1059 and 1219 cm-1) as spectral indicators of the cell cycle for a set of isogenic breast cancer cell lines (MCF10AT series). These two simple spectral markers were then applied to distinguish cell cycle stages in a 3D cell culture model using four cell lines that represent the main stages of cancer progression from normal cells to metastatic disease. Temporal dependence of spectral biomarkers during acini maturation validated the hypothesis that the cells are more proliferative in the early stages of acini development; later stages of the culture showed stability in the overall composition but unique spatial differences in cells in the two phases. Altogether, this study presents a computational and quantitative approach for cell phase analysis in tissue-like 3D structures without any biomarker staining and provides a means to characterize the impact of the cell cycle on 3D biological systems and disease diagnostic studies using IR imaging.
Conflict of interest statement
The authors declare no competing financial interest.
Figures


Similar articles
-
Monitoring cell cycle distributions in MCF-7 cells using near-field photothermal microspectroscopy.Biophys J. 2005 May;88(5):3699-706. doi: 10.1529/biophysj.104.053926. Epub 2005 Feb 18. Biophys J. 2005. PMID: 15722424 Free PMC article.
-
Infrared spectroscopy of human tissue. V. Infrared spectroscopic studies of myeloid leukemia (ML-1) cells at different phases of the cell cycle.Biospectroscopy. 1999;5(4):219-27. doi: 10.1002/(SICI)1520-6343(1999)5:4<219::AID-BSPY2>3.0.CO;2-O. Biospectroscopy. 1999. PMID: 10478952
-
Fabrication and Characterization of a Three-Dimensional Fibrin Gel Model to Evaluate Anti-Proliferative Effects of Astragalus hamosus Plant Extract on Breast Cancer Cells.Asian Pac J Cancer Prev. 2022 Feb 1;23(2):731-741. doi: 10.31557/APJCP.2022.23.2.731. Asian Pac J Cancer Prev. 2022. PMID: 35225487 Free PMC article.
-
Opportunities for live cell FT-infrared imaging: macromolecule identification with 2D and 3D localization.Int J Mol Sci. 2013 Nov 19;14(11):22753-81. doi: 10.3390/ijms141122753. Int J Mol Sci. 2013. PMID: 24256815 Free PMC article. Review.
-
Spatial resolution in infrared microspectroscopic imaging of tissues.Biochim Biophys Acta. 2006 Jul;1758(7):814-29. doi: 10.1016/j.bbamem.2006.06.008. Epub 2006 Jun 9. Biochim Biophys Acta. 2006. PMID: 16875659 Review.
Cited by
-
Electrospun fibrillary scaffold for electrochemical cell biomarkers detection.Mikrochim Acta. 2024 Jun 29;191(7):435. doi: 10.1007/s00604-024-06523-w. Mikrochim Acta. 2024. PMID: 38949689 Free PMC article.
-
Vibrational spectroscopy unveils distinct cell cycle features of cancer stem cells in melanoma.Sci Rep. 2025 Aug 5;15(1):28494. doi: 10.1038/s41598-025-14018-8. Sci Rep. 2025. PMID: 40764735 Free PMC article.
References
-
- Diem M Modern Vibrational Spectroscopy and Micro-Spectroscopy: Theory, Instrumentation and Biomedical Applications; Wiley, 2015; pp 1–443.
-
- Petibois C; Déléris G Trends Biotechnol. 2006, 24, 455–462. - PubMed
-
- Holman H-YN; Bechtel HA; Hao Z; Martin MC Anal. Chem. 2010, 82, 8757–8765. - PubMed
-
- Finlayson D; Rinaldi C; Baker MJ Anal. Chem. 2019, 91, 12117–12128. - PubMed
Publication types
MeSH terms
Grants and funding
LinkOut - more resources
Full Text Sources
