. 2022 Dec 27;18(12):e1011039.
doi: 10.1371/journal.ppat.1011039. eCollection 2022 Dec.

Merkel cell polyomavirus small T antigen is a viral transcription activator that is essential for viral genome maintenance

Affiliations

Merkel cell polyomavirus small T antigen is a viral transcription activator that is essential for viral genome maintenance

Kyle Rapchak et al. PLoS Pathog. .

Abstract

Merkel cell polyomavirus (MCV) is a small DNA tumor virus that persists in human skin and causes Merkel cell carcinoma (MCC) in immunocompromised individuals. The multi-functional protein MCV small T (sT) activates viral DNA replication by stabilizing large T (LT) and promotes cell transformation through the LT stabilization domain (LTSD). Using MCVΔsT, a mutant MCV clone that ablates sT, we investigated the role of sT in MCV genome maintenance. sT was dispensable for initiation of viral DNA replication, but essential for maintenance of the MCV genome and activation of viral early and late gene expression for progression of the viral lifecycle. Furthermore, in phenotype rescue studies, exogenous sT activated viral DNA replication and mRNA expression in MCVΔsT through the LTSD. While exogenous LT expression, which mimics LT stabilization, increased viral DNA replication, it did not activate viral mRNA expression. After cataloging transcriptional regulator proteins by proximity-based MCV sT-host protein interaction analysis, we validated LTSD-dependent sT interaction with four transcriptional regulators: Cux1, c-Jun, BRD9, and CBP. Functional studies revealed Cux1 and c-Jun as negative regulators, and CBP and BRD9 as positive regulators of MCV transcription. CBP inhibitor A-485 suppressed sT-induced viral gene activation in replicating MCVΔsT and inhibited early gene expression in MCV-integrated MCC cells. These results suggest that sT promotes viral lifecycle progression by activating mRNA expression and capsid protein production through interaction with the transcriptional regulators. This activity is essential for MCV genome maintenance, suggesting a critical role of sT in MCV persistence and MCC carcinogenesis.


Conflict of interest statement

The authors have declared that no competing interests exist.

Figures
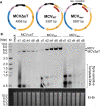
Fig 1
Fig 1. MCVΔsT cannot maintain its genome in transfected 293 cells.
(A) MCVΔsT with a deletion of sT-specific exon (dotted line in wild type MCV), wild type MCV (MCVWT), and MCVrep- with an NCCR mutation that ablates LT binding to the origin. (B) 293 cells transfected with MCVWT, MCVΔsT, and MCVrep- were harvested at various time points up to 8 days p.t. Extracted genomic DNA was digested with EcoRI and DpnI and subjected to Southern blot with an MCV probe. Ethidium bromide (Et-Br) staining was used as a loading control (bottom image). M denotes DNA size marker.
Fig 2
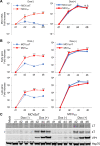
Fig 2. Exogenous sT expression rescues viral DNA replication and mRNA expression in MCVΔsT.
MCVWT and MCVΔsT viral DNAs were transfected into TRE-sT cells seeded for a 6-day time course experiment. Cells were harvested 24 h p.t. and the remaining cells were treated with or without doxycycline (Dox) at day 1 (0.5 μg/mL) and paired samples were harvested at day 2, day 4, and day 6 p.t.. Time kinetics in DNA replication, gene expression, and protein expression in both MCVWT (red lines) and MCVΔsT (blue lines) were analyzed. Unpaired T-test was used for statistical analysis. *, P<0.05; **, P<0.01; ***, P<0.001. (A) Extracted genomic DNAs were digested with DpnI and EcoRI and subjected to qPCR using primer sets detecting MCV VP2 and GAPDH genes. Relative MCV DNA copy number to the day 1 sample was determined by the 2-ΔΔCt method using GAPDH for normalization. (B) RNA was extracted and used to synthesize cDNA for qRT-PCR to determine early and late gene mRNA expression levels using MCV PanT and VP2 (set 1) primer pairs, respectively. Dotted lines represent Dox- condition while solid lines show Dox+ condition. Primers used in each experiment are listed in S1 Table. Relative MCV DNA copy number and early and late gene levels to the day 1 sample were determined by the 2-ΔΔCt method using 18S RNA for normalization. (C) Protein was extracted and subjected to an immunoblot showing LT, sT, and VP1 expression levels. Immunoblots were stained with LT (CM2B4), sT (2T2) and VP1 (CM9B2) antibodies with Hsp70 antibody as a loading control. Asterisk (*) indicates non-specific band.
Fig 3
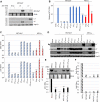
Fig 3. Mapping of sT domain required for viral genome maintenance.
(A) MCVΔsT DNA was transfected into 293 TRE-Emp, sT, and LT cells and harvested at day 6 p.t.. gDNA was digested with EcoRI and DpnI and run on a Southern blot showing the effect of exogenous pcDNA sT and LT on MCVΔsT DNA replication. Immunoblot shown below was performed to confirm expression of exogenous sT and LT levels. (B-D) 293 cells were co-transfected with MCVWT (red) or MCVΔsT (blue) and various pcDNA6 sT mutants including pcDNA Empty (Emp). Cells were then harvested at day 4 p.t.. (B) qPCR was performed as described in Fig 2A legend. To determine the effect of sT, sT mutants, and LT on MCVΔsT and MCVWT replication, MCV DNA levels, relative to the control sample (MCVΔsT co-transfected with pcDNA Empty), were analyzed by 2-ΔΔCt method. Solid bar graphs represent viral DNA. Unpaired T-test was used for statistical analysis. Significance was determined in comparison to MCVΔsT co-transfected with pcDNA6 sTWT. *, P<0.05; **, P<0.01; ***, P<0.001. (C) RNA was extracted and converted to cDNA for qRT-PCR analysis to determine early and late gene expression as described in Fig 2B legend. Relative early and late mRNA expression to the same control in Fig 3B was determined by the 2-ΔΔCt method. Hatched bar graphs represent viral mRNA expression. (D) Corresponding protein levels shown on an immunoblot stained with MCV proteins (LT, sT, VP1) of each sample. Hsp70 was used as an internal control. A closed arrowhead indicates LT protein, and asterisk (*) designates nonspecific band. (E) 293 cells were transfected with MCTWT, MCVΔsT, MCVrep-, and two MCV mutants with different LTSD mutations (MCV.sTLTSD and MCV.sT90-94A) and harvested day 4 p.t. for Southern blot using an MCV probe. The same samples were analyzed by qPCR to quantitate MCV DNA levels as in Fig 3B. Relative MCV DNA abundance to MCVWT is shown. (F) With the same samples used in Fig 3E, total RNA was extracted and converted to cDNA for qRT-PCR analysis of early and late gene expression as in Fig 3C. Relative early and late gene expression to MCVWT is shown. All error bars indicate standard error of three independent experiments.
Fig 4
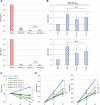
Fig 4. sT requires viral DNA replication for an efficient activation of viral gene expression.
(A) 293 cells transfected with MCVWT, MCVΔsT, and their rep- counterparts were harvested at day 4. Total extracted RNA was subjected to qRT-PCR analysis by the 2-ΔΔCt method with 18S ribosomal RNA for normalization. Relative mRNA expression to the MCVWT-transfected sample is shown. Error bars indicate SD. (B) 293 cells co-transfected with MCVΔsTrep- and either pcDNA empty (Emp), pcDNA sTWT, or LTSD mutants (pcDNA sT90-94A and pcDNA sTLTSD) were harvested at day 4. Early and late gene expression was determined as in Fig 4A. Relative mRNA expression to the pcDNA6 empty co-transfected sample is shown. (C) 293 TRE-sT cells that can inducibly express sT by doxycycline were transfected with MCVΔsT in 13 dishes. At day 1 p.t., cells in one dish were harvested and doxycycline (0.5 μg/mL), DNA inhibitors (5 μM aphidicolin (APC) and 400 μM mimosine (Mimo)), and water (for mock) were added to the other 12 dishes. The remaining cells were harvested at day 2 and 4 p.t. To examine viral DNA replication, qPCR was performed, as described in the Fig 2A legend. (D) Using the same samples as in Fig 4C, RNA was extracted and converted to cDNA for qRT-PCR analysis, as described in the Fig 2B legend, to determine early and late gene expression.
Fig 5
Fig 5. sT regulates VP1 expression in infected permissive cells.
(A) Production of MCVΔsT and MCVWT virions in transfected 293 TRE-sT cells with sT protein induction. Thirteen fractions from MCVΔsT- and MCVWT-transfected 293 TRE-sT cell lysates sedimented by Opti-prep (1~13 from lighter to heavier) demonstrate similar virion packaging efficiency in fractions 11~13 between MCVWT and MCVΔsT according to VP1 protein expression and genome copy numbers from the pooled fractions (fractions 11~13). VP1 protein was detected by CM9B2 by immunoblot, and absolute MCV genome copy number was determined by qPCR with a VP2 primer (set 1) pair. *VP1 dimer protein. (B) BJ.hTERT cells were infected with 106 per cell genome copies of MCVΔsT and MCVWT and harvested over a time period of 15 days after the addition of serum on day 3 post infection (top panel). qPCR was performed on genomic DNA using the 2-ΔΔCt method with GAPDH for normalization. A relative MCV DNA abundance to the day 3 post-MCV-infected sample indicates the inability of MCVΔsT to maintain the viral genome. Significance was determined by unpaired T test in comparison between MCVΔsT and MCVWT within the same date point *, P<0.05; **, P<0.01; ***, P<0.001. (C) Exogenous sT rescues VP1 protein expression in MCVΔsT infected cells. BJ.hTERT TRE-Emp and TRE-sT cells infected with MCVΔsT and MCVWT were treated with doxycycline at day 5 p.t. to induce exogenous sT expression. Cells were harvested at day 8 for immunofluorescence with VP1 antibody. (D) Doxycycline (Dox) rescues VP1 expression in the MCVΔsT mutant to levels greater than that of MCVWT. VP1 positive cells were counted to determine % positivity.
Fig 6
Fig 6. Identification of LTSD-dependent MCV sT proxisome by Bio-ID.
(A) sT fusion with biotin-ligase BirA does not alter the function of sT. Prior to Bio-ID analysis, 293 TRE-sTWT-BirA, 293 TRE-sTLTSD-BirA, and 293 TRE-Emp-BirA cells were transfected with MCVΔsT, induced by doxycycline and harvested at day 4 p.t. qPCR with VP2 and GAPDH primers confirmed that MCV replication is still activated by sTWT-BirA, but not by TRE sTLTSD-BirA. Error bars indicate SD. (B) Host protein biotinylation is induced by sT-BirA fusion proteins only in the presence of biotin. Host cell biotinylation (top panel) and expression of sT-BirA fusion proteins (bottom panel). sT protein expression was confirmed by streptavidin and sT (2T2) immunoblots in sTWT-BirA, sTLTSD-BirA, and Emp-BirA cells after doxycycline and biotin treatment. (C) The flow chart of Bio-ID data analysis and Venn diagram summary of the distribution of related proteins identified by Bio-ID. 301 total proteins were identified as candidates for the sTWT and sTLTSD proxisome by the Bio-ID study. 57.1% were unique to sTWT, 6.3% were unique to sTLTSD, and 36.6% were common to both sTWT and sTLTSD. (D) Gene ontology analysis for the sT proxisome identified by Bio-ID. The 172 unique to wild type sT interactors and the 110 interactors common to both wild type and the LTSD mutant as identified by the Bio-ID approach were included in the analysis. Proteins were analyzed using the PANTHER gene ontology software. Interactors were separated into 19 protein classes. (E) Summary of sT interactors identified as chromatin binding and transcription regulator proteins by the PANTHER software to use for further confirmational studies. Bolded proteins indicate proteins unique to sTWT. Underlined proteins were selected for further confirmational studies.
Fig 7
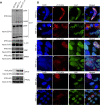
Fig 7. Validation of sT protein interaction with chromatin binding and gene-specific transcription factor proteins identified by Bio-ID.
(A) Confirmation of LTSD-dependent direct sTWT interaction with Cux1, c-Jun, CBP, and BRD9 by immunoprecipitation (IP). N-terminally SF-tagged (NSF) NSF-sTWT and NSF-sTLTSD cell lysates were immunoprecipitated with FLAG Ab. 2.5% of IP lysate was used as input. SF-sT was pulled down to confirm equal precipitation of sTWT and sTLTSD. PP2Ac, which interacts with both sTWT and sTLTSD, was used as a positive control. (B) MCVΔsT transfected 293 TRE NSF-sTWT and NSF-sTLTSD cells were treated with Dox at day 1 p.t. and harvested day 4 p.t. for immunofluorescence. Cells were co-stained with antibodies against FLAG sT (red, Alexa 488) and either Cux1, c-Jun, or CBP (green, Alexa 568), and images were captured by confocal microscopy. Magnification 100x. Arrowheads designate sT-positive mitotic cells. White bars on DAPI images indicate 10 μm.
Fig 8
Fig 8. Role of sT-interacting proteins in MCV transcription and viral replication.
(A) Effect of siRNA knockdown of sT interactors on viral gene expression in MCVWT. siRNA treatment of MCVWT samples. In cells treated with siCux1.1, siCux1.2, sic-Jun.1, and sic-Jun.2, early and late gene expression increases relative to the siCtrl. In cells treated with siCBP.2 and siBRD9.2, early and late gene expression decreases. Total RNA was subjected to qRT-PCR analysis by the 2-ΔΔCt method using VP2 (set 1) and PanT primer pairs with 18S ribosomal RNA for normalization. Error bars indicate SD. Unpaired T-test was used for statistical analysis to determine the significance relative to siCtrl. *, P<0.05; **, P<0.01; ***, P<0.001. (B) A-485 and I-BRD9 treatment of MCVΔsT transfected with empty or sT. A-485 treatment significantly decreases early and late gene expression at 1.0, 5.0, and 10.0 μM in MCVΔsT transfected with sT. I-BRD9 treatment at 0.5 and 2.0 μM also significantly decreases early and late gene expression. Total extracted RNA was subjected to qRT-PCR analysis as described in Fig 8A. Relative mRNA expression to the sTWT-transfected sample is shown. Error bars indicate SD. Unpaired T-test was used for statistical analysis. *, P<0.05; **, P<0.01; ***, P<0.001.
Fig 9
Fig 9. CBP regulates T antigen expression in MCV-positive MCC.
(A) CBP/p300 inhibitor, A-485, significantly decreases early gene expression. MCV-positive CVG-1, MKL-1, MS-1, and BroLi cell lines were treated with various concentrations of A-485 and harvested at day 4. Total extracted RNA was subjected to qRT-PCR analysis by the 2-ΔΔCt method using the PanT primer with 18S ribosomal RNA for normalization. Relative mRNA expression to the mock-treated sample is shown for each respective cell line. Error bars indicate SD. Unpaired T-test was used for statistical analysis. *, P<0.05; **, P<0.01; ***, P<0.001. (B) Corresponding immunoblots for qRT-PCR shown in Fig 9A. MCV LT was detected by CM2B4. H3K18ac and total H3 were detected to confirm A-485 activity. HSP70 was used as a loading control.
Fig 10
Fig 10. Importance of two MCV replication phases for sT function.
Replication initiation phase, including early gene expression, LT production, and initial viral origin replication, does not require sT function, but activates sT. In the maintenance phase of replication, sT regulates viral transcription targeting factors such as Cux1, c-Jun, and CBP as well as DNA replication by stabilizing LT [11]. Maintenance of LT stability and early gene expression may control genome maintenance. Late gene induction that results in viral capsid assembly progresses viral life cycle and may also control genome maintenance via viral miRNA expression [21].

Similar articles

Cited by

References

    1. Feng H, Shuda M, Chang Y, Moore PS. Clonal integration of a polyomavirus in human Merkel cell carcinoma. Science. 2008;319(5866):1096–100. doi: 10.1126/science.1152586 ; PubMed Central PMCID: PMC2740911. - DOI - PMC - PubMed
    1. Schowalter RM, Pastrana DV, Pumphrey KA, Moyer AL, Buck CB. Merkel cell polyomavirus and two previously unknown polyomaviruses are chronically shed from human skin. Cell Host Microbe. 2010;7(6):509–15. Epub 2010/06/15. doi: 10.1016/j.chom.2010.05.006 ; PubMed Central PMCID: PMC2919322. - DOI - PMC - PubMed
    1. Shuda M, Feng H, Kwun HJ, Rosen ST, Gjoerup O, Moore PS, et al.. T antigen mutations are a human tumor-specific signature for Merkel cell polyomavirus. Proc Natl Acad Sci U S A. 2008;105(42):16272–7. doi: 10.1073/pnas.0806526105 ; PubMed Central PMCID: PMC2551627. - DOI - PMC - PubMed
    1. Houben R, Shuda M, Weinkam R, Schrama D, Feng H, Chang Y, et al.. Merkel cell polyomavirus-infected Merkel cell carcinoma cells require expression of viral T antigens. J Virol. 2010;84(14):7064–72. doi: 10.1128/JVI.02400-09 ; PubMed Central PMCID: PMC2898224. - DOI - PMC - PubMed
    1. Shuda M, Kwun HJ, Feng H, Chang Y, Moore PS. Human Merkel cell polyomavirus small T antigen is an oncoprotein targeting the 4E-BP1 translation regulator. J Clin Invest. 2011;121(9):3623–34. doi: 10.1172/JCI46323 ; PubMed Central PMCID: PMC3163959. - DOI - PMC - PubMed

Publication types