. 2023 Jan 3;120(1):e2208525120.
doi: 10.1073/pnas.2208525120. Epub 2022 Dec 27.

SARS-CoV-2 accessory proteins ORF7a and ORF3a use distinct mechanisms to down-regulate MHC-I surface expression

Affiliations

SARS-CoV-2 accessory proteins ORF7a and ORF3a use distinct mechanisms to down-regulate MHC-I surface expression

Najla Arshad et al. Proc Natl Acad Sci U S A. .

Abstract

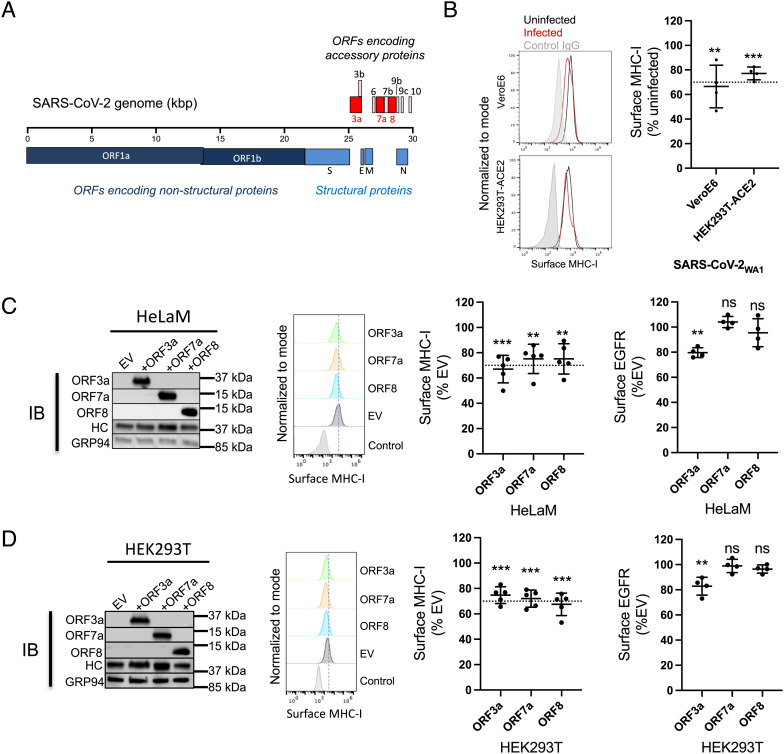
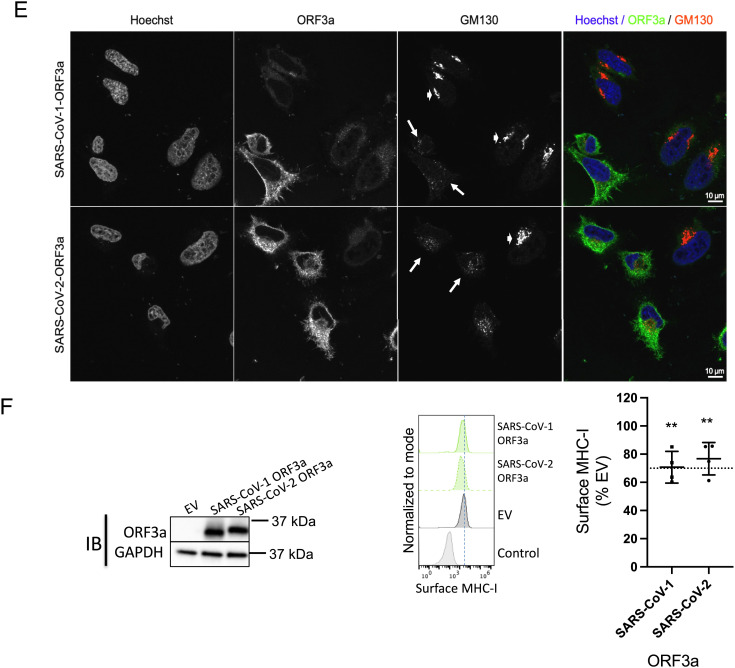
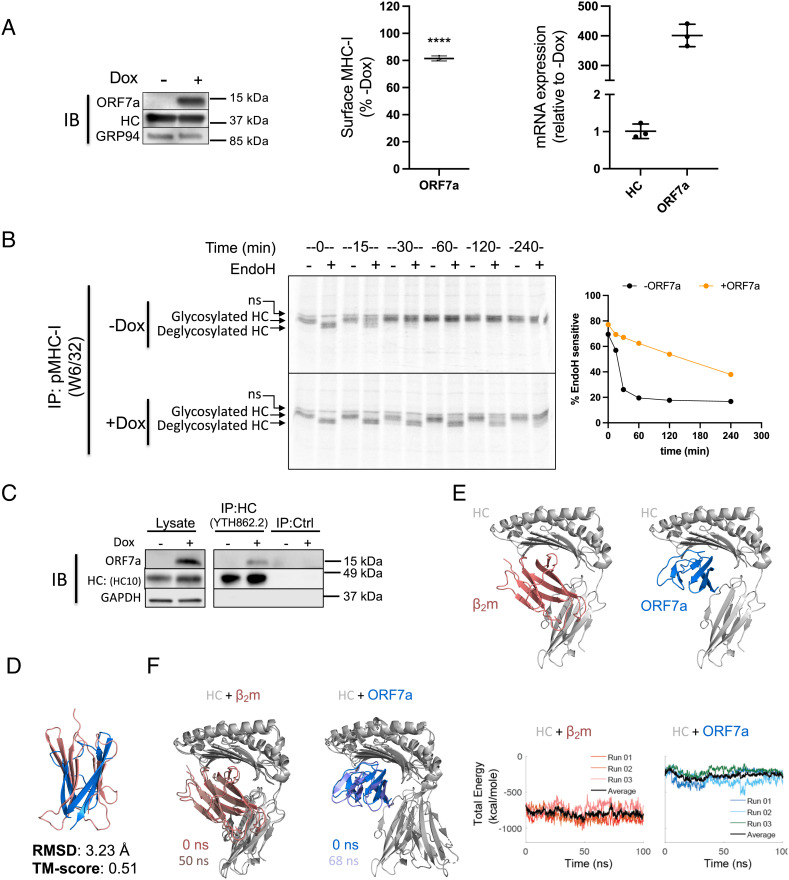
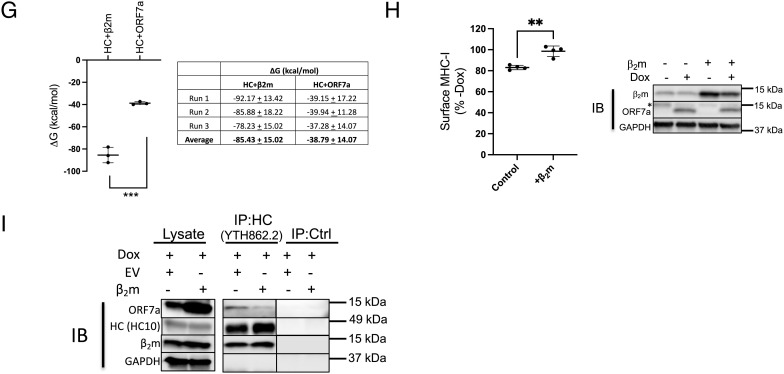
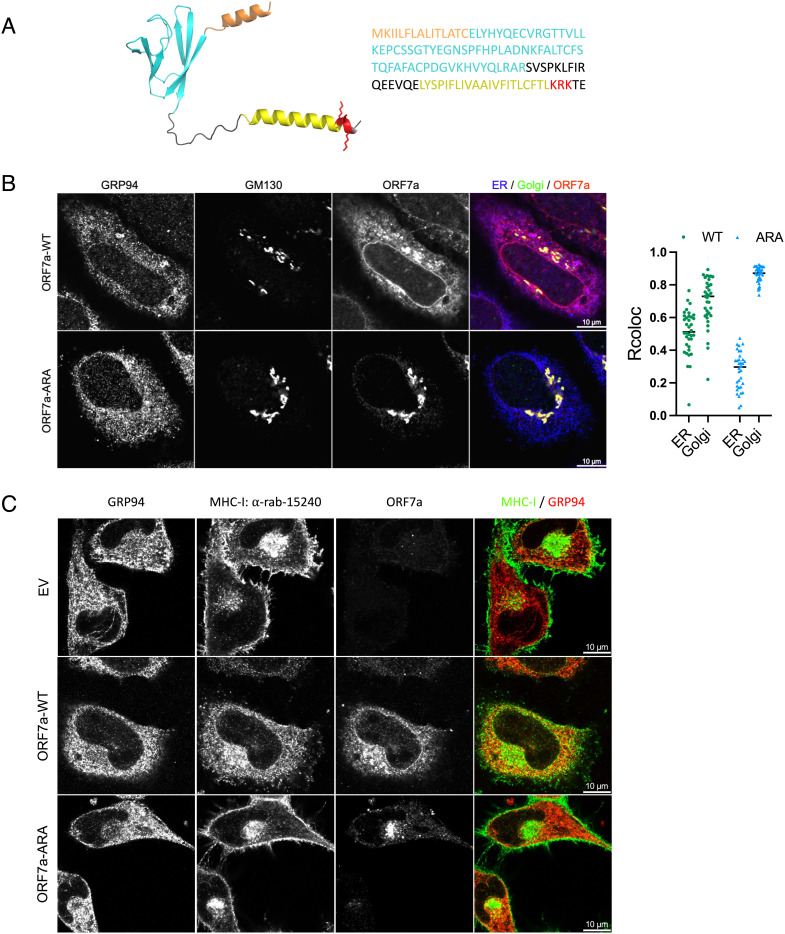
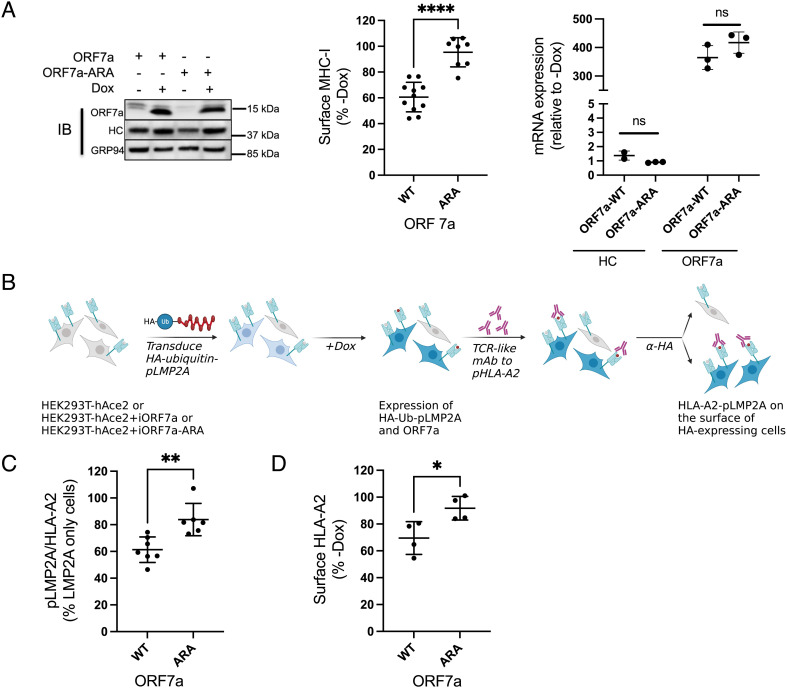
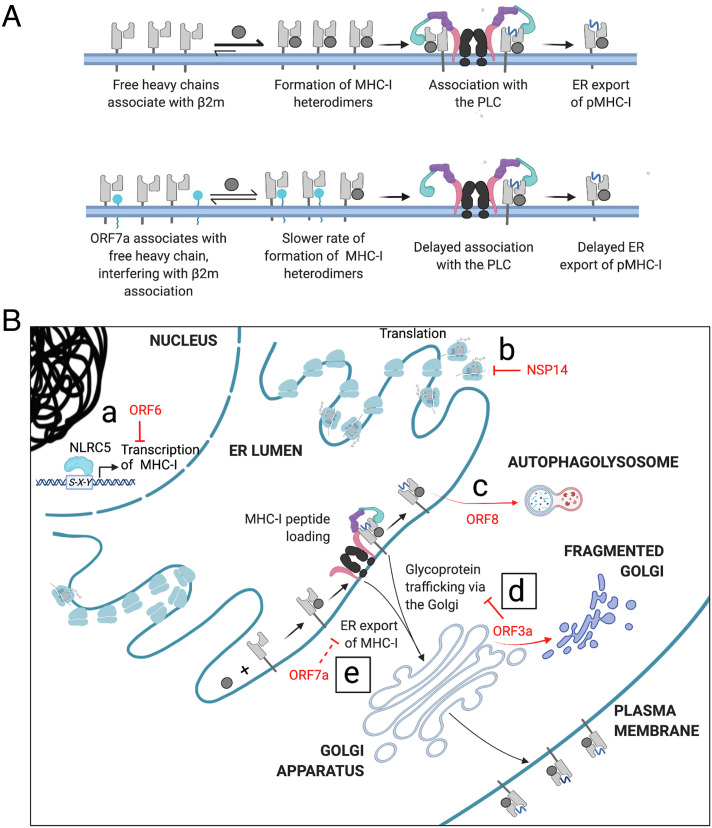
Major histocompatibility complex class I (MHC-I) molecules, which are dimers of a glycosylated polymorphic transmembrane heavy chain and the small-protein β2-microglobulin (β2m), bind peptides in the endoplasmic reticulum that are generated by the cytosolic turnover of cellular proteins. In virus-infected cells, these peptides may include those derived from viral proteins. Peptide-MHC-I complexes then traffic through the secretory pathway and are displayed at the cell surface where those containing viral peptides can be detected by CD8+ T lymphocytes that kill infected cells. Many viruses enhance their in vivo survival by encoding genes that down-regulate MHC-I expression to avoid CD8+ T cell recognition. Here, we report that two accessory proteins encoded by SARS-CoV-2, the causative agent of the ongoing COVID-19 pandemic, down-regulate MHC-I expression using distinct mechanisms. First, ORF3a, a viroporin, reduces the global trafficking of proteins, including MHC-I, through the secretory pathway. The second, ORF7a, interacts specifically with the MHC-I heavy chain, acting as a molecular mimic of β2m to inhibit its association. This slows the exit of properly assembled MHC-I molecules from the endoplasmic reticulum. We demonstrate that ORF7a reduces antigen presentation by the human MHC-I allele HLA-A*02:01. Thus, both ORF3a and ORF7a act post-translationally in the secretory pathway to lower surface MHC-I expression, with ORF7a exhibiting a specific mechanism that allows immune evasion by SARS-CoV-2.

Keywords: SARS-CoV-2; antigen processing; immune evasion; molecular mimicry.


Conflict of interest statement

The authors have organizational affiliations to disclose, Debrup Sengupta, now an employee of Corner Therapeutics, Cambridge, MA.

Figures

Fig. 1.
Fig. 1.
Downregulation of MHC-I by SARS-CoV-2 WA1 and its ER-localized gene products. (A) Genome organization of SARS-CoV-2. SARS-CoV-2 accessory proteins are depicted at the 3′ end of the genome. ORF3a, ORF7a, and ORF8 are highlighted in red. (B) Vero E6 or HEK293T-Ace2 cells were infected with SARS-CoV-2WA1 (MOI = 10). 24 h post infection, cells were collected for flow cytometry analysis for surface MHC-I (n = 4). Histograms (Left) are summarized (Right) where mean fluorescence intensity of MHC-I staining with W6/32 was normalized to uninfected group. (C) Transient expression of ORF3a, ORF7a, and ORF8 in HeLaM cells. Western Blot analysis of expression of accessory proteins, MHC-I heavy chain (HC), or GRP94 as a loading control, 24 h post transfection (Left). Flow cytometric analysis of surface MHC-I (Middle) and EGFR (Right) in cells expressing ORF3a, ORF7a, and ORF8 in HeLaM cells (n = 4). (D) Transient expression of ORF3a, ORF7a, and ORF8 in HEK293T cells. Western Blot analysis of expression of accessory proteins, MHC-I heavy chain (HC), or GRP94 as a loading control 24 h post transfection (Left). Flow cytometric analysis of surface MHC-I (Middle) and EGFR (Right) in cells expressing ORF3a, ORF7a, and ORF8 in HEK293T cells (n = 4). (E) Effect of ORF3a on the Golgi morphology. HeLaM cells were transfected with plasmids encoding SARS-CoV-1 ORF3a or SARS-CoV-2 ORF3a for 24 h. Fixed cells were stained with Hoechst (blue), for ORF3a (green), and anti-GM130 to visualize the Golgi (red). (F) HelaM cells were transfected with plasmids encoding SARS-CoV-ORF3a or SARS-CoV-2-ORF3a for 24 h, followed by analysis of expression by western blotting (Left) or flow cytometric analysis of surface MHC-I (Right, n = 4). Quantitative data shown are mean ± SD (error bars), and the dashed line indicates the 70% mark. Statistical significance was evaluated using the unpaired Student’s t test; *P < 0.05; **P < 0.01; ***P < 0.001; ****P < 0.0001; ns, not significant.
Fig. 1.
Fig. 1.
Downregulation of MHC-I by SARS-CoV-2 WA1 and its ER-localized gene products. (A) Genome organization of SARS-CoV-2. SARS-CoV-2 accessory proteins are depicted at the 3′ end of the genome. ORF3a, ORF7a, and ORF8 are highlighted in red. (B) Vero E6 or HEK293T-Ace2 cells were infected with SARS-CoV-2WA1 (MOI = 10). 24 h post infection, cells were collected for flow cytometry analysis for surface MHC-I (n = 4). Histograms (Left) are summarized (Right) where mean fluorescence intensity of MHC-I staining with W6/32 was normalized to uninfected group. (C) Transient expression of ORF3a, ORF7a, and ORF8 in HeLaM cells. Western Blot analysis of expression of accessory proteins, MHC-I heavy chain (HC), or GRP94 as a loading control, 24 h post transfection (Left). Flow cytometric analysis of surface MHC-I (Middle) and EGFR (Right) in cells expressing ORF3a, ORF7a, and ORF8 in HeLaM cells (n = 4). (D) Transient expression of ORF3a, ORF7a, and ORF8 in HEK293T cells. Western Blot analysis of expression of accessory proteins, MHC-I heavy chain (HC), or GRP94 as a loading control 24 h post transfection (Left). Flow cytometric analysis of surface MHC-I (Middle) and EGFR (Right) in cells expressing ORF3a, ORF7a, and ORF8 in HEK293T cells (n = 4). (E) Effect of ORF3a on the Golgi morphology. HeLaM cells were transfected with plasmids encoding SARS-CoV-1 ORF3a or SARS-CoV-2 ORF3a for 24 h. Fixed cells were stained with Hoechst (blue), for ORF3a (green), and anti-GM130 to visualize the Golgi (red). (F) HelaM cells were transfected with plasmids encoding SARS-CoV-ORF3a or SARS-CoV-2-ORF3a for 24 h, followed by analysis of expression by western blotting (Left) or flow cytometric analysis of surface MHC-I (Right, n = 4). Quantitative data shown are mean ± SD (error bars), and the dashed line indicates the 70% mark. Statistical significance was evaluated using the unpaired Student’s t test; *P < 0.05; **P < 0.01; ***P < 0.001; ****P < 0.0001; ns, not significant.
Fig. 2.
Fig. 2.
ORF7a slows the export of MHC-I from the ER by interacting with the heavy chain of MHC-I. (A) Stable expression of a doxycycline (Dox)-inducible construct of ORF7a in HeLaM cells was verified in uninduced and induced (+Dox for 24 h) cells by western blotting (Left), and the effect on surface MHC-I was assayed by flow cytometry (Middle, n = 3). MHC-I and ORF7a mRNA levels were assessed by qPCR and relative expression was normalized to uninduced (−Dox) cells (n = 3). (B) Uninduced (-Dox, Upper panel) or induced (+Dox for 24 h, Lower) cells were labeled with [35S]Met for 15 min followed by immunoprecipitation of MHC-I complexes from the lysates at the indicated time points of chase, followed by treatment with Endoglycosidase H (EndoH). Samples were visualized after separation on nonreducing SDS-polyacrylamide gels by autoradiography, and the intensity of the EndoH sensitive heavy chain relative to total heavy chain overtime has been plotted (Right). (C) Interaction between ORF7a and MHC-I was assessed by immunoprecipitation of total heavy chain (free and complexed) from uninduced or induced (+Dox for 24 h) cells lysed in digitonin using normal IgG as a control (IP:Ctrl) or α-HLA-A/B/C, clone YTH862.2 (IP: HC:YTH862.2), followed by western blot analysis to detect ORF7a, MHC-I heavy chain (HC), or GAPDH as loading control. (D) Structural analysis of ORF7a and MHC-I. Alignment of the crystal structures human β2m in red (PDBID: 2D4F) and SARS-CoV-2 ORF7a in blue (PDBID: 6W37); the rmsd and TM-Score (template modeling score) are also reported. (E) Cartoon representations of the crystal structure of HLA-A2 (gray) in complex with β2m (red) (Left) and the predicted structure of HLA-A2 (gray) complexed with ORF7a (blue) as modeled by ClusPro. (F) Cartoon representations showing a comparison of the original (0 ns) and a low-energy conformer obtained from MD simulation runs (run 01, 50 ns for HC+β2m and run 02, 68 ns HC + ORF7a). Graphs represent total energies (van der Waal + electrostatic) of the HC+β2m (red, Left) and HC+ORF7a (blue, Right) complexes over the course of three independent MD simulation runs. Average energies are shown in black in each case. (G) Plot of the free energy changes of binding (ΔG) of the HC+β2m and HC+ORF7a complexes. (H) HeLaM-iORF7a cells were transiently transfected with control plasmid or plasmid encoding human β2m for 8 h, followed by the induction of ORF7a expression (+Dox for 24 h) and effect on surface MHC-I was assayed by flow cytometry (Left, n = 3). Expression of ORF7a and β2m was assessed by western blotting, with GAPDH as loading control (Right). (I) Interaction between ORF7a and MHC-I in the presence of overexpressed human β2m was assessed by coimmunoprecipitation analysis. Human β2m or empty vector was transiently transfected into HeLaM-iORF7a cells followed by the induction of ORF7a expression for 24 h. Cells lysates were prepared in 1% digitonin and immunoprecipitation using normal IgG as a control (IP:Ctrl) or α-HLA-A/B/C, clone YTH862.2 (IP: HC: YTH862.2) was carried out, followed by western blot analysis to detect ORF7a, MHC-I heavy chain (HC), β2m, or GAPDH as loading control. Quantitative data shown are mean ± SD (error bars). Statistical significance was evaluated using the unpaired Student’s t test; *P < 0.05; **P < 0.01; ***P < 0.001; ns, not significant.
Fig. 2.
Fig. 2.
ORF7a slows the export of MHC-I from the ER by interacting with the heavy chain of MHC-I. (A) Stable expression of a doxycycline (Dox)-inducible construct of ORF7a in HeLaM cells was verified in uninduced and induced (+Dox for 24 h) cells by western blotting (Left), and the effect on surface MHC-I was assayed by flow cytometry (Middle, n = 3). MHC-I and ORF7a mRNA levels were assessed by qPCR and relative expression was normalized to uninduced (−Dox) cells (n = 3). (B) Uninduced (-Dox, Upper panel) or induced (+Dox for 24 h, Lower) cells were labeled with [35S]Met for 15 min followed by immunoprecipitation of MHC-I complexes from the lysates at the indicated time points of chase, followed by treatment with Endoglycosidase H (EndoH). Samples were visualized after separation on nonreducing SDS-polyacrylamide gels by autoradiography, and the intensity of the EndoH sensitive heavy chain relative to total heavy chain overtime has been plotted (Right). (C) Interaction between ORF7a and MHC-I was assessed by immunoprecipitation of total heavy chain (free and complexed) from uninduced or induced (+Dox for 24 h) cells lysed in digitonin using normal IgG as a control (IP:Ctrl) or α-HLA-A/B/C, clone YTH862.2 (IP: HC:YTH862.2), followed by western blot analysis to detect ORF7a, MHC-I heavy chain (HC), or GAPDH as loading control. (D) Structural analysis of ORF7a and MHC-I. Alignment of the crystal structures human β2m in red (PDBID: 2D4F) and SARS-CoV-2 ORF7a in blue (PDBID: 6W37); the rmsd and TM-Score (template modeling score) are also reported. (E) Cartoon representations of the crystal structure of HLA-A2 (gray) in complex with β2m (red) (Left) and the predicted structure of HLA-A2 (gray) complexed with ORF7a (blue) as modeled by ClusPro. (F) Cartoon representations showing a comparison of the original (0 ns) and a low-energy conformer obtained from MD simulation runs (run 01, 50 ns for HC+β2m and run 02, 68 ns HC + ORF7a). Graphs represent total energies (van der Waal + electrostatic) of the HC+β2m (red, Left) and HC+ORF7a (blue, Right) complexes over the course of three independent MD simulation runs. Average energies are shown in black in each case. (G) Plot of the free energy changes of binding (ΔG) of the HC+β2m and HC+ORF7a complexes. (H) HeLaM-iORF7a cells were transiently transfected with control plasmid or plasmid encoding human β2m for 8 h, followed by the induction of ORF7a expression (+Dox for 24 h) and effect on surface MHC-I was assayed by flow cytometry (Left, n = 3). Expression of ORF7a and β2m was assessed by western blotting, with GAPDH as loading control (Right). (I) Interaction between ORF7a and MHC-I in the presence of overexpressed human β2m was assessed by coimmunoprecipitation analysis. Human β2m or empty vector was transiently transfected into HeLaM-iORF7a cells followed by the induction of ORF7a expression for 24 h. Cells lysates were prepared in 1% digitonin and immunoprecipitation using normal IgG as a control (IP:Ctrl) or α-HLA-A/B/C, clone YTH862.2 (IP: HC: YTH862.2) was carried out, followed by western blot analysis to detect ORF7a, MHC-I heavy chain (HC), β2m, or GAPDH as loading control. Quantitative data shown are mean ± SD (error bars). Statistical significance was evaluated using the unpaired Student’s t test; *P < 0.05; **P < 0.01; ***P < 0.001; ns, not significant.
Fig. 3.
Fig. 3.
Localization of ORF7a to the ER determines retention of MHC-I. (A) A structural model of the full-length ORF7a as generated by AlphaFold (Left) and amino acid sequence of the protein (Right). Color coding indicates functional features of the protein- orange, ER-targeting signal sequence; cyan, Ig-like fold; yellow, transmembrane domain; red, the ER-retrieval motif (KRK) in the cytosolic C-terminal tail with the side chains shown. (B) Localization of ORF7a by confocal analysis. HeLaM cells were transfected with plasmids encoding ORF7a-WT or ORF7a-ARA and 24 h post transfection cells were fixed and stained with GRP94 (ER, blue), GM130 (Golgi, green), and ORF7a, red (Scale bar, 10 µm.) to determine colocalization (n = 35). (C) Localization of MHC-I in the presence of empty vector, ORF7a-WT, or ORF7a-ARA was determined by transfecting HeLaM cells with the corresponding plasmids for 24 h followed by confocal analysis of ORF7a, MHC-I (clone 15240, green), and GRP94 (ER, red) (Scale bar, 10 µm.).
Fig. 4.
Fig. 4.
ORF7a-mediated downregulation of antigen presentation by MHC-I is dependent on the ER retrieval signal. (A) Stable expression of a doxycycline (Dox)-inducible construct of ORF7a-WT and ORF-7a-ARA in HEK293T-hAce2 cells was verified in uninduced and induced (+Dox for 24 h) cell by western blotting (Left), and the effect on surface MHC-I was assayed by flow cytometry (Middle, n = 4). MHC-I and ORF7a mRNA levels were assessed by qPCR and relative expression was normalized to uninduced (−Dox) cells (n = 3). (B) Outline of the experimental strategy employed to determine the effect of ORF7a on peptide presentation by HLA-A2. (C) The amount of pLMP2A presented by HLA-A2 was determined by flow cytometric analysis of induced cells (+Dox for 24 h) that expressed the fusion protein using a TCR-like monoclonal antibody specific to this complex (n = 6). (D) Flow cytometric analysis of surface HLA-A2 in cells expressing ORF7a-WT and ORF-7a-ARA (n = 4). Statistical significance was evaluated using the unpaired Student’s t test; *P < 0.05; **P < 0.01; ***P < 0.001; ns, not significant.
Fig. 5.
Fig. 5.
Mechanisms by which SARS-CoV-2 evades adaptive immune responses mediated by MHC-I (A) Proposed mechanism by which ORF7a slows the export of MHC-I from the ER. In uninfected cells, the free heavy chain associates with β2m to form the MHC-I heterodimer. This associates with the PLC and MHC-I molecules loaded with peptide (pMHC-I) are released for export from the ER en route to the cell surface (Upper). ORF7a interacts with free heavy chain, interfering with its association with β2m and thus the peptide-loading complex, delaying exit from the ER (Lower). (B) Various gene products of SARS-CoV-2 down-regulate MHC-I-mediated immune responses in an infected cell. ORF6 prevents the transcriptional upregulation of MHC-I following infection (a), while NSP14 globally down-regulates translation (b). ORF8 interacts with HLA-A2 and targets it to the autophagosome where it is destined to be degraded on fusion with lysosomes to form the autophagolysosome (c). We report that the expression of ORF3a causes Golgi fragmentation, inhibiting the trafficking of MHC-I and other surface proteins (d) and that ER-localized ORF7a impedes the export of MHC-I from the ER, down-regulating surface MHC-I (e).

Update of

References

    1. Blum J. S., Wearsch P. A., Cresswell P., Pathways of antigen processing. Annu. Rev. Immunol. 31, 443–473 (2013). - PMC - PubMed
    1. Menachery V. D., et al. , MERS-CoV and H5N1 influenza virus antagonize antigen presentation by altering the epigenetic landscape. Proc. Natl. Acad. Sci. U.S.A. 115, E1012–E1021 (2018). - PMC - PubMed
    1. van de Weijer M. L., Luteijn R. D., Wiertz E. J., Viral immune evasion: Lessons in MHC class I antigen presentation. Semin. Immunol. 27, 125–137 (2015). - PubMed
    1. Hewitt E. W., The MHC class I antigen presentation pathway: Strategies for viral immune evasion. Immunology 110, 163–169 (2003). - PMC - PubMed
    1. Ashrafi G. H., Brown D. R., Fife K. H., Campo M. S., Down-regulation of MHC class I is a property common to papillomavirus E5 proteins. Virus Res. 120, 208–211 (2006). - PubMed

Publication types

MeSH terms