. 2023 Jan 3;120(1):e2210490120.
doi: 10.1073/pnas.2210490120. Epub 2022 Dec 27.

Kidney-resident innate-like memory γδ T cells control chronic Staphylococcus aureus infection of mice

Affiliations

Kidney-resident innate-like memory γδ T cells control chronic Staphylococcus aureus infection of mice

Tabea Bertram et al. Proc Natl Acad Sci U S A. .

Abstract

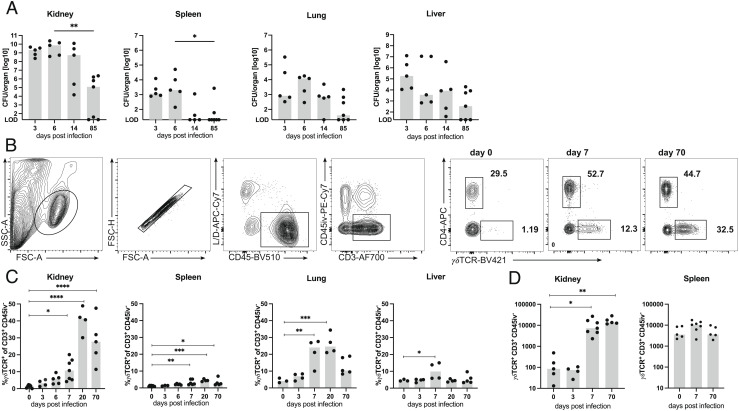
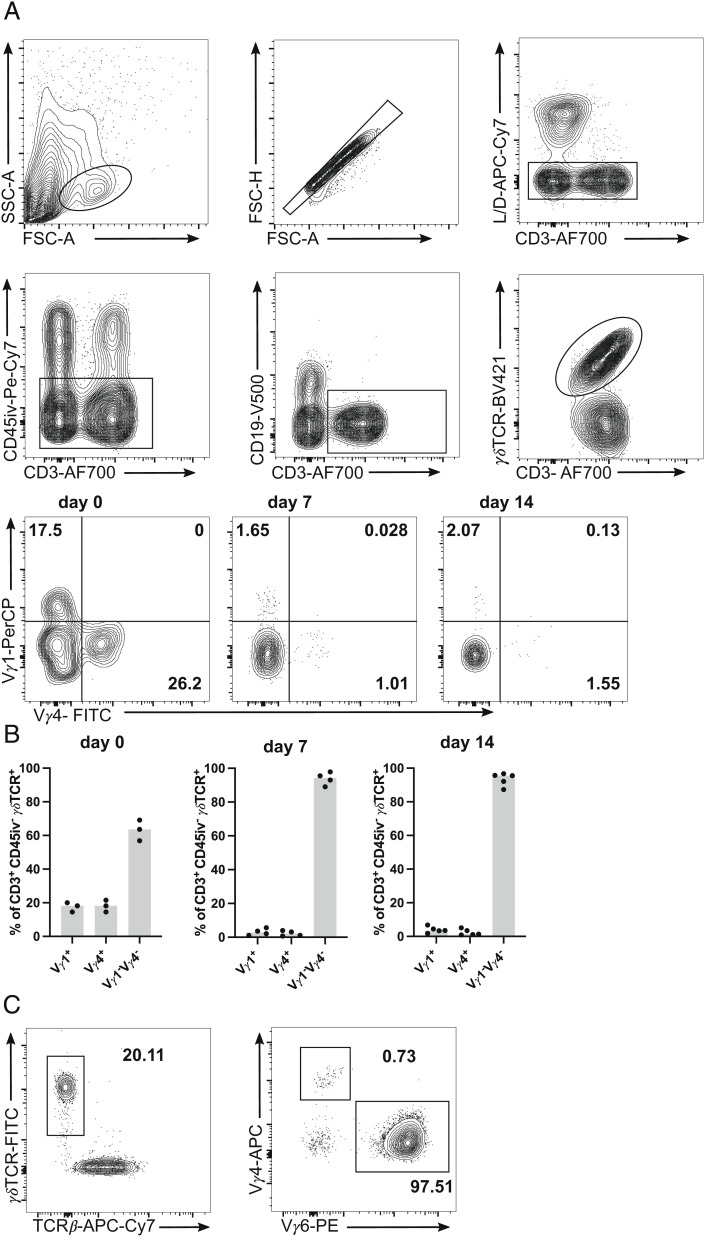
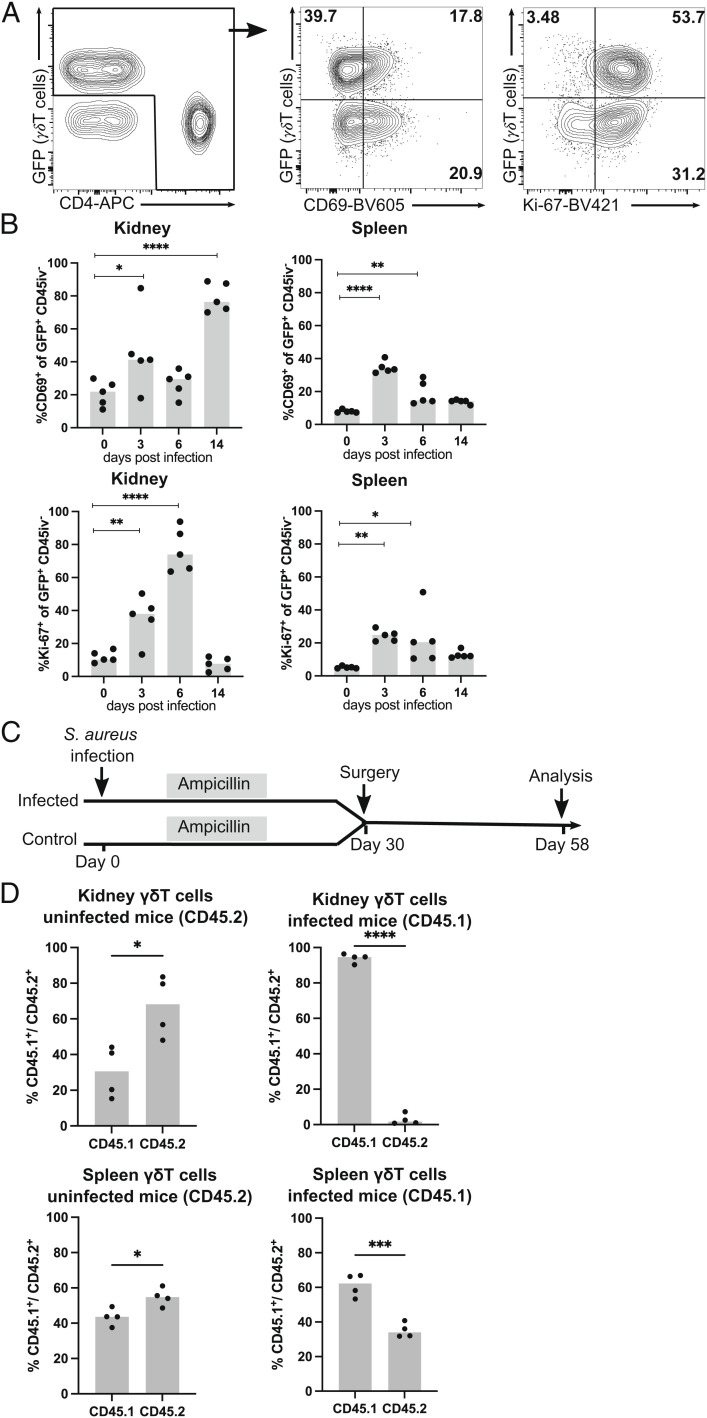
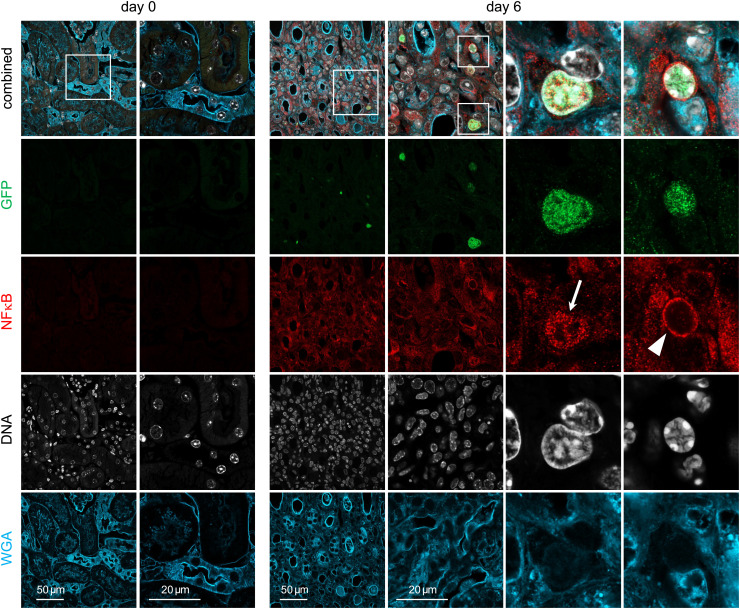
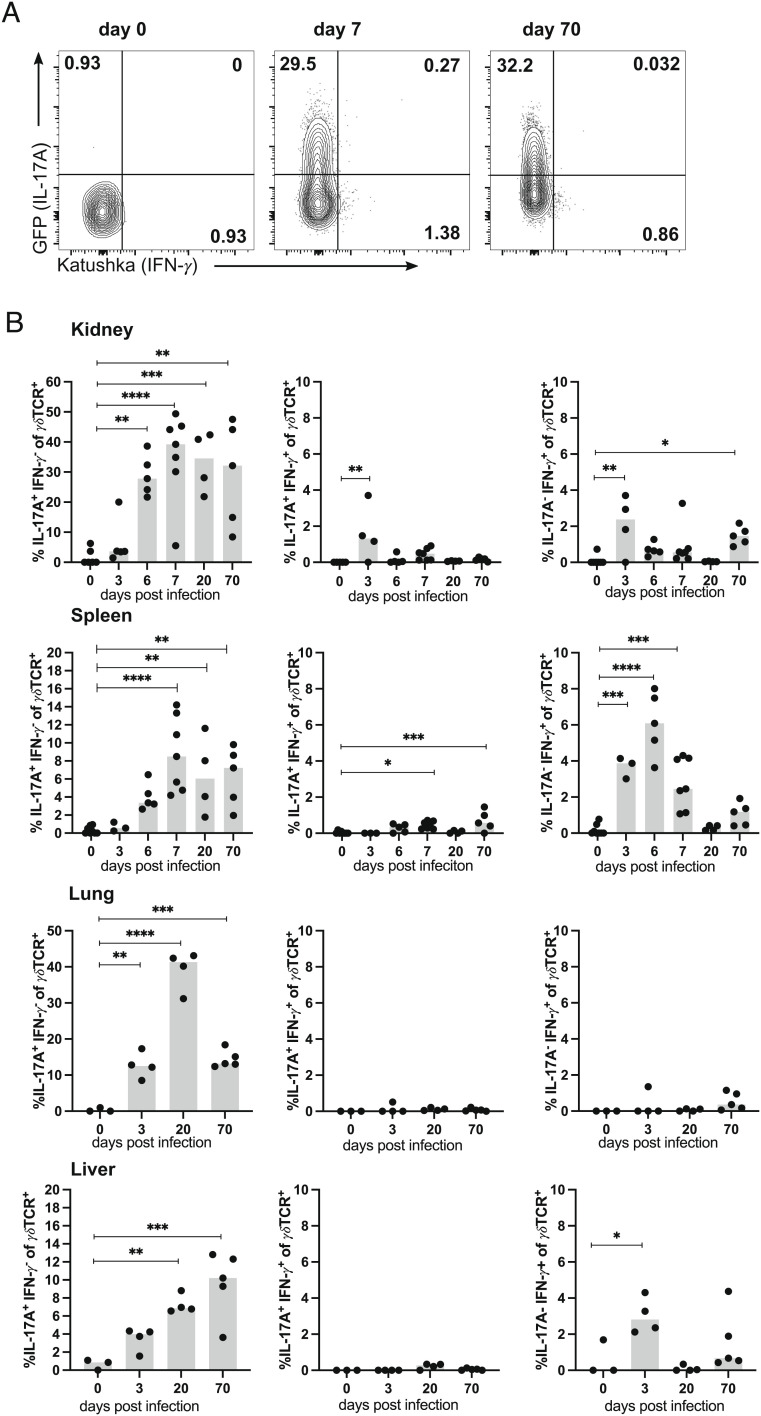
γδ T cells are involved in the control of Staphylococcus aureus infection, but their importance in protection compared to other T cells is unclear. We used a mouse model of systemic S. aureus infection associated with high bacterial load and persistence in the kidney. Infection caused fulminant accumulation of γδ T cells in the kidney. Renal γδ T cells acquired tissue residency and were maintained in high numbers during chronic infection. At day 7, up to 50% of renal γδ T cells produced IL-17A in situ and a large fraction of renal γδ T cells remained IL-17A+ during chronic infection. Controlled depletion revealed that γδ T cells restricted renal S. aureus replication in the acute infection and provided protection during chronic renal infection and upon reinfection. Our results demonstrate that kidney-resident γδ T cells are nonredundant in limiting local S. aureus growth during chronic infection and provide enhanced protection against reinfection.

Keywords: IL-17; Staphylococcus aureus; T cell memory; tissue residency; γδ T cells.


Conflict of interest statement

The authors declare no competing interest.

Figures

Fig. 1.
Fig. 1.
S. aureus causes chronic infection and induces a strong γδ T cell response. (A) TCRdH2BeGFP mice were infected i.v. with 107 CFU of S. aureus. On indicated days p.i., bacteria numbers in the kidney, spleen, lung, and liver were determined. Data are from one of two independent experiments (n = 5 to 7 mice per time point), symbols represent numbers from individual mice, and bars show the median. (LOD, limit of detection). (BD) Foxp3RFP×Il17aeGFP×IfngKat mice were infected i.v. with 107 CFU of S. aureus or remained without infection. On indicated days p.i., leukocytes from kidneys, spleen, lungs, and liver were isolated and directly analyzed by flow cytometry. Three minutes prior to collecting organs, mice received i.v. fluorochrome-conjugated anti-CD45 mAb to label vascular cells. (B) Gating strategy shown for renal leukocytes and representative dot plots of renal γδ T cells and CD4+ T cells on days 0, 7, and 70 p.i. (C) Percentages of γδ T cells in the kidney, spleen, lung, and liver. (D) γδ T cell counts in the kidney and spleen. (C, D) Results from one of two independent experiments with three to seven animals per time point. Symbols represent individual mice, and bars show median values. Statistical analyses were performed by Kruskal–Wallis test and Dunn’s multiple comparisons posttest (A) or by one-way ANOVA test and Dunnett’s multiple comparisons posttest (C, D).
Fig. 2.
Fig. 2.
Vγ repertoire of renal γδ T cells. C57BL/6 mice were infected i.v. with 107 CFU of S. aureus or remained without infection. At the indicated time points, leukocytes were isolated from the kidney, and directly analyzed by flow cytometry. Three minutes prior to collecting organs, mice received i.v. fluorochrome-conjugated anti-CD45 mAb to label vascular cells. (A) Renal γδ T cells were identified as CD45iv CD3+ γδTCR+ cells and analyzed Vγ1 and Vγ4 expression. Gating strategy for renal γδ T cells and representative dot plots for Vγ1 and Vγ4 staining of γδ T cells. (B) Percentages of renal Vγ1+, Vγ4+, and Vγ1Vγ4 γδ T cells. (C) Representative dot plots for Vγ4 and Vγ6 staining of renal γδ T cells. Results in (B) are representative of one of two independent experiments with three to five animals per time point. Symbols represent individual mice and bars show median values.
Fig. 3.
Fig. 3.
After S. aureus infection, renal γδ T cells proliferate and acquire a tissue-resident phenotype. (A, B) TCRdH2BeGFP mice were infected with 107 CFU of S. aureus or remained without infection. γδ T cells from the spleen and kidney were isolated and analyzed directly by flow cytometry. Three minutes prior to collecting organs, mice received i.v. fluorochrome-conjugated anti-CD45 mAb to label vascular cells. (A) Representative anti-CD4 and GFP staining of renal CD45iv CD3+ T cells (Left) at day 6 p.i. and of CD69 (Middle) and Ki-67 (Right) expression of gated CD4+ (Lower Quadrants) and γδ T cells (Upper Quadrants). (B) Percentages of CD69+ and of Ki-67+ GFP+ γδ T cells in the spleen and kidney analyzed at the indicated days p.i. Results are from one of two independent experiments with four to five animals per time point. (C, D) CD45.1 mice were infected with S. aureus. After 2 wk, infected and CD45.2 control mice were treated with ampicillin. On day 30 p. i., infected and control mice were surgically joined, and after further 28 d, mice were killed and cells in the spleen and kidney were analyzed. (C) Experimental scheme. (D) Percentages of CD45.1+ and CD45.2+ γδ T cells in the spleen and kidney of mice with and without prior S. aureus infection. Symbols represent individual mice and bars show the median. Statistical analysis was performed with one-way ANOVA test and Dunnett’s multiple comparisons posttest (B) or with Student t test (D).
Fig. 4.
Fig. 4.
NFκB response in renal γδ T cells following S. aureus infection. TCRdH2BeGFP mice were infected with 107 CFU of S. aureus or remained without infection. Renal sections from mice at days 0 and 6 p.i. were stained with anti-GFP Ab to identify GFP+ γδ T cells (green; due to the histone 2B eGFP fusion protein, the staining is localized in the nucleus), anti-NFκB Ab (red), DNA (Hoechst, white), and wheat germ agglutinin (WGA, blue). Representative staining for sections from days 0 and 6 are shown (original magnification ×600). Large magnifications on the right show nuclear GFP+ γδ T cells with nuclear (arrow) and perinuclear (arrow head) NFκB staining. Additional sections for days 3 and 14 are presented in SI Appendix, Fig. S5. Sections are representative for five to seven mice per time point.
Fig. 5.
Fig. 5.
Renal γδ T cells retain IL-17A production during chronic S. aureus infection. Foxp3RFP×Il17aeGFP×IfngKat mice were infected with 107 CFU of S. aureus or remained without infection. At the indicated days p.i., cells were isolated from the spleen, kidney, lung, and liver, and CD45iv γδTCR+ CD3+ cells were directly analyzed for cytokine reporter proteins. Three minutes prior to collecting of organs, mice received i.v. fluorochrome-conjugated anti-CD45 mAb to label vascular cells. (A) Representative dot plots for Katushka (IFN-γ) and GFP (IL-17A) expression in renal γδ T cells. (B) Percentages of IL-17A+IFN-γ, IL-17A+IFN-γ+, and IL-17AIFN-γ+ γδ T cells in organs. Representative result of two independent experiments with four to seven mice per group and time point. Symbols represent individual mice, and bars show median values. Statistical analysis was performed by one-way ANOVA test and Dunnett’s multiple comparisons posttest.
Fig. 6.
Fig. 6.
Renal γδ T cells produce type-3 cytokines in response to inflammatory cytokines. TCRdH2BeGF mice were infected with 107 CFU of S. aureus. After 4 wk, mice were treated with ampicillin for 2 wk. Leucocytes were isolated from the kidney and after T cell enrichment by magnetic negative selection, γδ T cells were isolated based on their GFP expression by flow cytometry. γδ T cells were stimulated either with cytokines (IL-1β, IL-6, and IL-23), anti-CD3, and anti-CD28 mAb, heat-killed S. aureus, or Pam3Cys-Ser-(Lys)4. After 72 h, cytokines were determined in the supernatant. Cells were stimulated and analyzed in triplicates or quadruplicates. One representative experiment out of two is shown. LOD: IL-17A 2.0 pg/ml, IFN-γ 1.7 pg/ml, TNF-α 1.5 pg/ml, IL-22 1.8 pg/ml, IL-17F 1.9 pg/ml, IL-10 1.8 pg/ml.
Fig. 7.
Fig. 7.
Depletion of γδ T cells during chronic S. aureus infection and prior to reinfection results in loss of bacterial control. (A, B) On days 0 and 2, TcrdGLD mice received 1 µg DT in PBS i.p. Control animals received PBS only. On day 7, mice were infected i.v. with 107 CFU of S. aureus. Seven days later, bacterial numbers in the kidney, lung, spleen, and liver as well as percentages of renal γδ T cells were determined. (A) Experimental scheme. (B) Bacterial counts in the kidney and spleen. (C, D) TcrdGLD mice were infected i.v. with 107 CFU of S. aureus. On days 20 and 22, mice were treated i.p. with 1 µg DT in PBS or with PBS only. On day 27, bacterial numbers in the kidney, lung, spleen, and liver were determined. (C) Experimental scheme. (D) Bacterial counts in kidney and spleen. (E, F) TcrdGLD mice were infected i.v. with 107 CFU of S. aureus (d0) or remained without infection (−). After 4 wk, all mice were treated with ampicillin in drinking water for 2 wk. On days 70 and 72, mice were treated i.p. with 0.5 µg DT in PBS or with PBS only. On day 79, mice of all groups were infected i.v. with 107 CFU of S. aureus. Seven days later bacterial numbers in the kidney, spleen, liver, and lung were determined. (E) Experimental scheme. (F) Bacterial counts in the kidney and spleen. (B, D, F) Each dot represents one mouse. For each setting, data are pooled from two independent experiments with n = 4 to 10 per group and experiment. Bars show median values. LOD = 20 CFU. Statistics were performed with the Mann–Whitney U test (B, D) or Kruskal–Wallis test and Dunn’s multiple comparisons posttest (F).

References

    1. Tong S. Y., Davis J. S., Eichenberger E., Holland T. L., Fowler V. G. Jr., Staphylococcus aureus infections: Epidemiology, pathophysiology, clinical manifestations, and management. Clin. Microbiol. Rev. 28, 603–661 (2015). - PMC - PubMed
    1. Kang C. I., et al. , Bloodstream infections in adult patients with cancer: Clinical features and pathogenic significance of Staphylococcus aureus bacteremia. Support Care Cancer. 20, 2371–2378 (2012). - PubMed
    1. Buvelot H., Posfay-Barbe K. M., Linder P., Schrenzel J., Krause K. H., Staphylococcus aureus, phagocyte NADPH oxidase and chronic granulomatous disease. F.E.M.S. Microbiol. Rev. 41, 139–157 (2017). - PubMed
    1. Mölne L., Verdrengh M., Tarkowski A., Role of neutrophil leukocytes in cutaneous infection caused by Staphylococcus aureus. Infect. Immun. 68, 6162–6167 (2000). - PMC - PubMed
    1. Robertson C. M., et al. , Neutrophil depletion causes a fatal defect in murine pulmonary Staphylococcus aureus clearance. J. Surg. Res. 150, 278–285 (2008). - PMC - PubMed

Publication types

Substances