High-speed imaging reveals the bimodal nature of dense core vesicle exocytosis
- PMID: 36574702
- PMCID: PMC9910497
- DOI: 10.1073/pnas.2214897120
High-speed imaging reveals the bimodal nature of dense core vesicle exocytosis
Abstract
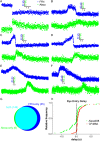
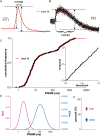
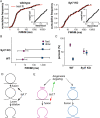
During exocytosis, the fusion of secretory vesicle with plasma membrane forms a pore that regulates release of neurotransmitter and peptide. Heterogeneity of fusion pore behavior has been attributed to stochastic variation in a common exocytic mechanism, implying a lack of biological control. Using a fluorescent false neurotransmitter (FFN), we imaged dense core vesicle (DCV) exocytosis in primary mouse adrenal chromaffin cells by total internal reflection fluorescence microscopy at millisecond resolution and observed strikingly divergent modes of release, with fast events lasting <30 ms and slow events persisting for seconds. Dual imaging of slow events shows a delay in the entry of external dye relative to FFN release, suggesting exclusion by an extremely narrow pore <1 nm in diameter. Unbiased comprehensive analysis shows that the observed variation cannot be explained by stochasticity alone, but rather involves distinct mechanisms, revealing the bimodal nature of DCV exocytosis. Further, loss of calcium sensor synaptotagmin 7 increases the proportion of slow events without changing the intrinsic properties of either class, indicating the potential for independent regulation. The identification of two distinct mechanisms for release capable of independent regulation suggests a biological basis for the diversity of fusion pore behavior.
Keywords: dense core vesicle; exocytosis; fluorescent false neurotransmitter; fusion pore; synaptotagmin 7.
Conflict of interest statement
The authors declare no competing interest.
Figures


Similar articles
-
Synaptotagmin-7 places dense-core vesicles at the cell membrane to promote Munc13-2- and Ca2+-dependent priming.Elife. 2021 Mar 22;10:e64527. doi: 10.7554/eLife.64527. Elife. 2021. PMID: 33749593 Free PMC article.
-
Imaging of evoked dense-core-vesicle exocytosis in hippocampal neurons reveals long latencies and kiss-and-run fusion events.J Cell Sci. 2009 Jan 1;122(Pt 1):75-82. doi: 10.1242/jcs.034603. Epub 2008 Dec 9. J Cell Sci. 2009. PMID: 19066284 Free PMC article.
-
Silence of Synaptotagmin VII inhibits release of dense core vesicles in PC12 cells.Sci China C Life Sci. 2009 Dec;52(12):1156-63. doi: 10.1007/s11427-009-0160-y. Epub 2009 Dec 17. Sci China C Life Sci. 2009. PMID: 20016973
-
Unproductive exocytosis.J Neurochem. 2016 Jun;137(6):880-9. doi: 10.1111/jnc.13561. Epub 2016 May 1. J Neurochem. 2016. PMID: 26841731 Review.
-
Fusion pores and their control of neurotransmitter and hormone release.J Gen Physiol. 2017 Mar 6;149(3):301-322. doi: 10.1085/jgp.201611724. Epub 2017 Feb 6. J Gen Physiol. 2017. PMID: 28167663 Free PMC article. Review.
Cited by
-
Nuclear envelope budding and its cellular functions.Nucleus. 2023 Dec;14(1):2178184. doi: 10.1080/19491034.2023.2178184. Nucleus. 2023. PMID: 36814098 Free PMC article.
-
Exploiting Microelectrode Geometry for Comprehensive Detection of Individual Exocytosis Events at Single Cells.ACS Sens. 2023 Aug 25;8(8):3187-3194. doi: 10.1021/acssensors.3c00884. Epub 2023 Aug 8. ACS Sens. 2023. PMID: 37552870 Free PMC article.
-
Deficiency of synaptotagmin-1 aggravates pressure overload-induced cardiac hypertrophy and dysfunction via the p38 MAPK signaling pathway in mice.Hum Cell. 2025 Apr 25;38(3):96. doi: 10.1007/s13577-025-01220-z. Hum Cell. 2025. PMID: 40279007 Free PMC article.
-
Mapping and decoding neuropeptide signaling networks in nervous system function.Curr Opin Neurobiol. 2025 Jun;92:103027. doi: 10.1016/j.conb.2025.103027. Epub 2025 Apr 21. Curr Opin Neurobiol. 2025. PMID: 40262384 Free PMC article. Review.
References
-
- Parsons T. D., Coorssen J. R., Horstmann H., Almers W., Docked granules, the exocytic burst, and the need for ATP hydrolysis in endocrine cells. Neuron 15, 1085–1096 (1995). - PubMed
-
- Voets T., Neher E., Moser T., Mechanisms underlying phasic and sustained secretion in chromaffin cells from mouse adrenal slices. Neuron 23, 607–615 (1999). - PubMed
-
- Rorsman P., Renstrom E., Insulin granule dynamics in pancreatic beta cells. Diabetologia 46, 1029–1045 (2003). - PubMed
Publication types
MeSH terms
Substances
Grants and funding
LinkOut - more resources
Full Text Sources

