. 2023 Feb;299(2):102830.
doi: 10.1016/j.jbc.2022.102830. Epub 2022 Dec 24.

The NTPase activity of the double FYVE domain-containing protein 1 regulates lipid droplet metabolism

Affiliations

The NTPase activity of the double FYVE domain-containing protein 1 regulates lipid droplet metabolism

V A Ismail et al. J Biol Chem. 2023 Feb.

Abstract

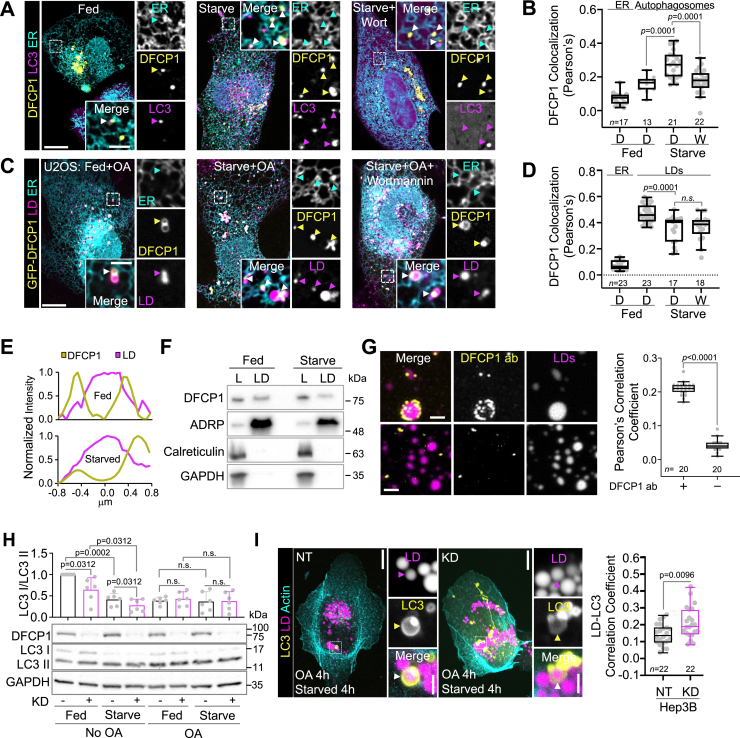
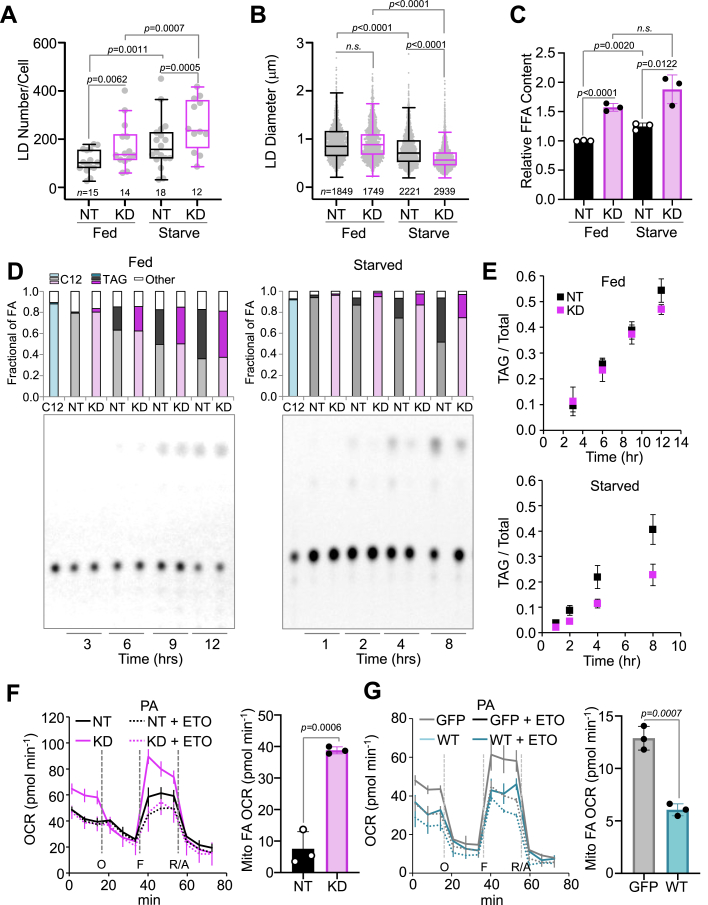
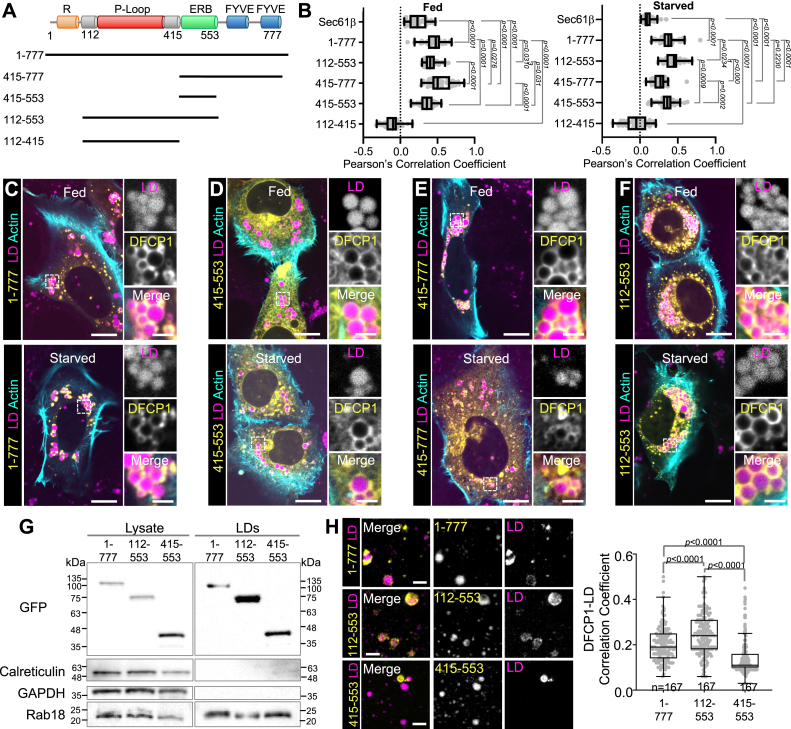
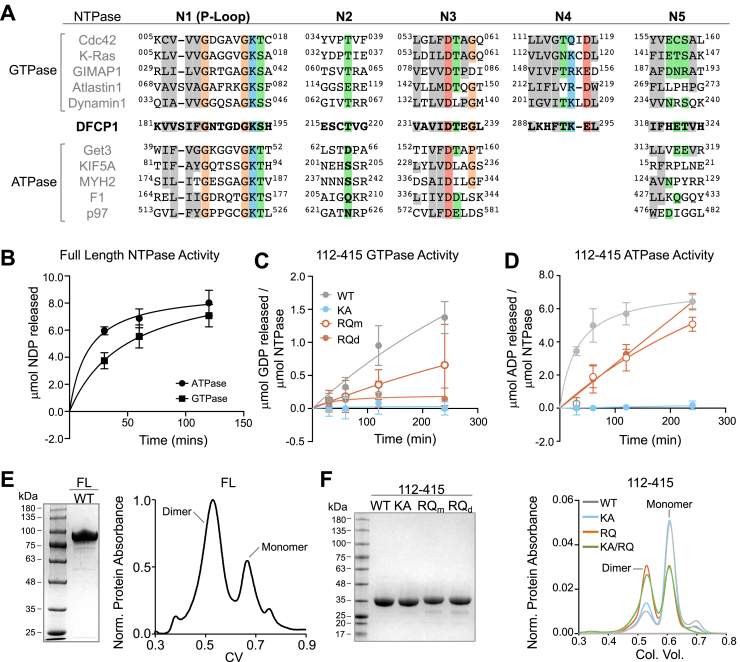
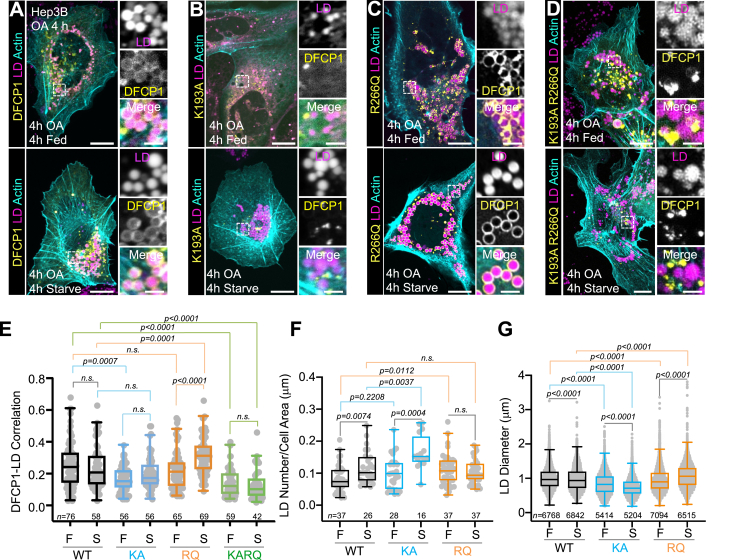
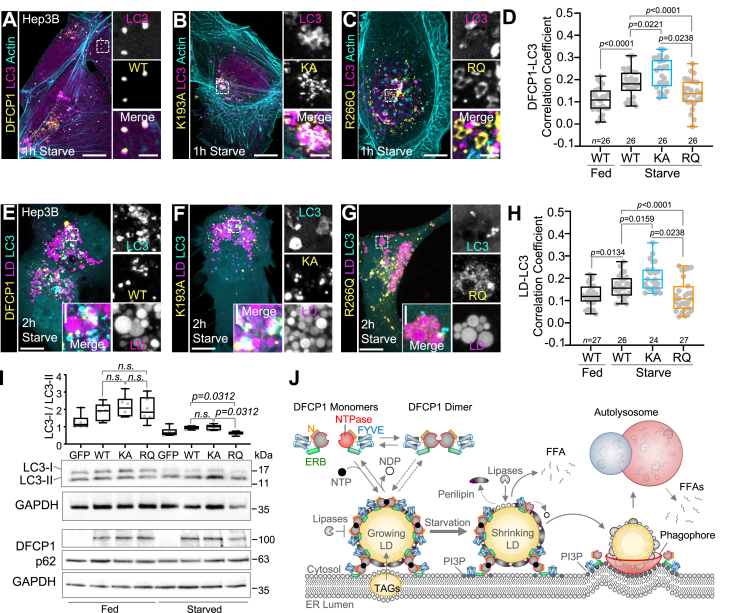
Lipid droplets (LDs) are transient lipid storage organelles that can be readily tapped to resupply cells with energy or lipid building blocks and therefore play a central role in cellular metabolism. However, the molecular factors and underlying mechanisms that regulate the growth and degradation of LDs are poorly understood. It has emerged that proteins that establish contacts between LDs and the endoplasmic reticulum play a critical role in regulating LD metabolism. Recently, the autophagy-related protein, double FYVE domain-containing protein 1 (DFCP1/ZFYVE1) was shown to reside at the interface of the endoplasmic reticulum and LDs, however, little is known about the involvement of DFCP1 in autophagy and LD metabolism. Here, we show that DFCP1 is a novel NTPase that regulates free fatty acid metabolism. Specifically, we show that DFPC1-knockdown, particularly during starvation, increases cellular free fatty acids and decreases the levels of cellular TAGs, resulting in accumulated small LDs. Using selective truncations, we demonstrate that DFCP1 accumulation on LDs in cells and in vitro is regulated by a previously unknown NTPase domain. Using spectroscopic approaches, we show that this NTPase domain can dimerize and can hydrolyze both ATP and GTP. Furthermore, mutations in DFCP1 that either impact nucleotide hydrolysis or dimerization result in changes in the accumulation of DFCP1 on LDs, changes in LD density and size, and colocalization of LDs to autophagosomes. Collectively, our findings suggest that DFCP1 is an NTPase that modulates the metabolism of LDs in cells.

Keywords: ATPase; DFCP1; GTPase; ZFYVE1; autophagy; fatty acid; lipid droplets; membrane contact site; metabolism.


Conflict of interest statement

Conflict of interest The authors declare that they have no conflicts of interest with the contents of this article.

Figures

Figure 1
Figure 1
DFCP1 localizes to LDs and autophagosomes.A, live cell confocal images of U2OS cells expressing mTagBFP2-DFCP1 (yellow), GFP-LC3 (magenta), and mCherry-Sec61β (cyan). Prior to imaging, cells were incubated 1 h in growth (left), starvation media (middle), or starvation media supplemented with 1 μM Wortmannin for 30 min (right). B, colocalization (Pearson’s correlation coefficient) of mTagBFP2-DFCP1 with the ER and LC3 from fed and starved U2OS cells treated with either DMSO (D) or 1 μM Wortmannin for 30 min (W). Individual colocalization measurements for each cell are plotted along with a box-and-whisker representation of the data. C, live cell confocal images of U2OS cells expressing mTagBFP2-DFCP1 (yellow) and mCherry-Sec61β (cyan). Cells were treated with 200 μM oleic acid (OA) for 4 h to stimulate LD formation (OA-stimulated) prior to 1 h incubations in growth media (left), starvation media (middle), or starvation media supplemented with 1 μM Wortmannin for 30 min (right). LipidTOX Green was used to mark LDs (magenta). D, colocalization (Pearson’s correlation coefficient) of mTagBFP2-DFCP1 with the ER and LDs from fed and starved U2OS cells treated with either DMSO (D) or 1 μM Wortmannin for 30 min (W). Individual colocalization measurements for each cell are plotted along with a box-and-whisker representation of the data. E, representative line scans across LDs from fed (top) and starved (bottom) OA-stimulated U2OS cells shown quantified in (C), showing DFCP1 intensity (yellow) relative to the LipidTOX Green intensity (magenta). F, Western blots of purified LDs isolated from fed and starved OA-stimulated U2OS cells showing the total cell lysate (L) and the purified LD fraction (LD). The LD fraction is distinguished by the marked enrichment for the LD marker ADRP and the absence of the ER marker calreticulin and cytosolic marker GAPDH. G, confocal images of purified LDs isolated from fed OA-stimulated U2OS cells that were stained with LipidTOX Deep Red and incubated with either anti-DFCP1 primary (top row) or BSA (bottom row) followed by an incubation with goat anti-rabbit antibody conjugated to AlexaFluor 488 secondary (scale bar represents 2 μm). The Pearson’s correlation coefficient between the endogenous DFCP1 with LDs, measured for each cell, is plotted along with a box-and-whisker representation of the data on the right. H, Western blot showing the conversion of endogenous LC3-I to LC3-II in clarified cell lysates from NT and KD Hep3B cells that were treated with or without 4 h OA and either fed or starved for 4 h prior to harvesting. Graph shows individual measurement of the LC3I/II ratio (determined by densitometry) along with the mean ± SD. I, live cell confocal images of Hep3B cells expressing LifeAct-mTagBFP2 and GFP-LC3 and stained with LipidTOX Deep Red. Cells were treated with 200 μM OA for 4 h to stimulate LD formation (OA-stimulated) prior to 1 h incubations in growth (left), starvation media (middle), or starvation media supplemented with 1 μM Wortmannin for 30 min (right). The Pearson’s correlation coefficient of LC3 with LDs, measured for each fed and starved Hep3B cell, is plotted along with a box-and-whisker representation of the data on the right. The scale bars in whole-cell and inset images represent 10 and 2 μm, respectively. The statistical significance of the colocalization measurements in panels B, D, G, and I was determined using the Mann–Whitney U-test on the indicated number of observations (indicated in each figure panel) recorded from two independent transfections. The statistical significance of the Western blot densitometry measurements in panel H was determined using Wilcoxon matched-pairs signed rank test from three independent transfections consisting of two replicate blots (six measurements in total). Exact p-values are reported with exception to p > 0.05, which is considered to be nonsignificant (n.s.). See also Fig. S1. BSA, bovine serum albumin; DFCP1, double FYVE domain– containing protein 1; DMSO, dimethyl sulfoxide; LD, lipid droplet.
Figure 2
Figure 2
DFCP1 regulates LD metabolism.A and B, number and diameter distributions of LDs quantified from images of control nontargeting siRNA treated (NT) and DFCP1 siRNA (KD) OA-stimulated Hep3B cells expressing LifeAct-mTagBFP2 and GFP. LDs were visualized using LipidTOX Deep Red. LD diameter was measured in the plane of a confocal Z-stack where a given LD’s diameter was the greatest. The number of LDs per cell (A) and the individual LD diameters (B) are plotted along with the box-and-whisker representations of the data. C, FFA content measured in NT or KD OA-stimulated Hep3B cells that were either fed or starved for 4 h. Bar graphs show individual measurements along with mean ± SD. D and E, TLC plates reporting the conversion of Bodipy C12-labeled TAGs into free Bodipy C12 FAs in control and DFCP1 KD Hep3B cells that were treated with 3 μM Bodipy C12 for 14 h (fed) or 8 h (starved). The C12 lane shows free Bodipy C12 blotted on the TLC plate immediately before mobilization. Bar graphs above the TLC plates show the fraction of free Bodipy C12 (light cyan, lightgray, and lightmagenta), Bodipy C12 TAGs (dark cyan, darkgray, and darkmagenta) and other Bodipy C12 species (white box). The fraction of TAG over time is plotted in E as mean ± SD. F, Seahorse assay showing the cellular oxygen consumption rate (OCR) for control (black solid and dashed lines) and DFCP1 KD Hep3B cells (magenta solid and dashed lines) stimulated with BSA-conjugated palmitic acid (PA) and in the presence of DMSO (not labeled) or Etomoxir (ETO). The OCR traces are presented as mean ± SD. The Mito FA OCR, calculated from the difference in the average mitochondria-specific uncoupled OCR (following FCCP) between DMSO and Etomoxir-treated cells, is shown as individual measurements along with mean ± SD on the right. G, Seahorse assay showing the cellular OCR for Hep3B cells overexpressing GFP (gray solid and dashed lines) and Hep3B cells overexpressing GFP-DFCP1 (teal solid and dashed lines) stimulated with BSA-palmitate complex and in the presence of DMSO (not labeled) or etomoxir (ETO). The OCR traces are presented as mean ± SD. Quantification of the Mito FA OCR is shown as individual measurements along with mean ± SD on the right. The statistical significance of the measurements in A and B was determined using the Mann–Whitney U-test on the indicated number of observations from two independent transfections. The statistical significance in C was determined using an unpaired Student’s t test on three independent experiments. The statistical significance in F and G was determined using a Student’s t test on three independent experiments recorded on the same assay plate. Exact p-values are reported with exception to p > 0.05, which is considered to be nonsignificant (n.s.). See also Fig. S2. BSA, bovine serum albumin; DFCP1, double FYVE domain– containing protein 1; DMSO, dimethyl sulfoxide; FA, fatty acid; FFA, free fatty acid; LD, lipid droplet; OA, oleic acid; TAG, triacylglyceride.
Figure 3
Figure 3
Domain requirements for DFCP1 localization to LDs.A, domain diagram of DFCP1 depicting the N-terminal Ring-like domain (R), the NTPase domain (P-loop), the endoplasmic reticulum–binding domain (ERB), and the tandem FYVE domains (FYVE). GFP-tagged constructs used in this figure are depicted below the domain diagram. B, the extent of colocalization (Pearson’s correlation coefficient) between GFP-DFCP1 and LDs from fed (left) and starved (right) cell populations depicted in panels C–F. The extent of colocalization between GFP-Sec61β and LDs is also included as a reference (Fig. S3C). Individual colocalization measurements from each cell are plotted along with a box-and-whisker representation of the data. C–F, representative images of U2OS cells expressing LifeAct-mTagBFP2 (cyan) and the GFP-DFCP1 truncations (yellow) indicated in A. Prior to imaging, all cells were treated with 200 μM OA for 20 h before incubating in either growth or starvation media for 18 h. LDs were visualized with LipidTOX Deep Red (magenta). G, Western blots of clarified lysates (left) and isolated LD fraction (right) from OA-stimulated DFCP1 KO U2OS cells rescued with GFP-DFCP1 constructs 1-777, 112-553, and 415-553. The LD fraction is distinguished by the absence of calreticulin and GAPDH. Rab18 was used as a load control since its abundance does not depend on the accumulation of DFCP1 on LDs. H, confocal images of isolated LDs in (G) and labeled with LipidTOX Deep Red. The Pearson’s correlation coefficient between the indicated GFP-DFCP1 constructs with LDs, measured for each cell, is plotted along with a box-and-whisker representation of the data on the right. The scale bars in whole-cell and inset images represent 10 and 2 μm, respectively. The statistical significance of the measurements in panels B and H was determined using the Mann–Whitney U-test. Exact p-values are reported with exception to those that are >0.05, which are considered to be nonsignificant (n.s.). See also Fig. S3. DFCP1, double FYVE domain–containing protein 1; ER, endoplasmic reticulum; LD, lipid droplet; OA, oleic acid.
Figure 4
Figure 4
Characterization of the DFCP1 NTPase domain.A, sequence alignment of the human DFCP1 N-box motifs with several representative human GTPases and ATPases. B, ADP (circle) and GDP (square) release assays using 20 μM ATP or GTP, respectively, and 2 μM of the FL DFCP1. Plotted data points represent mean ±SD for three independent experiments. C, GDP release assay using 20 μM GTP and 2 μM of the following DFCP1 constructs: WT (112-415; gray), KA (112-415 containing the K193A mutation; blue), or RQm/RQd (monomeric/dimeric states of 112-415 containing the R266Q mutation; orange open and closed). Plotted data points represent mean ±SD for three independent experiments. D, ADP release assay using 20 μM ATP and 2 μM of the DFCP1 truncations in C. Plotted data points represent mean ±SD for three independent experiments. E, SDS-PAGE gel and size-exclusion chromatography profile of full-length FLAG-DFCP1. F, SDS-PAGE gel and size-exclusion chromatography profile of WT (gray), KA (blue), RQ (orange), and KARQ (construct that contains both the K193A and R266Q mutations; green) MBP-DFCP1 (112-415). See also Fig. S4. DFCP1, double FYVE domain–containing protein 1.
Figure 5
Figure 5
The NTPase activity of DFCP1 modulates LD accumulation.A–D, live-cell confocal images of DFCP1 KD Hep3B cells rescued with either WT (WT, A), K193A (KA, B), R266Q (RQ, C), and K193A/R266Q (KARQ, D) GFP-DFCP1 constructs (yellow) and treated with LipidTOX Deep Red (magenta). Prior to imaging, cells were OA-stimulated for 4 h before incubating in either growth or starvation media for 4 h. E, the extent of colocalization (Pearson’s correlation coefficient) between WT (black) and GFP-DFCP1 mutants KA (blue), RQ (orange), and KARQ (green) with LDs, measured from each cell of the cell populations depicted in Figure 4, A–D, is plotted along with a box-and-whisker representation of the data on the right. F and G, density and diameter distributions of LDs quantified from images represented in A–C. LD densities were determined for each cell by dividing the total number of LDs for a given cell by the cell’s area. The individual densities along with a box-and-whisker representation of the data are plotted in F. The LD diameter (visualized using LipidTOX Deep Red) was measured in in the plane where a given LD’s diameter was the largest. Each LD diameter along with a box-and-whisker representation of the data is plotted in G. The statistical significance of the measurements in panels E–G was determined using the Mann–Whitney U-test based on the number of observations indicated in each figure panel, which were recorded from two independent transfections. Exact p-values are reported with exception to those that are >0.05, which are considered to be nonsignificant (n.s.) The scale bars in whole-cell and inset images represent 10 and 2 μm, respectively. See also Fig. S5. DFCP1, double FYVE domain–containing protein 1; LD, lipid droplet; OA, oleic acid.
Figure 6
Figure 6
DFCP1 mutations modulate localization of autophagosome targeting of LDs.A–C, live-cell confocal images DFCP1 KD Hep3B cells expressing LifeAct-mTagBFP2, mCherry-LC3, and either WT (WT, A), K193A (KA, B), or R266Q (RQ, C) GFP-DFCP1 constructs. Prior to imaging, cells were incubated in either growth or starvation media for 1 h. D, the extent of colocalization (Pearson’s correlation coefficient) between GFP-DFCP1 and mCherry-LC3, measured from each cell for the cell populations depicted in Figure 5, AC, is plotted along with a box-and-whisker representation of the data on the right. E–G, live-cell confocal images of DFCP1 KD Hep3B cells treated with LipidTOX Deep Red and expressing mCherry-LC3 and either WT (E), K193A (F), or R266Q (G) GFP-DFCP1 constructs. Prior to imaging, cells were treated with OA for 4 h before incubating in either growth or starvation media for 1 h. H, the extent of colocalization (Pearson’s correlation coefficient) between GFP-LC3 and LDs, measured in each cell for the cell populations depicted in Figure 5, DF, is plotted along with a box-and-whisker representation of the data on the right. I, Western blot showing the abundance of p62 and the conversion of endogenous LC3-I to LC3-II in clarified cell lysates from rescued DFCP1 KD Hep3B cells that were treated with OA for 4 h and either fed or starved for 4 h prior to harvesting. Graph shows individual measurement of the LC3I/II ratio (determined by densitometry) along with the mean ± SD. J, model of the role of DFCP1 in LD metabolism. Nucleotide binding to DFCP1 facilitates localization of DFCP1 to LDs, which is stabilized through oligomerization. DFCP1 accumulation on LDs ultimately inhibits the lipolytic breakdown of LDs during starvation and as a consequence, the targeting of LDs by autophagosomes. The scale bars in whole-cell and inset images represent 10 and 2 μm, respectively. The statistical significance of the measurements in panels D and H was determined using the Mann–Whitney U-test based on the number of observations indicated in each figure panel, which were recorded from two independent transfections. The statistical significance of the Western blot densitometry measurements in panel I was determined using Wilcoxon matched-pairs signed rank test from three independent transfections consisting of two replicate blots (six measurements in total). Exact p-values are reported with exception to p > 0.05, which are considered to be nonsignificant (n.s.). DFCP1, double FYVE domain–containing protein 1; LD, lipid droplet; OA, oleic acid.

Similar articles

Cited by

References

    1. Krahmer N., Farese R.V., Walther T.C. Balancing the fat: lipid droplets and human disease. EMBO Mol. Med. 2013;5:973–983. - PMC - PubMed
    1. Schulze R.J., Sathyanarayan A., Mashek D.G. Breaking fat: the regulation and mechanisms of lipophagy. Biochim. Biophys. Acta Mol. Cell Biol. Lipids. 2017;1862:1178–1187. - PMC - PubMed
    1. Singh R., Cuervo A.M. Lipophagy: connecting autophagy and lipid metabolism. Int. J. Cell Biol. 2012;2012:1–12. - PMC - PubMed
    1. Kaushik S., Cuervo A.M. Degradation of lipid droplet-associated proteins by chaperone-mediated autophagy facilitates lipolysis. Nat. Cell Biol. 2015;17:759–770. - PMC - PubMed
    1. Schott M.B., Weller S.G., Schulze R.J., Krueger E.W., Drizyte-Miller K., Casey C.A., et al. Lipid droplet size directs lipolysis and lipophagy catabolism in hepatocytes. J. Cell Biol. 2019;218:3320–3335. - PMC - PubMed

Publication types

MeSH terms