. 2022 Dec 27;13(1):7960.
doi: 10.1038/s41467-022-35691-7.

Single-cell transcriptomic analysis identifies murine heart molecular features at embryonic and neonatal stages

Affiliations

Single-cell transcriptomic analysis identifies murine heart molecular features at embryonic and neonatal stages

Wei Feng et al. Nat Commun. .

Abstract

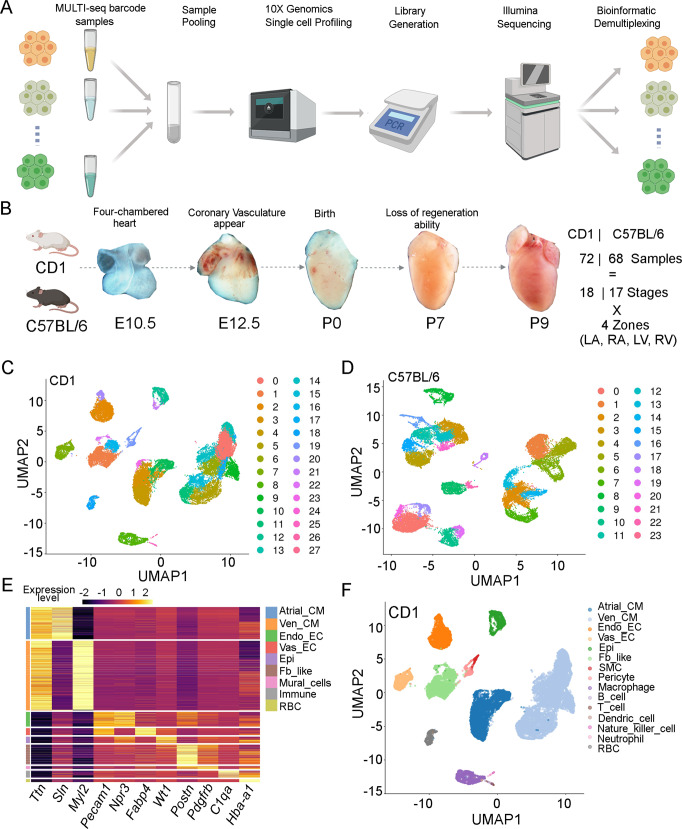
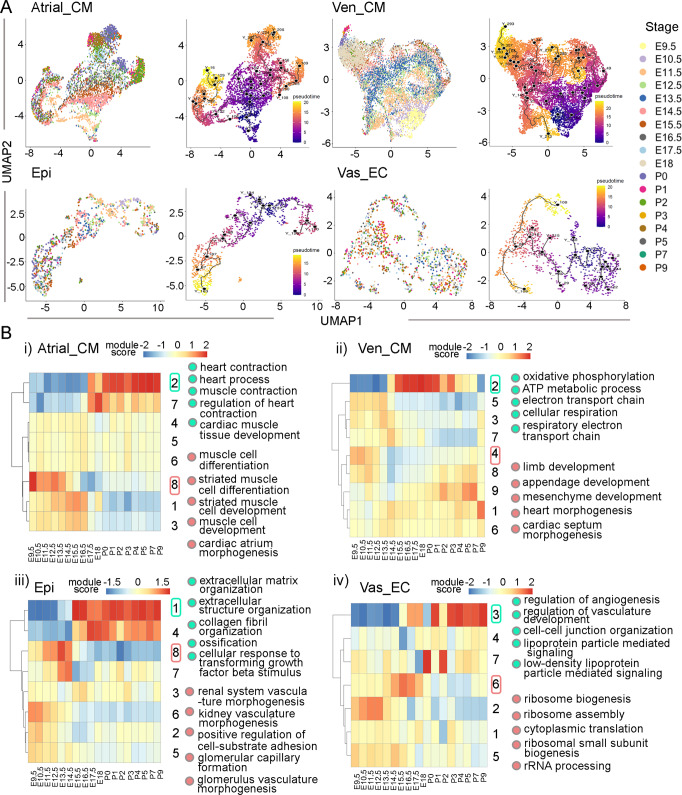
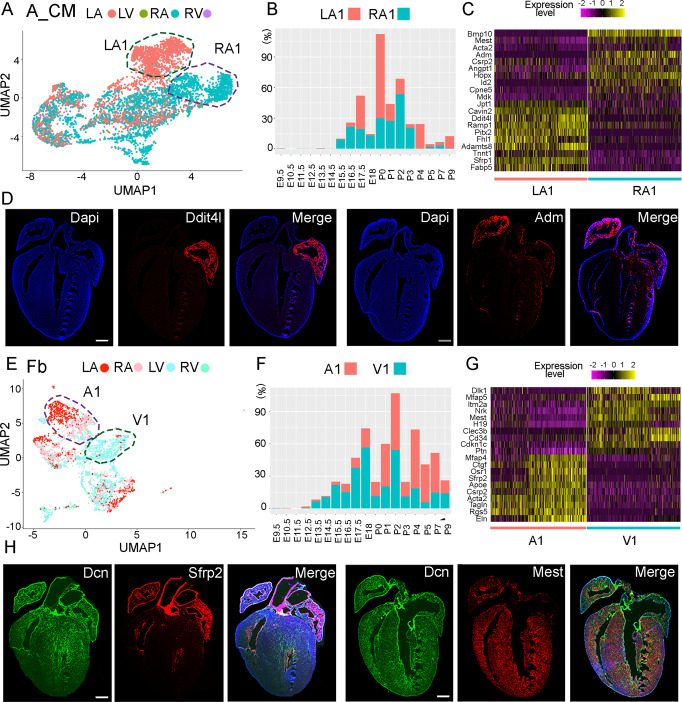
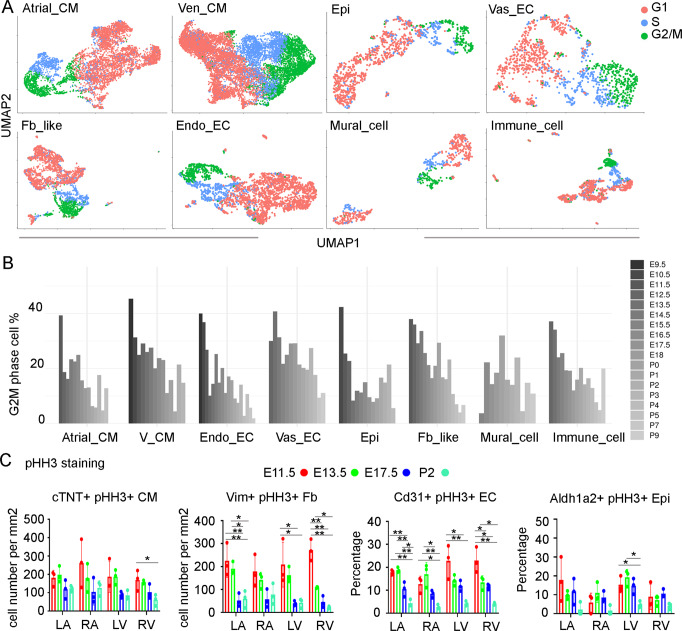
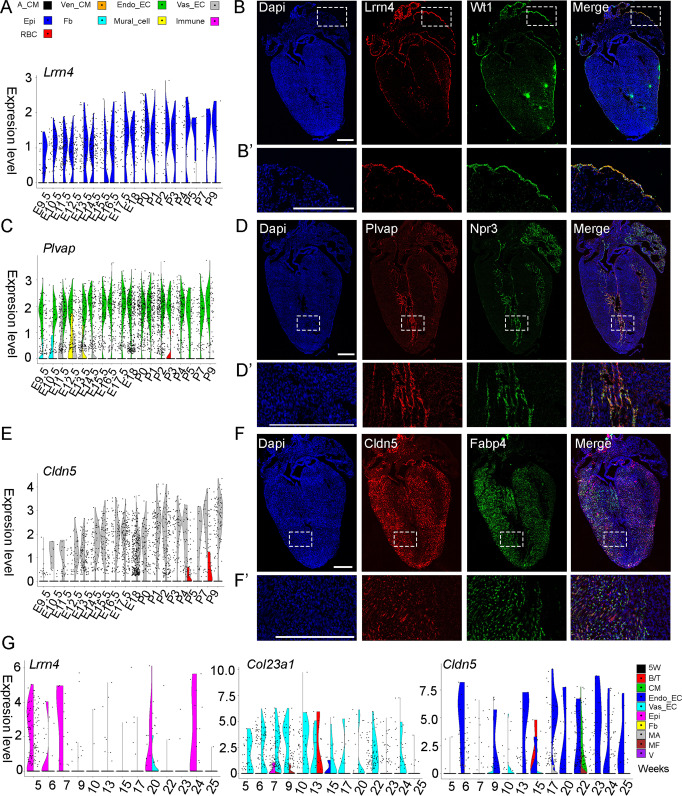
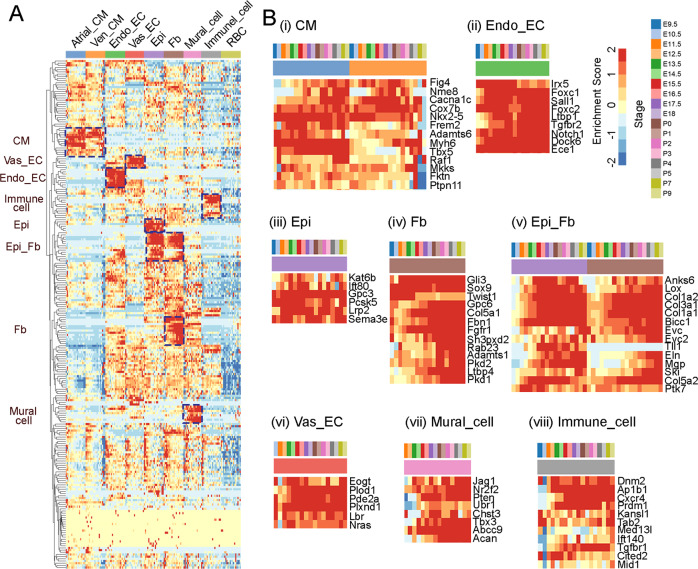
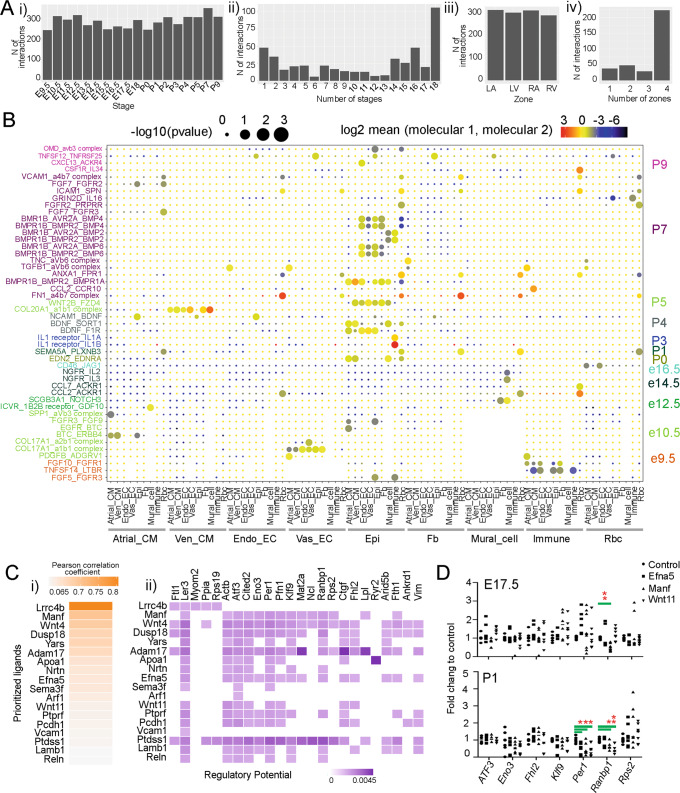
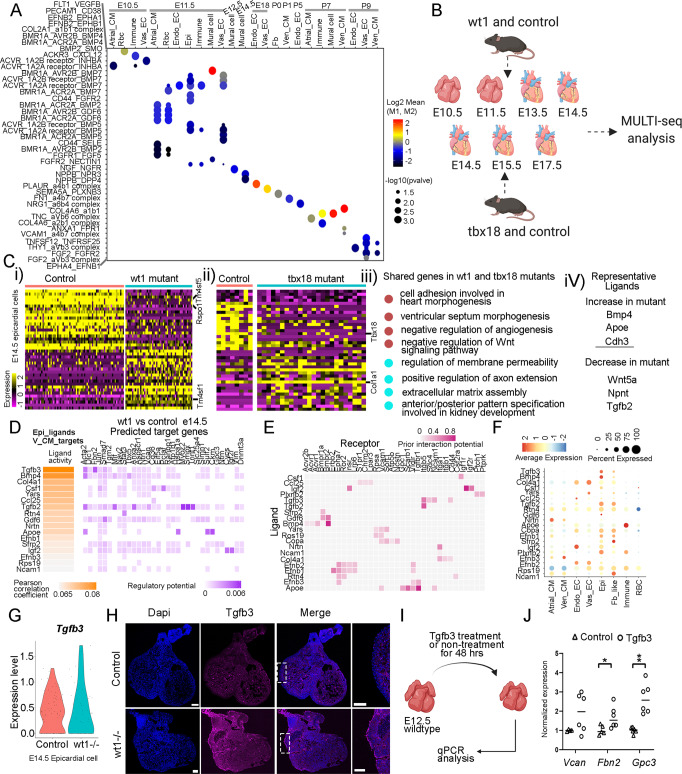
Heart development is a continuous process involving significant remodeling during embryogenesis and neonatal stages. To date, several groups have used single-cell sequencing to characterize the heart transcriptomes but failed to capture the progression of heart development at most stages. This has left gaps in understanding the contribution of each cell type across cardiac development. Here, we report the transcriptional profile of the murine heart from early embryogenesis to late neonatal stages. Through further analysis of this dataset, we identify several transcriptional features. We identify gene expression modules enriched at early embryonic and neonatal stages; multiple cell types in the left and right atriums are transcriptionally distinct at neonatal stages; many congenital heart defect-associated genes have cell type-specific expression; stage-unique ligand-receptor interactions are mostly between epicardial cells and other cell types at neonatal stages; and mutants of epicardium-expressed genes Wt1 and Tbx18 have different heart defects. Assessment of this dataset serves as an invaluable source of information for studies of heart development.


Conflict of interest statement

The authors declare no competing interests.

Figures

Fig. 1
Fig. 1. ScRNA-seq analysis of the developing hearts at embryonic and neonatal stages.
A Diagram of the MULTI-seq procedure. Each sample was stained with a unique MULTI-seq barcode before pooling and loading into the 10× Chromium for single cell capturing. The captured single cells were converted into libraries for sequencing and demultiplexing for downstream bioinformatic analyses. B Our scRNA-seq datasets include the named mouse strains, developmental stages, and heart zones. Figure 1A and part of Fig. 1B were created with BioRender.com. C, D Unsupervised clustering of CD1 and C57BL/6 scRNA-seq datasets. E The expression pattern of notable CD1 cardiac cell lineage genes. F UMAP plot of CD1 cells labeled by cell types.
Fig. 2
Fig. 2. Staged pattern of gene expression modules in each cell type.
A UMAP of single cell lineages labeled with stages and pseudo-time information. B Staged gene expression modules and their enriched gene pathways. The color bars represent module scores.
Fig. 3
Fig. 3. Chamber-specific molecular features of atrial CMs and fibroblasts.
A UMAP of A_CMs labeling the LA and RA-specific populations (LA1, RA1). B Stage analyses of LA1 and RA1 cells. C Expression heatmap of the top 20 genes differentially expressed in LA1 and RA1 cells. D mRNA staining confirmed the LA-specific expression of Ddit4l and RA-specific expression of Adm. E UMAP of fibroblasts revealed atrial and ventricular-specific cell populations (A1, V1). F The stage distribution of A1 and V1 cells. G Expression of the top 20 differentially expressed genes in A1 and V1 cells. H mRNA staining confirmed that Sfrp2 is specifically expressed in the atrium and Mest is specifically expressed in the ventricle. The staining experiments were repeated twice with similar results. Scale bar = 500 µm.
Fig. 4
Fig. 4. Analysis of cell cycle phases in each cell type.
A UMAP of single cells from each cell type labeled by cell cycle phases. B Percentage of G2M phased cells in each cell type declined along the developmental progression. C The proportion of pHH3 positive cells in each cell type declined along the developmental progression. N = 3 tissue sections were used for the quantifications. ANOVA with Tukey’s multiple comparisons was used for the statistical analysis. The error bars represent SD. * and ** indicate significance with p value < 0.05 and 0.01, respectively.
Fig. 5
Fig. 5. Identification of cell type-specific genes.
A Lrrn4 is specifically expressed in epicardial cells at all stages. B, B’ In situ RNA staining of Lrrn4 and known epicardial cell marker Wt1 confirmed the epicardium-specific expression of Lrrn4 in P2 hearts. C Plvap is specifically expressed in Endo_EC at most stages. D, D’ mRNA staining of Plvap and known Endo_EC marker Npr3 showed the Endo_EC specific expression of Plvap. E Cldn5 is specifically expressed in Vas_EC at most stages. F, F’ mRNA staining of Cldn5 and Fabp4 (a known Vas_EC gene) confirmed that Cldn5 is specifically expressed in Vas_EC. The staining experiments were repeated in more than three sections with similar results. G The expression of Lrrn4, Col23a1, and Cldn5 in different human cardiac cell types at fetal stages. Scale bar = 500 µm.
Fig. 6
Fig. 6. Expression pattern analysis of CHD genes using scRNA-seq data.
A Unsupervised clustering analysis of CHD genes revealed stage and cell type-specific expression patterns. B (i–viii) the enlarged expression heatmap of cell type-specific genes. The colors in the color bars represent different stages or cell types. The colors in heatmaps represent gene expression enrichment scores.
Fig. 7
Fig. 7. Analyses of ligand-receptor interactions between cardiac cell types.
A (i) The number of interactions at each stage. (ii) Quantification of interactions expressed at different numbers (1–18) of stages. (iii) The number of interactions at each zone. (iv) Quantification of the interactions expressed at different numbers of zones. B Expression pattern of ligand-receptor pairs uniquely expressed at one stage. C (i) Pearson Correlation Coefficient of prioritized ligands and (ii) The regulatory potential of each ligand on the genes differentially expressed in Ven_CMs at E17.5 and P0. The Pearson correlation coefficient reflects the ability of ligands in predicting target genes, and the regulatory potential represents the likelihood of a regulation between one ligand and one target gene. D Quantification of target genes’ expression in E17.5 and newborn mouse CMs after growth factor treatments. The relative expression of each target gene after treatment was normalized to GAPDH and control samples. ANOVA with Dunnett’s posthoc test was used for the statistical analysis between each treatment and the control. * and ** indicate significance with p value < 0.05 and 0.01, respectively.
Fig. 8
Fig. 8. ScRNA-seq analysis of Wt1 and Tbx18 mutant hearts at multiple stages.
A The stage-unique interactions between ligands from epicardial cells and receptors expressing in other cell types at different stages. B Diagram of the profiled samples and their derived developmental stages. This figure was created with BioRender.com. C (i, ii) Expression heatmap of the differentially expressed genes in control and Wt1 or Tbx18 mutant epicardial cells at E14.5. (iii) Pathway enrichment of abnormally expressed genes shared by Wt1 and Tbx18 mutant epicardial cells. (iv) Representative ligands with abnormal expression in Wt1 and Tbx18 mutant epicardial cells. DF The activity and expression pattern of epicardial cell-derived ligands and their prior interaction potentials with receptors and regulatory potentials on target genes expression in Ven_CMs at e14.5. G ScRNA-seq data revealed the upregulation of Tgfb3 expression in Wt1 mutant epicardial cells than controls at E14.5. H Immunofluorescence staining confirmed the upregulation of Tgfb3 in Wt1 mutant epicardial cells. The staining experiments were repeated twice with similar results. I, J Treatment of wildtype hearts with TGFB3 was able to induce the target genes’ expression. The diagram was created with BioRender.com. N = 2 biologically independent experiments with 3 replicates in each experiment. Student’s t-test with two-tailed distribution was used for the statistical analysis. The p-value is 0.111 for Vcan, 0.042 for Fbn2, and 0.0005 for Gpc3. Scale bar = 100 µm.

References

    1. Bruneau BG. Signaling and transcriptional networks in heart development and regeneration. Cold Spring Harb. Perspect. Biol. 2013;5:a008292. doi: 10.1101/cshperspect.a008292. - DOI - PMC - PubMed
    1. Evans SM, Yelon D, Conlon FL, Kirby ML. Myocardial lineage development. Circ. Res. 2010;107:1428–1444. doi: 10.1161/CIRCRESAHA.110.227405. - DOI - PMC - PubMed
    1. Buckingham M, Meilhac S, Zaffran S. Building the mammalian heart from two sources of myocardial cells. Nat. Rev. Genet. 2005;6:826–835. doi: 10.1038/nrg1710. - DOI - PubMed
    1. Christoffels VM, Moorman AF. Development of the cardiac conduction system: why are some regions of the heart more arrhythmogenic than others? Circ. Arrhythm. Electrophysiol. 2009;2:195–207. doi: 10.1161/CIRCEP.108.829341. - DOI - PubMed
    1. Houyel L, Meilhac SM. Heart development and congenital structural heart defects. Annu. Rev. Genomics Hum. Genet. 2021;22:257–284. doi: 10.1146/annurev-genom-083118-015012. - DOI - PubMed

Publication types