. 2022 Dec 27;6(1):95.
doi: 10.1038/s41698-022-00337-w.

The landscape of therapeutic vulnerabilities in EGFR inhibitor osimertinib drug tolerant persister cells

Affiliations

The landscape of therapeutic vulnerabilities in EGFR inhibitor osimertinib drug tolerant persister cells

Steven W Criscione et al. NPJ Precis Oncol. .

Abstract

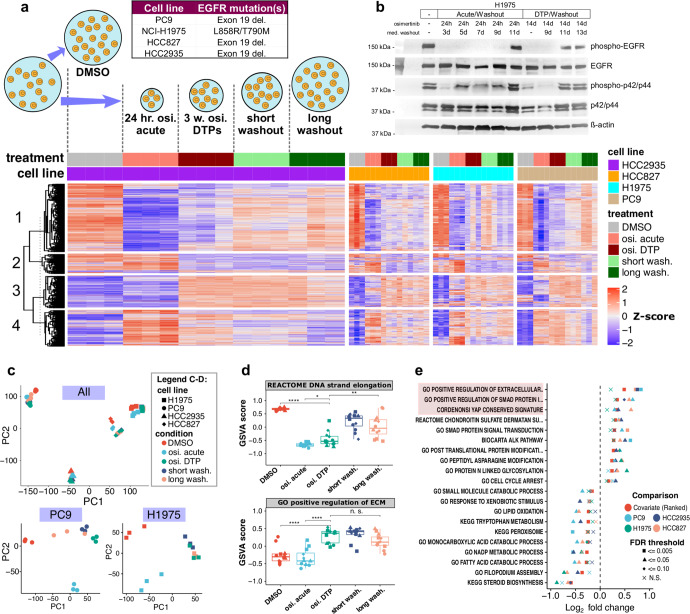
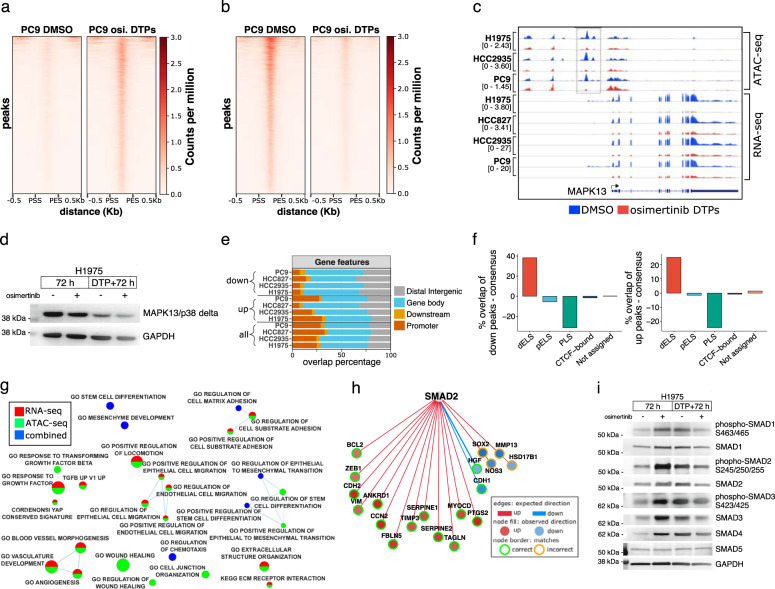
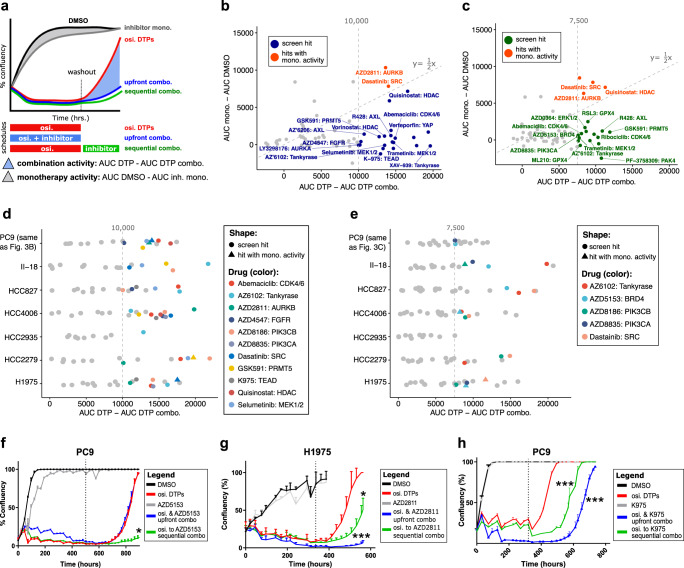
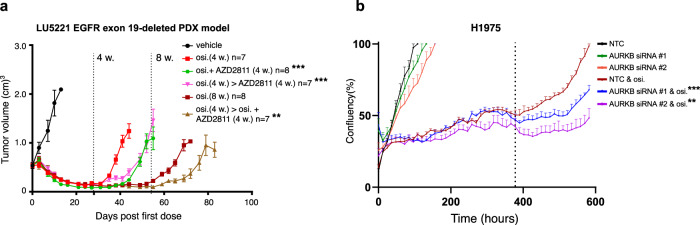
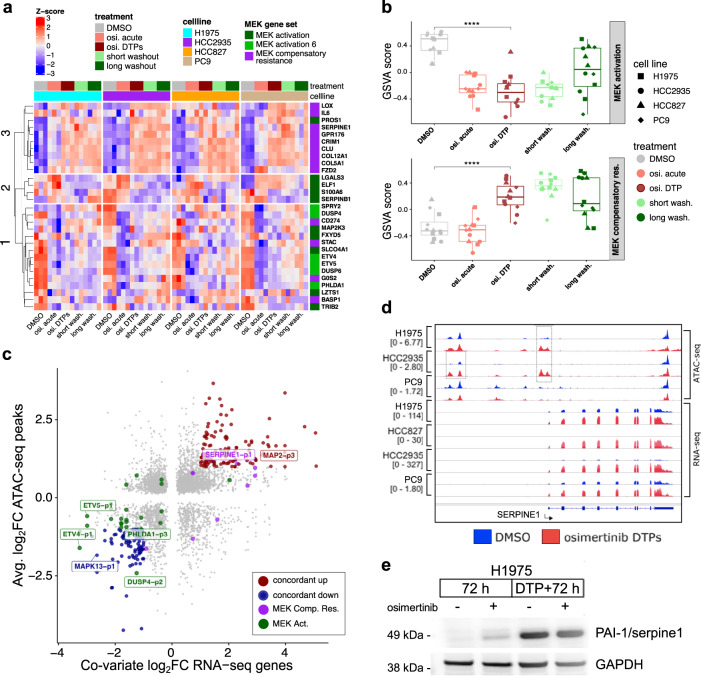
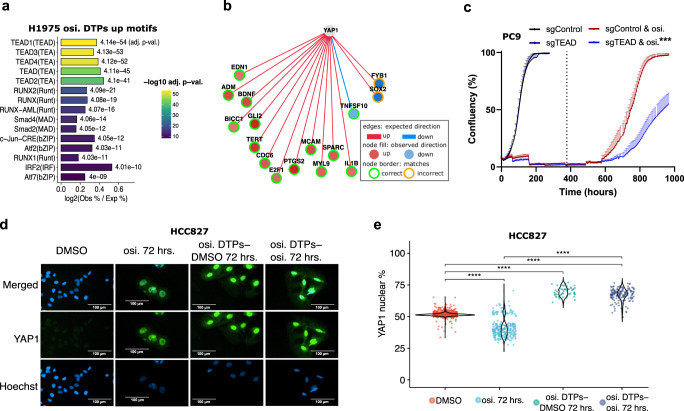
Third-generation EGFR tyrosine kinase inhibitors (EGFR-TKIs), including osimertinib, an irreversible EGFR-TKI, are important treatments for non-small cell lung cancer with EGFR-TKI sensitizing or EGFR T790M resistance mutations. While patients treated with osimertinib show clinical benefit, disease progression and drug resistance are common. Emergence of de novo acquired resistance from a drug tolerant persister (DTP) cell population is one mechanism proposed to explain progression on osimertinib and other targeted cancer therapies. Here we profiled osimertinib DTPs using RNA-seq and ATAC-seq to characterize the features of these cells and performed drug screens to identify therapeutic vulnerabilities. We identified several vulnerabilities in osimertinib DTPs that were common across models, including sensitivity to MEK, AURKB, BRD4, and TEAD inhibition. We linked several of these vulnerabilities to gene regulatory changes, for example, TEAD vulnerability was consistent with evidence of Hippo pathway turning off in osimertinib DTPs. Last, we used genetic approaches using siRNA knockdown or CRISPR knockout to validate AURKB, BRD4, and TEAD as the direct targets responsible for the vulnerabilities observed in the drug screen.


Conflict of interest statement

All authors are or they were employees of AstraZeneca, and all authors held stock interests in AstraZeneca at the time this study was conducted.

Figures

Fig. 1
Fig. 1. Osimertinib DTPs and acute treatment show distinct gene expression changes.
a Upper panel: Experimental design of osimertinib DTP RNA-seq time-course. Four EGFR mutant cell lines were treated with DMSO, osimertinib for 24 hours (acute), or osimertinib for 3 weeks (DTPs), followed by short or long washout (see Methods). Lower panel: The top 2000 genes (ranked by FDR) identified to change significantly in 3 of 4 cell line models in any experimental comparison using a moderated F-statistic. Gene expression values were Z-score normalized by cell line and patterns were identified by K-means clustering (K = 4) and subclustered by Euclidean distance. b Western blot of phospho-EGFR and phospho-p42/44 in H1975 cells treated with osimertinib acutely for 24 hours or 14 days to form DTPs with or without drug washouts. c Upper panel: Principal component analysis (PCA) of normalized log2 transcripts per million (TPM) gene expression after removing lowest quantile of least variable genes. Lower panel: Same as c upper panel, using only PC9 or H1975 cells. d Upper panel: gene set variation analysis (GSVA) scores for Reactome DNA strand elongation pathway (two-sided t test, p value * < 0.05, ** < 0.01, *** < 0.001). Boxplot is quartiles with range bar as minimum or maximum data values within 1.5 times the interquartile range. Lower panel: Same as d upper panel, GSVA scores for GO extracellular matrix pathway. e Top-ranked pathway changes in osimertinib DTPs versus acute treatment, selected by lowest FDR of cell line covariate differential GSVA analysis, compared to comparisons done separately in each cell line. The pathways are ordered by cell line covariate log2 fold change, color indicates the specific comparison, and shape indicates FDR status.
Fig. 2
Fig. 2. Osimertinib DTPs display altered chromatin accessibility.
a Significantly increased peaks in PC9 osimertinib DTPs in normalized counts per million (fold change > 2 and FDR < 0.005) in a 500 bp window centered on peak start site (PSS) to peak end site (PES) ± 0.5 kilobases. b Same as a, significantly decreased peaks in PC9 osimertinib DTPs. c Genome browser view of chromatin accessibility decreases in osimertinib DTPs identified upstream of MAPK13 (signal is normalized counts per million). d p38δ (MAPK13) Western blot in H1975 cells treated with osimertinib for 72 hours or 3 weeks to form DTPs with or without a 72 hour washout. e Proportion of peaks annotated by gene features for all consensus ATAC-seq peaks, peaks increasing significantly, or peaks decreasing significantly. f Percent overlap of ENCODE SCREEN regulatory elements for peaks increasing or decreasing chromatin accessibility subtracted by percent overlap in all consensus peaks (dELS distal enhancer like, pELS proximal enhancer like, PLS promoter like). g ActivePathways integrated ATAC-seq and RNA-seq cell line meta-analysis identified EMT-related pathways as enriched for significant alterations in osimertinib DTPs versus DMSO (FDR < 0.01). h SMAD2 was inferred to increase transcription factor activity by Causal Reasoning (Pollard p value = 3.7 × 10−6) from gene expression changes in osimertinib DTPs versus acute treatment. The edge color shows expected direction, node fill shows observed direction, and node outline displays whether observed matches expected direction. i Western blot of SMAD signaling pathway proteins in H1975 cells treated with osimertinib for 72 hours or 3 weeks with or without a 72 hour washout.
Fig. 3
Fig. 3. Osimertinib DTP drug combination screens identified vulnerabilities to BRD4, AURKB, and TEAD inhibition.
a Schematic of osimertinib DTP sequential or upfront drug combination screens. Combination activity was defined as the difference between AUCs for osimertinib DTPs and drug combination DTPs. Hits in the screen were also required to show at least twice the effect of monotherapy activity, defined as the difference between AUC DMSO and AUC monotherapy. b PC9 upfront DTP combination screen. Blue highlights screen hits (combination activity >10,000 and >2× monotherapy activity) and red highlights hits with <2× monotherapy activity. c Same as b, for the PC9 sequential DTP combination screen except >7500 combination activity was used to define hits. d Upfront DTP combination screens from PC9 and 6 additional EGFR mutant cell lines. Drugs defined as screen hits (combination activity >10,000 and >2× monotherapy activity) in at least 3 of 7 EGFR mutant cell lines are labeled. For drugs defined as screen hits, we also show if they were a hit with <2× monotherapy activity in another cell line using a triangle shape. e Same as d, for the sequential DTP combination drug screens. f Percent confluency of PC9 cells in upfront or sequential DTP screen with BRD4 inhibitor AZD5153 (300 nM). The dotted line indicates washout in upfront combination or drug crossover in sequential combination and error is s.e.m. The significance is a two-sided t test comparing the individual replicate drug combination AUC versus osimertinib monotherapy control (p value * < 0.05, ** < 0.005, *** < 0.001). g Same as f, for AURKB inhibitor AZD2811 (100 nM) in H1975 cells. h Same as f, for the TEAD inhibitor K-975 (100 nM).
Fig. 4
Fig. 4. The AZD2811 AURKB inhibitor combination regimens with osimertinib delayed tumor regrowth in vivo.
a Average tumor volume of a patient derived xenograft LU5221 EGFR exon 19-deleted tumor regrowth model dosed with osimertinib or osimertinib in upfront combination with AZD2811 (dosed IV 25 mg/kg once weekly), or osimertinib monotherapy followed by AZD2811 combination (error is s.e.m. and the legend significance is from a two-sided t test versus osimertinib monotherapy endpoint, p value * < 0.05, ** < 0.005, *** < 0.001). b Percent confluency of an upfront knockdown of AURKB using two siRNAs in combination with osimertinib in H1975 cells (error is s.e.m. and the legend significance is from a two-sided t test versus osimertinib non-targeting control endpoint, p value * < 0.05, ** < 0.005, *** < 0.001). The dotted line indicates osimertinib washout.
Fig. 5
Fig. 5. MEK gene signatures display chromatin-mediated gene expression changes in osimertinib DTPs.
a Gene expression patterns for MEK activation and MEK compensatory resistance genes (MEK activation 6 is a subset of MEK activation,. Gene expression log2TPM values were Z-score normalized by cell line and patterns were identified by K-means clustering (K = 3) and subclustered by Euclidean distance. b Upper: GVSA scores of MEK activation genes grouped by treatment (osimertinib DTPs versus DMSO, two-sided t test p value < 0.001). Boxplot is quartiles with range bar as minimum or maximum value within 1.5 times the interquartile range. Lower: GVSA scores of MEK compensatory resistance genes grouped by treatment (osimertinib DTPs versus DMSO, p value < 0.001). c Comparison of RNA-seq gene expression fold changes (from cell line covariate analysis) versus consensus peak average fold changes across cell lines that changed significantly in both assays (FDR < 0.005). Concordant up (dark red) genes change at least two-fold up in both assays, concordant down (dark blue) do the opposite. MEK activation genes are dark green and MEK compensatory resistance genes are purple. d Genome browser view of SERPINE1, an example MEK compensatory resistance gene, showing coordinated increased chromatin accessibility and increased RNA expression (signal is normalized counts per million). e Western blot of PAI-1 (SERPINE1) protein in H1975 cells treated with osimertinib for 72 hours or 3 weeks to form DTPs with or without a 72 hour drug washout.
Fig. 6
Fig. 6. The Hippo pathway turns off in osimertinib DTPs.
a TEAD transcription factor motifs were enriched for gained accessibility peaks in ATAC-seq (top 15 selected by lowest FDR, label is FDR value) in H1975 osimertinib DTPs. b YAP1 was inferred to have increased transcription factor activity in osimertinib DTPs (Pollard p value = 0.00056) by Causal Reasoning analysis of genes upregulated in DTPs versus acute treatment (cell line covariate RNA-seq comparison). The edge color shows expected direction, node fill shows observed direction, and the node outline displays whether expected matches the observed direction. c PC9 cell confluency for cells treated with osimertinib in combination with upfront knockout of pan-TEAD (CRISPR guide designed against conserved region of TEAD1-4) followed by drug washout (dotted line). Error is s.e.m. and the legend significance is from a two-sided t-test versus osimertinib sgControl endpoint (p value * < 0.05, ** < 0.005, *** < 0.001). d Representative images of YAP nuclear immunofluorescence in HCC827 treated with osimertinib for 72 hours, osimertinib DTPs, or osimertinib DTPs with or without a 72 hour washout. e Quantitation of the percentage YAP nuclear immunofluorescence (YAP nuclear/ total YAP) in HCC827 treated with osimertinib for 72 hours, osimertinib for 16 days to form DTPs, or osimertinib DTPs with or without a 72 hour washout (two-sided Wilcoxon signed-rank test, p value **** < 0.0001).

References

    1. Leonetti A, et al. Resistance mechanisms to osimertinib in EGFR-mutated non-small cell lung cancer. Br. J. Cancer. 2019;121:725–737. doi: 10.1038/s41416-019-0573-8. - DOI - PMC - PubMed
    1. Qin S, et al. Emerging role of tumor cell plasticity in modifying therapeutic response. Signal Transduct. Target. Ther. 2020;5:228. doi: 10.1038/s41392-020-00313-5. - DOI - PMC - PubMed
    1. Sharma SV, et al. A chromatin-mediated reversible drug-tolerant state in cancer cell subpopulations. Cell. 2010;141:69–80. doi: 10.1016/j.cell.2010.02.027. - DOI - PMC - PubMed
    1. Rambow F, et al. Toward minimal residual disease-directed therapy in melanoma. Cell. 2018;174:843–855.e819. doi: 10.1016/j.cell.2018.06.025. - DOI - PubMed
    1. Murtuza A, et al. Novel third-generation EGFR tyrosine kinase inhibitors and strategies to overcome therapeutic resistance in lung cancer. Cancer Res. 2019;79:689–698. doi: 10.1158/0008-5472.CAN-18-1281. - DOI - PubMed