. 2022 Dec 27;5(1):1419.
doi: 10.1038/s42003-022-04332-6.

A standalone incompatible insect technique enables mosquito suppression in the urban subtropics

Affiliations

A standalone incompatible insect technique enables mosquito suppression in the urban subtropics

Qin Zeng et al. Commun Biol. .

Abstract

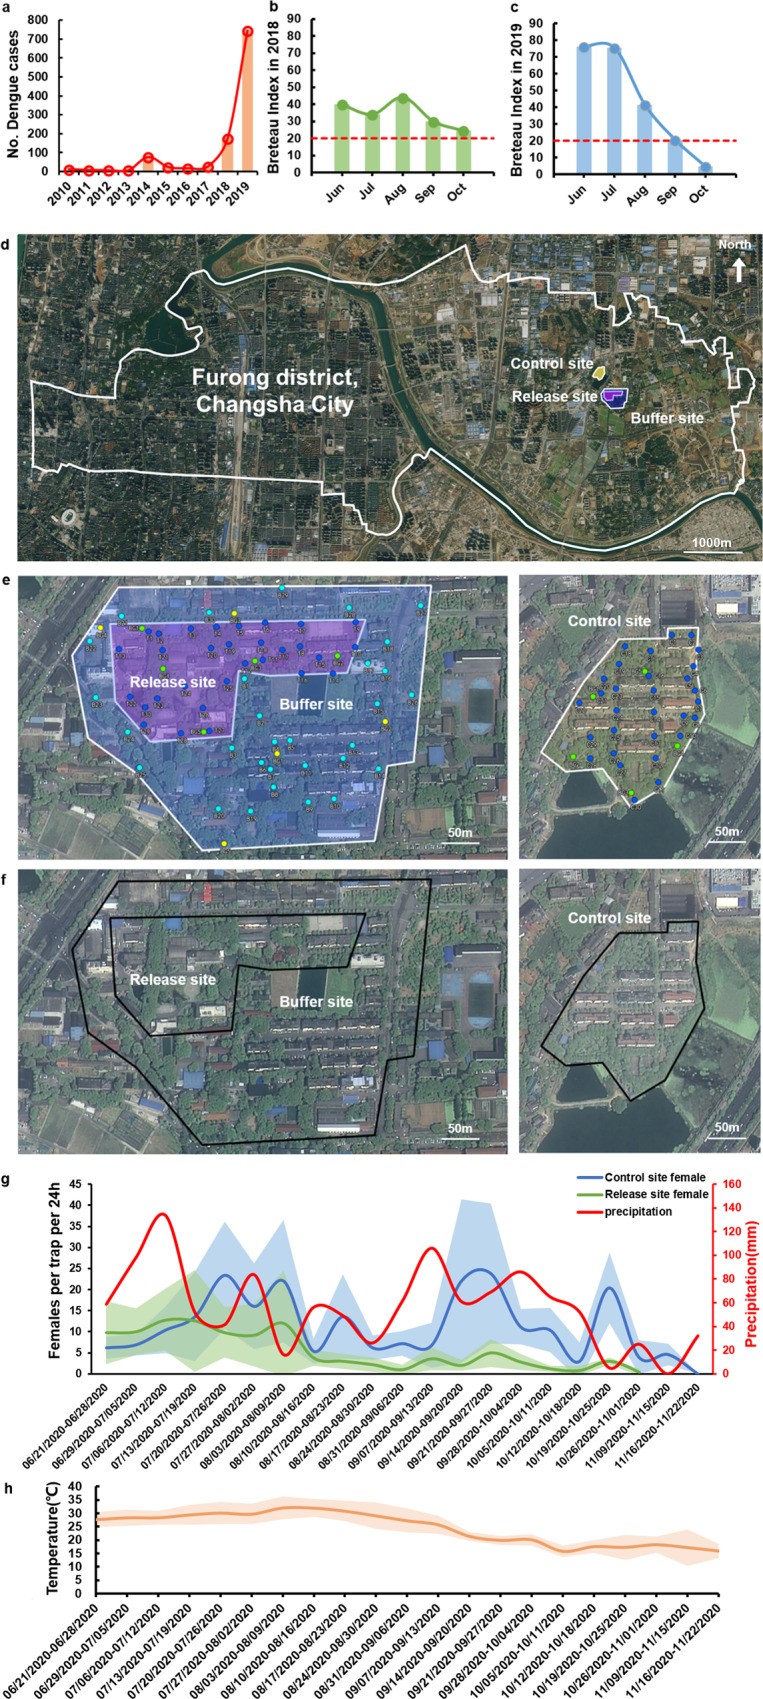
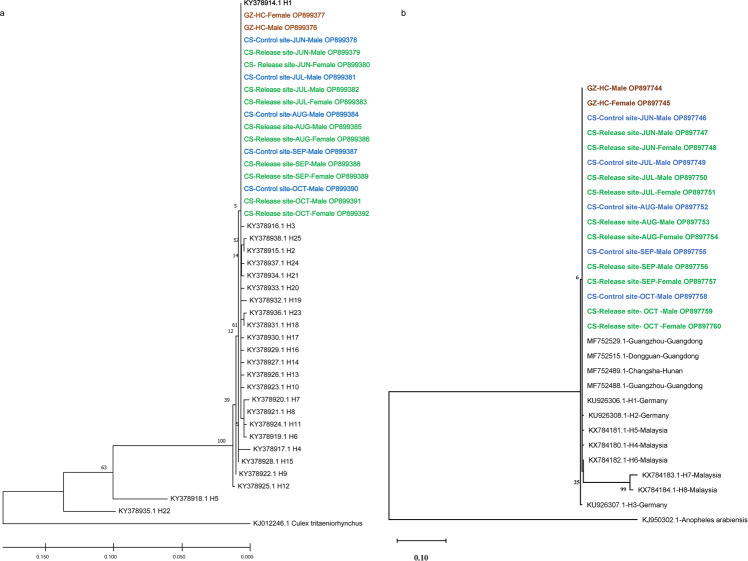
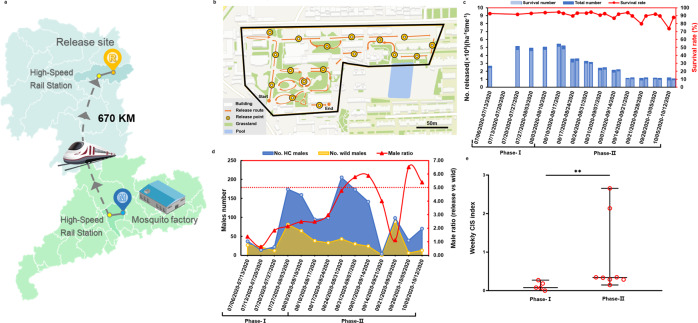
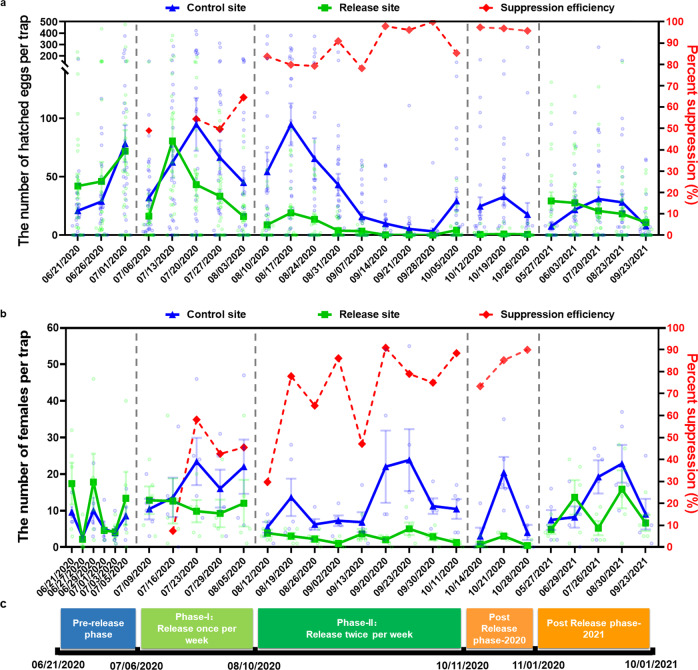
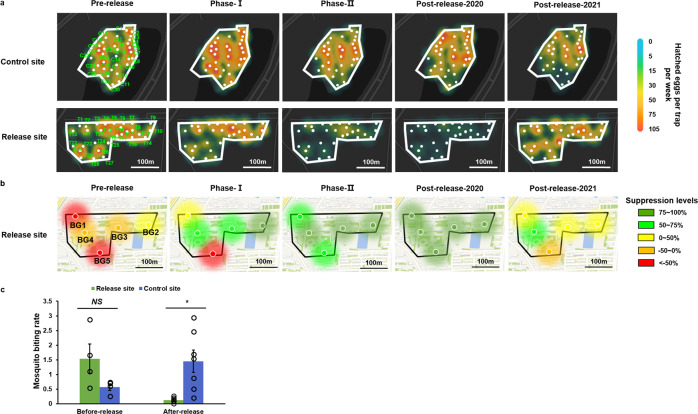
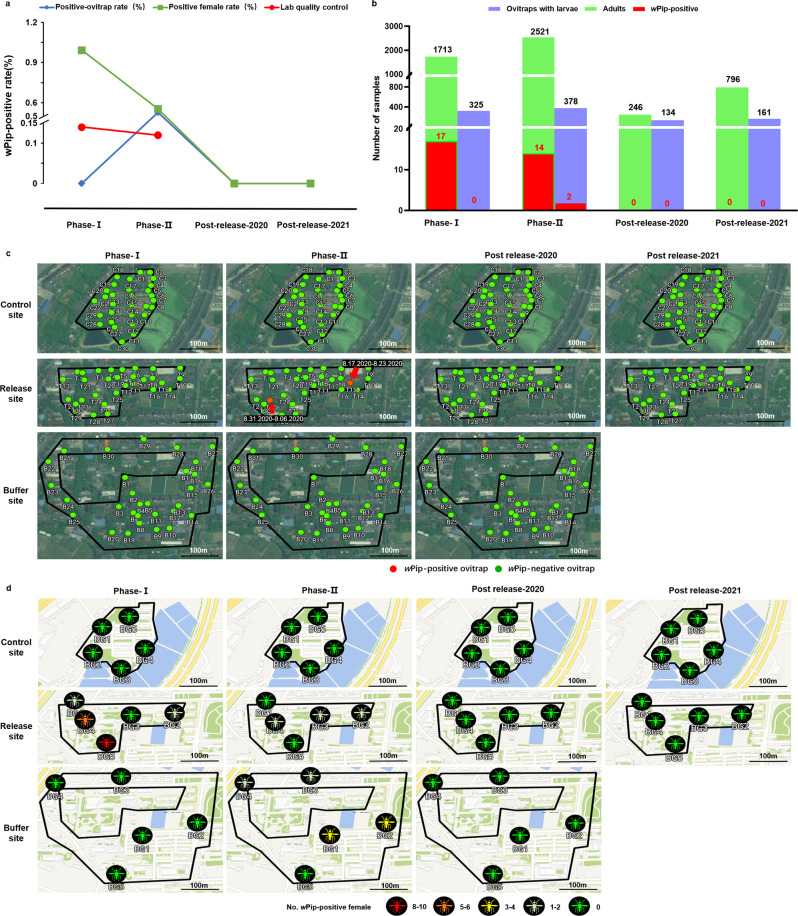
The strong suppression of Aedes albopictus on two Guangzhou islands in China has been successfully achieved by releasing males with an artificial triple-Wolbachia infection. However, it requires the use of radiation to sterilize residual females to prevent population replacement. To develop a highly effective tool for dengue control, we tested a standalone incompatible insect technique (IIT) to control A. albopictus in the urban area of Changsha, an inland city where dengue recently emerged. Male mosquitoes were produced in a mass rearing facility in Guangzhou and transported over 670 km under low temperature to the release site. After a once-per-week release with high numbers of males (phase I) and a subsequent twice-per-week release with low numbers of males (phase II), the average numbers of hatched eggs and female adults collected weekly per trap were reduced by 97% and 85%, respectively. The population suppression caused a 94% decrease in mosquito biting at the release site compared to the control site. Remarkably, this strong suppression was achieved using only 28% of the number of males released in a previous trial. Despite the lack of irradiation to sterilize residual females, no triple-infected mosquitoes were detected in the field post release based on the monitoring of adult and larval A. albopictus populations for two years, indicating that population replacement was prevented. Our results support the feasibility of implementing a standalone IIT for dengue control in urban areas.


Conflict of interest statement

R.G., Y.L., W.Q., J.Z., and Z.X. are affiliated with Guangzhou Wolbaki Biotech Co., Ltd. The other authors declare that they have no competing interests.

Figures

Fig. 1
Fig. 1. Field sites, mosquito baseline density, and weather data.
a Annual number of dengue cases reported in Hunan Province from 2010 to 2019. Breteau Index in Changsha, Hunan in 2018 (b) and 2019 (c) provided by the Hunan CDC. The red dotted line represents the predicted Breteau Index threshold level of 20 with a high risk for dengue transmission according to the guidelines from the China CDC. The data of dengue cases reported in Hunan Province from 2010-2019 and Aedes data were obtained from the Chinese National Notifiable Infectious Disease Reporting Information System (CNNDS) and the National Bureau of Statistics of China by request, respectively, which are presented in the Supplementary Data 1. d The control, release and buffer sites are shaded yellow, purple, and blue, respectively, for the urban areas located in Furong District of Changsha. e The distribution of adult BG traps and ovitraps at the release, buffer and control sites. BG shows the BG traps. T, B, and C represent the ovitraps located at the release, buffer, and control sites, respectively. f Satellite images for the control, release and buffer sites. g Total amount of precipitation weekly in Furong district of Changsha from June 21, 2020, to November 22, 2020 is presented as the red line scaled according to the left y-axis. The average number of females per trap per 24 h is presented at the control (blue line) and release sites (green line). The 95% confidence interval of female number at control (blue shading) and release sites (green shading) are scaled according to the right y-axis (n = 30 independent trap samples per collection day from June 21, 2020, to November 22, 2020). The total precipitation in the prior week has correlation with average number of females per trap at control site (Pearson correlation: r = 0.4871, weekly total precipitation: n = 20, control site: n = 20, P = 0.0294) but has no correlation with the average number of females per trap in release site (Pearson correlation: r = 0.4625, weekly total precipitation: n = 18, release site: n = 18, P = 0.0553). h The weekly temperature at Changsha from June 21, 2020, to November 22, 2020 is indicated as the orange line with weekly mean minimum and maximum temperatures in Celsius shaded in light orange. The temperature and precipitation data of Furong district in the past 24 h were recorded every day at 16:00 from Weather app (data source: The Weather Channel, https://weather.com).
Fig. 2
Fig. 2. Maximum likelihood phylogenetic analysis of HC and field A. albopictus.
The maximum likelihood phylogenetic tree of the mitochondrial COI gene from A. albopictus collected in China (a) and the mitochondrial ND5 gene of A. albopictus collected in Hunan and Guangdong Provinces (b). The Genbank accession number, gene haplotype (H1-H25 for mitochondrial COI gene, H1-H8 for mitochondrial ND5 gene), and available location of mosquito sample for reference sequences are marked in black color. GZ-HC highlighted in brown color represents the HC line of A. albopictus produced in the mass-rearing facility in Guangzhou. The CS-Release site in green color and CS-Control site in blue color indicate the wild A. albopictus captured from the release site and control site in Changsha city, respectively, each month from June 2020 to October 2020. The GenBank accession numbers for mitochondrial ND5 (OP897744-OP897760) and COI (OP899376-OP899392) genes are listed after the sample names in the phylogenetic tree.
Fig. 3
Fig. 3. HC mosquito transportation, release route, release number, and mating competitiveness.
a Transportation of HC mosquitoes from the mosquito factory to the release site. b The route for release in the field. The small yellow dots indicate the start and end of release route. The concentric circles present the release spots on the release route. c The number of HC males released weekly and the survival rate of HC males at the time of release. The survival rate (red line) is expressed as the proportion of HC males surviving at the release time among the total individuals in the release containers. d The ratios of HC males to wild-type males of A. albopictus at the release site, calculated using the total number of HC (Release, blue line) and wild male (Wide, yellow line) mosquitos collected from all the BG traps per 24 h in the release site, based on assay of Wolbachia wPip infection via qPCR. The red dashed line represents the target ratio of 5:1 to reach effective suppression based on previous studies. e HC male mating competitiveness. The median of weekly CIS indexes in each release phase are shown as the horizontal line with error bar of 95% confidence interval of weekly CIS indexes. Each weekly CIS index value is shown as a red circle. Two-sided Mann–Whitney test, Phase-I: release site: n = 5, control site: n = 5, P = 0.1734; Phase-II: release site: n = 8, release site: n = 8, P = 0.0062**.
Fig. 4
Fig. 4. Suppression of egg hatching and female adults by HC release.
a The number of hatched eggs of A. albopictus per trap and suppression efficiency at the release site compared to the control site. The blue and green solid lines indicate the average number of hatched eggs (trap−1 week−1) in the control and release sites, respectively. The red dashed line presents the suppression efficiency of the release site compared to the control site. Each light blue and light green circle corresponding to a number of hatched eggs from an individual retrieved ovitrap in control site and release site, respectively. Two-sided Mann–Whitney test, pre-release phase: Release site: n = 90, Control site: n = 90, P = 0.9269; phase I: Release site: n = 143, Control site: n = 148, P = 0.0119; phase II: Release site: n = 269, Control site: n = 262, P = 5.5047 × 10−14; post-release phase-2020: Release site: n = 90, Control site: n = 89, P = 2.7849 × 10−10; post-release phase-2021: Release site: n = 147, Control site: n = 150, P = 0.1524. The vertical dotted lines indicate the interval of each release phase. b The number of females per trap per 24 h at the release site (light green circle) and control site (light blue circle). The green and blue solid line represent the average number of females per trap per 24 h in the release and control sites, respectively. The red dotted line indicates the suppression efficiency at release sites relative to control sites. Two-sided Mann–Whitney test, pre-release phase: Release site: n = 30, Control site: n = 30, P = 0.9441; phase I: Release site: n = 25, Control site: n = 25, P = 0.0391; phase II: Release site: n = 45, Control site: n = 45, P = 7.1467 × 10−10; post-release phase-2020: Release site: n = 15, Control site: n = 15, P = 0.0294; post-release phase-2021: release site: n = 25, control site: n = 25, P = 0.161. c Release schedule. The date on x-axis is the starting date of monitoring via ovitraps (a) and BG traps (b). The error bars present the standard error of mean.
Fig. 5
Fig. 5. Spatial dynamics of larval and adult population suppression.
a Spatial-temporal dynamics of weekly hatched eggs per trap at the release site and control site for each release phase. The white dots indicate the location of the ovitrap at the release site and control site. The different color indicates the average number of weekly hatched eggs for each trap during each phase. b Spatial-temporal dynamics of suppression on A. albopictus female adults at the release site for each release phase. c Reduction in mosquito biting. Mosquito human landing catches in the release and control sites. Data are shown as the means ± SEMs. Before-release: June 21, 2020–July 6, 2020; After-release: July 6, 2020–November 1, 2020. Two-sided paired t test, Before-release, t = 1.778, release site: n = 4, control site: n = 4, 3 degrees of freedom, P = 0.1734; After-release, t = 3.565, release site: n = 7, control site: n = 7, 6 degrees of freedom, P = 0.0119*.
Fig. 6
Fig. 6. The presence and spatial-temporal dynamics of wPip-positive samples in the field.
a Comparison of the wPip-positive female rates detected in HC males in the mass-rearing facility (laboratory quality control) and the positive female rate monitored in the adults collected via BG traps as well as the wPip-positive rate of ovitraps from the field sites. b The wPip-positive females and larvae detected in the field. Ovitraps with larvae: the number of retrieved ovitraps containing eggs that were hatched to larvae in the laboratory; Adults: the number of adult A. albopictus collected via BG traps; wPip-positive: the number of wPip-positive female adult or pooled larva samples. c Spatial distribution of wPip-positive larvae collected from the control site, release site and buffer site, shown as red dots and marked with the collection time in the format of “Month-Day-Year”. d Spatial distribution of wPip-positive adult females collected from the release site, control site and buffer site, shown as mosquito symbols and colored according to the number of wPip-positive females. No significant difference in the weekly number of wPip-positive females (two-sided Mann–Whitney test, phase-I: n = 5, phase-II: n = 9, P = 0.1069) and larvae (two-sided Mann–Whitney test, phase-I: n = 5, phase-II: n = 9, P = 0.5055) was observed in phase II compared to phase I at the release site and buffer site, and there was no evidence that the number of wPip-positive female and larvae mosquitoes increased over time. Phase I: July 6, 2020–August 10, 2020; Phase II: August 10, 2020–October 12, 2020; Post-release-2020: October 12, 2020–November 1, 2020; Post-release-2021: May 2021 to September 2021.

References

    1. Guzman MG, Harris E. Dengue. Lancet. 2015;385:453–465. doi: 10.1016/S0140-6736(14)60572-9. - DOI - PubMed
    1. World Health Organization. Global strategy for dengue prevention and control 2012-2020. https://www.who.int/publications/i/item/9789241504034 (accessed 22 Aug 2012).
    1. Brady OJ, Hay SI. The Global Expansion of Dengue: How Aedes aegypti Mosquitoes Enabled the First Pandemic Arbovirus. Annu. Rev. Entomol. 2020;65:191–208. doi: 10.1146/annurev-ento-011019-024918. - DOI - PubMed
    1. World Health Organization. Dengue vaccine: WHO position paper—September 2018. https://www.who.int/publications/i/item/WER9335-457-476 (accessed 7 Sep 2018).
    1. Hoffmann A. Wolbachia. Curr. Biol. 2020;30:R1113–R1114. doi: 10.1016/j.cub.2020.08.039. - DOI - PubMed

Publication types