Review
. 2022 Dec 28;9(1):21.
doi: 10.1186/s40348-022-00153-z.

Non-invasive pediatric cardiac imaging-current status and further perspectives

Affiliations
Review

Non-invasive pediatric cardiac imaging-current status and further perspectives

Meinrad Beer et al. Mol Cell Pediatr. .

Abstract

Background: Non-invasive cardiac imaging has a growing role in diagnosis, differential diagnosis, therapy planning, and follow-up in children and adolescents with congenital and acquired cardiac diseases. This review is based on a systematic analysis of international peer-reviewed articles and additionally presents own clinical experiences. It provides an overview of technical advances, emerging clinical applications, and the aspect of artificial intelligence.

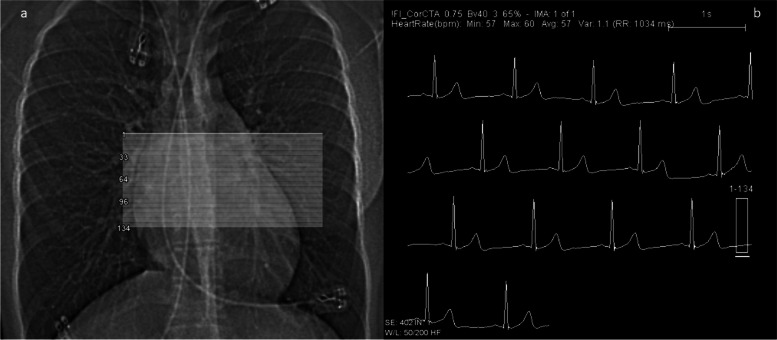
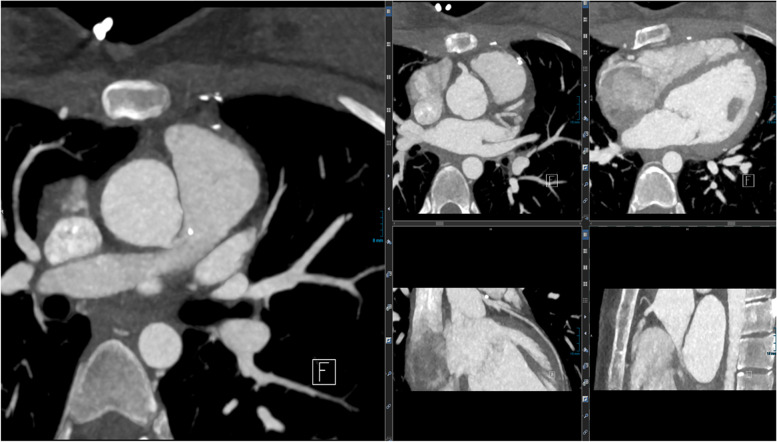
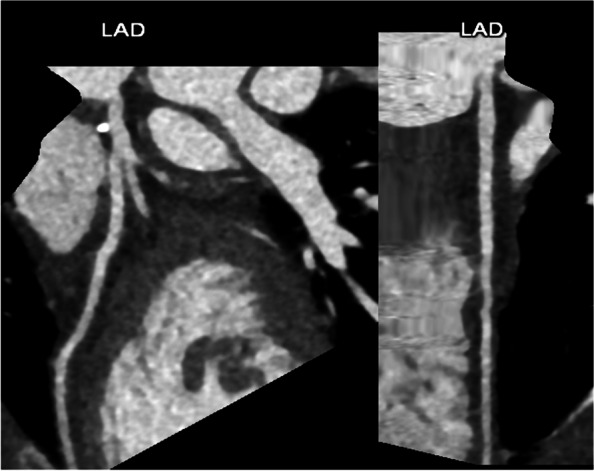
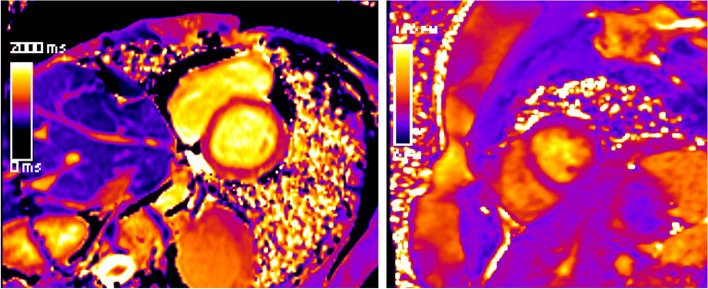
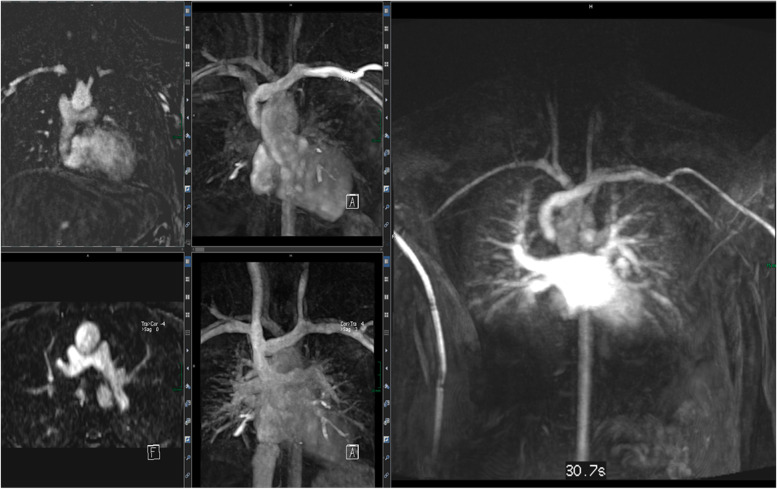
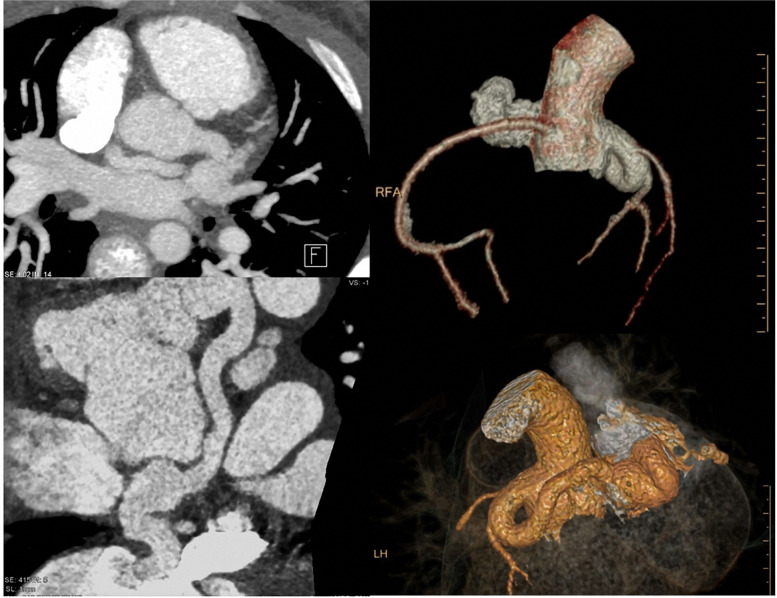
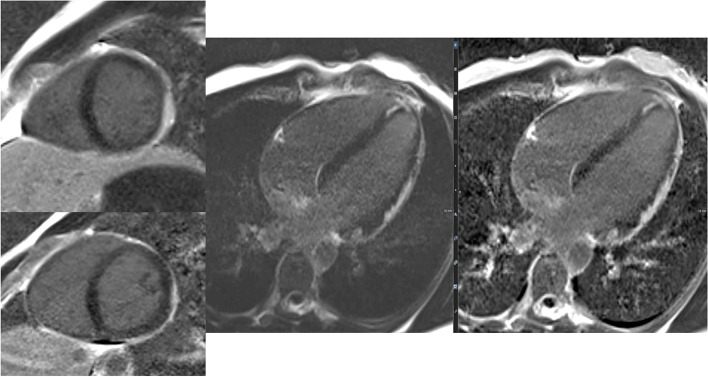
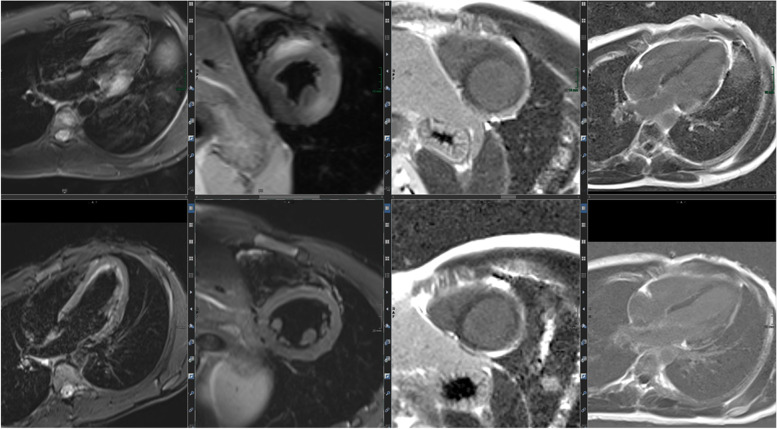
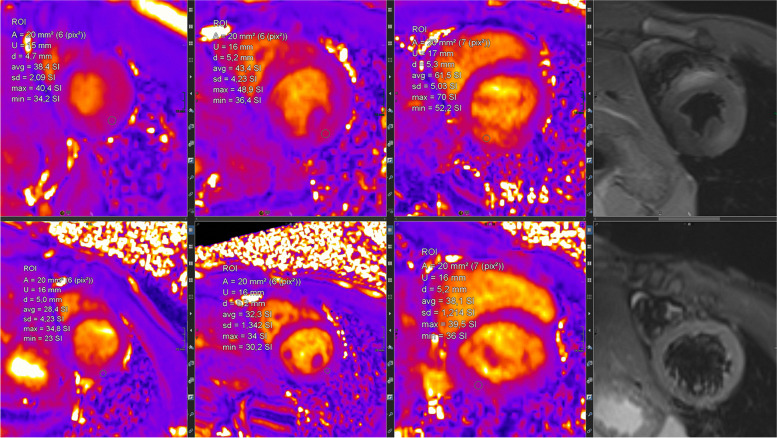
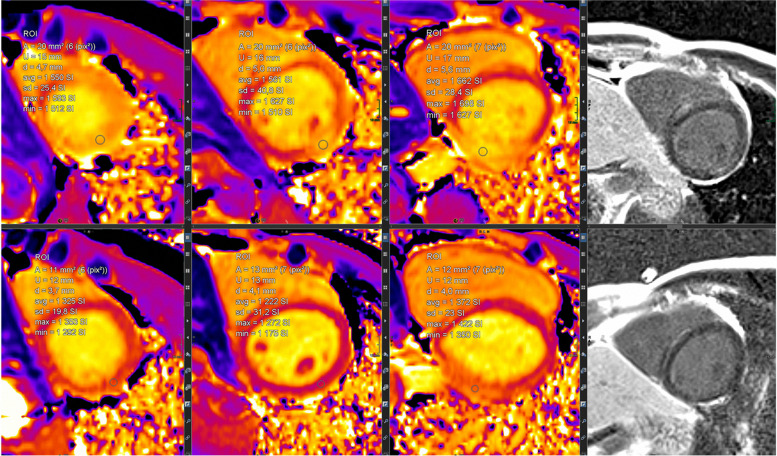
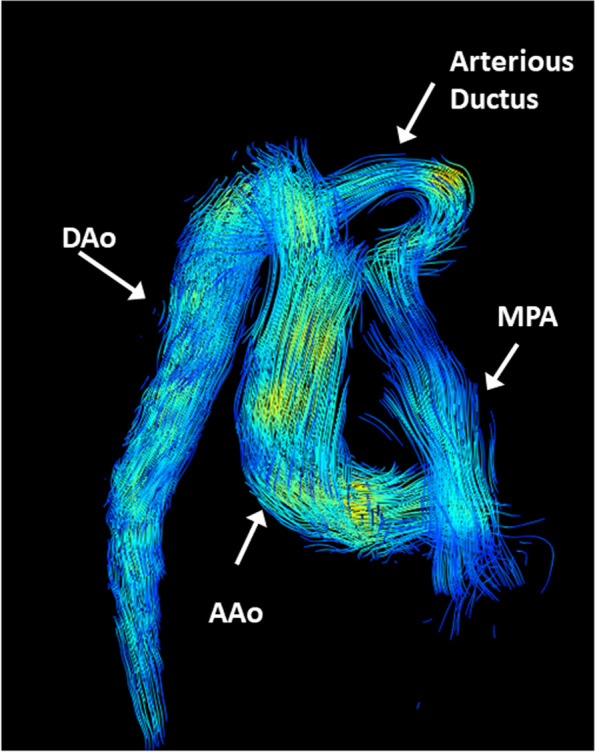
Main body: The main imaging modalities are echocardiography, CT, and MRI. For echocardiography, strain imaging allows a novel non-invasive assessment of tissue integrity, 3D imaging rapid holistic overviews of anatomy. Fast cardiac CT imaging new techniques-especially for coronary assessment as the main clinical indication-have significantly improved spatial and temporal resolution in adjunct with a major reduction in ionizing dose. For cardiac MRI, assessment of tissue integrity even without contrast agent application by mapping sequences is a major technical breakthrough. Fetal cardiac MRI is an emerging technology, which allows structural and functional assessment of fetal hearts including even 4D flow analyses. Last but not least, artificial intelligence will play an important role for improvements of data acquisition and interpretation in the near future.

Conclusion: Non-invasive cardiac imaging plays an integral part in the workup of children with heart disease. In recent years, its main application congenital heart disease has been widened for acquired cardiac diseases.

Keywords: Artificial intelligence; Cardiac CT and MRI; Children and adolescents; Congenital heart disease; Echocardiography; Fetal cardiac MRI; Myocarditis; Non-invasive cardiac imaging; Pediatric cardio-oncology; Recent advances.


Conflict of interest statement

The authors declare that they have no competing interests.

Figures

Fig. 1
Fig. 1
2D strain imaging allows the assessment of global and regional function based on the determination of qualitative and quantitative parameters (longitudinal, radial, circumferential strain): vendor-independent analysis software tools (such as the Tomtec 2D-CPA analysis) visualize LV myocardium, strain curves, and summarize the results in “bull-eye” plots, generating a fast and comprehensive overview on cardiac function
Fig. 2
Fig. 2
(Planning and dose monitoring): first steps are a fast low-dose overview (“topogram/sinogram”; left) and a stable ECG monitoring (right) for triggering (prospective mode) or gating (retrospective mode). Figures 2 and 3 derive from the CT of a 15-year-old girl after surgical repair of a malignant coronary anomaly (origin of the left main from the right coronary sinus) with reinsertion of the left main coronary artery with an ultra-low radiation dose (total DLP 9 mGycm ~ 0.2 mSv)
Fig. 3
Fig. 3
(Representative images for the primary CT datasets): based on primary axial planes (left), different positions in long-axis heart orientation (right upper row) and parasagittal orientation (right lower row) are depicted. Currently, these standard projections are reconstructed by specifically trained technicians; increasingly AI-based algorithms take over these time-consuming tasks
Fig. 4
Fig. 4
(2D postprocessing): automatically 2D recontructions of the three main coronary arteries are generated, here the LAD in curved (left) and straight (right) MIP projections; this allows a rapid assessment at first sight and facilitates the review of finding by the referring physicians
Fig. 5
Fig. 5
(Functional imaging): assessment of cinematographic (“CINE”) images allows a rapid overview of global and regional functions comparable to echocardiography. Standard are planned projections in the long- and short-heart axis. Here, images of a 12-year-old girl with follow-up after multisystem inflammatory syndrome in children (PIMS) are presented: a 4-chamber view in diastole (left upper row) and systole (left lower row) and a 2-chamber view also in diastole (middle) and systole (right)
Fig. 6
Fig. 6
(Tissue integrity assessment by T2 and LGE imaging): the capability of a non-invasive complete assessment of tissue integrity (edema yes/no, fibrosis yes/no) is one of the hallmarks of MRI. Healthy myocardium shows a dark (“hypointense”) signal in T2 imaging (first two images in the left upper row) as well as a dark signal in LGE imaging (right upper row LGE-SAX in IR and PS reconstruction; lower row—LV 2CV- and 4 CV-LGE)
Fig. 7
Fig. 7
(Mapping technologies): qualitative (based on color maps) and quantitative (based on signal intensities) assessment is possible; in comparison to values of healthy cohorts, increased T2 values indicate myocardial edema and increased T1 values indicate fibrosis; here, healthy myocardium is depicted for SAX-T2- (left) and pre-contrast (“native”) T1 mapping (right) in midventricular position
Fig. 8
Fig. 8
(Functional imaging): a 4-chamber view and axial CINE allow the measurement of the size of the ASD (diameters) plus the illustration of concomitant “jets” (increased and turbulent flow produces hypointense blood signals)
Fig. 9
Fig. 9
(MRA): time-resolved contrast-enhanced MRA in coronal and transversal reconstructions (MIP projections) allow a complete overview of the anatomy of large vessels and the monitoring of shunting (left-right; right-left)
Fig. 10
Fig. 10
(2D flow): left–right shunting due to the ASD. Flow is depicted morphologically (“magnitude images,” left lower row) and hemodynamically (“phase-images, left upper row and middle lower row”); the latter allows a quantitative assessment of velocities, directions, and flow profiles (upper row in the middle)
Fig. 11
Fig. 11
(Functional and anatomic imaging by CINE): 4CV, 3CV, 2CV, and axial CINE show the enlarged and hypertrophied LV as well as the TCPC
Fig. 12
Fig. 12
(MRA): connection between VCS, VCI, and right pulmonary artery. The 4 smaller images show the connections (upper and lower images on the left as single images in high resolution; upper and lower images in the middle as thicker MIPs for an overview). The right larger image is one data set of the MR angiography, which gives an idea about pulmonary blood flow
Fig. 13
Fig. 13
(Planning, dose monitoring (left upper and lower row), axial and paracoronar 2D MIP reconstructions (middle), and 3D VRT reconstructions (right)): 11-year-old girl. Previous surgical repair of a VSD. Now suspected (echocardiography—not shown) coronary fistula. CTCA with dose reduction software, resulting in a low radiation dose (total DLP 63 mGycm ~ 0.8 mSv). CT allows a complete and rapid representation of even highly complex anatomic alterations (in one breathhold)
Fig. 14
Fig. 14
(LGE imaging): SAX (left upper and lower row) and 4-chamber view in IR (middle) and PS (right) reconstructions show an increased subepicardial signal of the left lateral wall, partly including mid-wall parts of the LV myocardium
Fig. 15
Fig. 15
(Mapping): T2 map (left) anteroseptally 37–40 ms; inferolaterally 49–56 ms, T1 map prä KM (right) anteroseptally 1278 ms; inferolaterally 1263 ms. The color maps allow a rapid assessment of edema and inflammation/fibrosis plus the quantification (in regions, which are conspicuous in LGE and/or maps)
Fig. 16
Fig. 16
(T2 and LGE imaging during follow-up): upper row—baseline; lower row—follow-up 10 weeks later. Complete normalization of increased T2 signal in septal and lateral myocardium accompanied by a slight decrease of LGE with the typical subepicardial predominance. Loss of edema signal in conjunct with decreased LGE signal suggests an end of the active inflammatory phase with ongoing repair in altered myocardium
Fig. 17
Fig. 17
(T2 mapping during follow-up): normalization of initially increased signal intensities in septal LV myocardium (upper row—baseline with 38–62 ms; lower row—follow-up with 28–38 ms). This further supports the mentioned post-acute myocarditis stage
Fig. 18
Fig. 18
(T1 mapping during follow-up): normalization of initially increased signal intensities in anteroseptal LV myocardium (upper row—baseline with 1550/1561/1662 ms; lower row—follow-up with 1325/1222/1372 ms). The likewise changes of T2 and LGE signal plus T2 as well as T1 maps strongly support the outlined clinical perception
Fig. 19
Fig. 19
(Four-chamber view in a late gestational healthy fetus): illustrating diastolic (left) and systolic (right) phases using Doppler ultrasound gated cardiac MRI. Ovale foramen as the physiological atrial shunt in the prenatal period is visualized in both diastolic and systolic phases. Motion artifacts (due to missing ECG triggering) normally blur cardiac contours in standard fetal MRI images
Fig. 20
Fig. 20
(4D flow MRI): characterization of flow dynamics of the great thoracic vessels (oblique antero-lateral view) in a healthy preterm fetus. Blood flow direction and velocity are indicated by velocity-coded streamlines (DAo descending aorta, AAo ascending aorta, MPA main pulmonary artery, ductus arteriosus). The advent of 4D techniques simplified the demonstration and understanding of even complex vascular anomalies

References

    1. Page MJ, McKenzie JE, Bossuyt PM, et al. The PRISMA 2020 statement: an updated guideline for reporting systematic reviews. BMJ. 2021;372:n71. doi: 10.1136/bmj.n71. - DOI - PMC - PubMed
    1. Mitchell C, Rahko PS, Blauwet LA, C, , et al. Guidelines for performing a comprehensive transthoracic echocardiographic examination in adults: recommendations from the American Society of Echocardiography. J Am Soc Echocardiogr. 2019;32:1–64. doi: 10.1016/j.echo.2018.06.004. - DOI - PubMed
    1. von Scheidt F, Kiesler V, Kaestner M, et al. Left ventricular strain and strain rate during submaximal semisupine bicycle exercise stress echocardiography in healthy adolescents and young adults – systematic protocol and reference values. J Am Soc Echocardiogr. 2020;33:848–857.e1. doi: 10.1016/j.echo.2019.12.015. - DOI - PubMed
    1. von Scheidt F, Pleyer C, Kiesler V et al (2022) Left ventricular strain analysis during submaximal semisupine bicycle exercise stress echocardiography in childhood cancer survivors. J Am Heart Assoc 11(14):e025324. 10.1161/JAHA.122.025324 - PMC - PubMed
    1. Spanaki A, Kabir S, Stephenson N, et al. 3D approaches in complex CHD: where are we? Funny printing and beautiful images, or a useful tool? J Cardiovasc Dev Dis. 2022;9(8):269. doi: 10.3390/jcdd9080269. - DOI - PMC - PubMed

LinkOut - more resources