. 2022 Dec 27;6(1):94.
doi: 10.1038/s41698-022-00335-y.

Drug sensitivity profiling of 3D tumor tissue cultures in the pediatric precision oncology program INFORM

Affiliations

Drug sensitivity profiling of 3D tumor tissue cultures in the pediatric precision oncology program INFORM

Heike Peterziel et al. NPJ Precis Oncol. .

Abstract

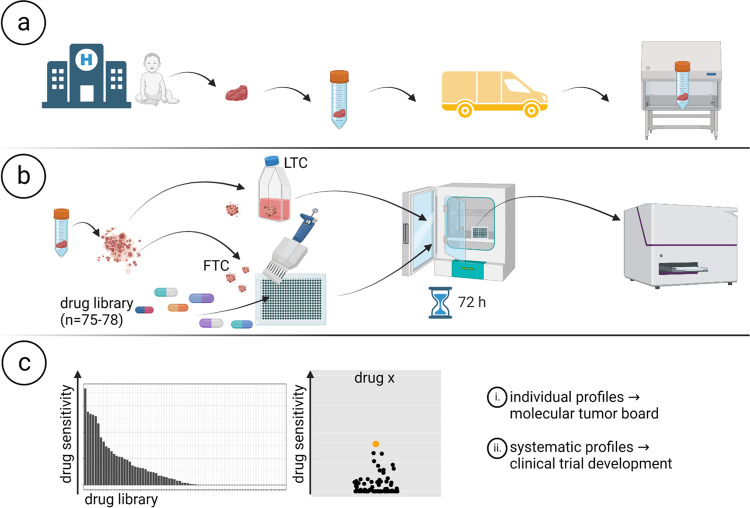
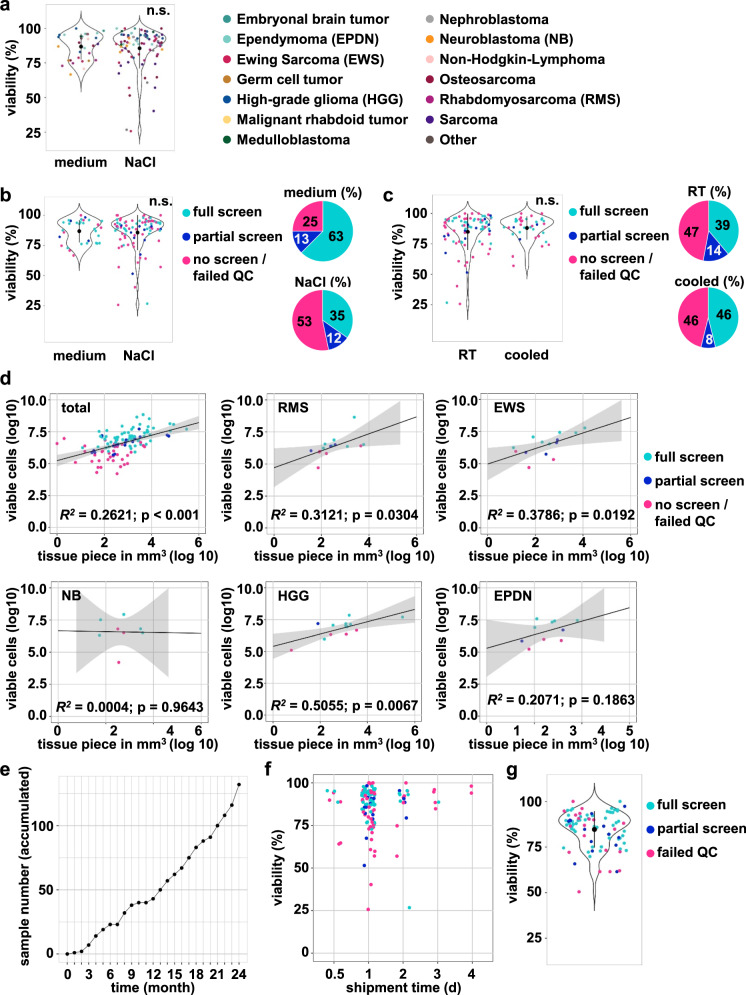
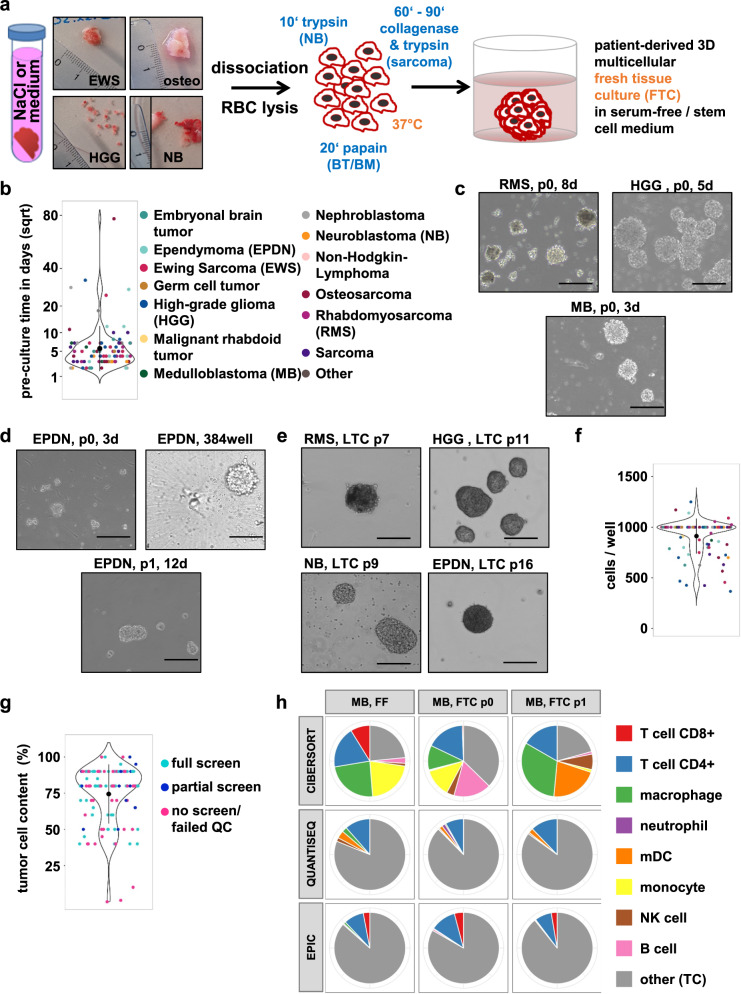
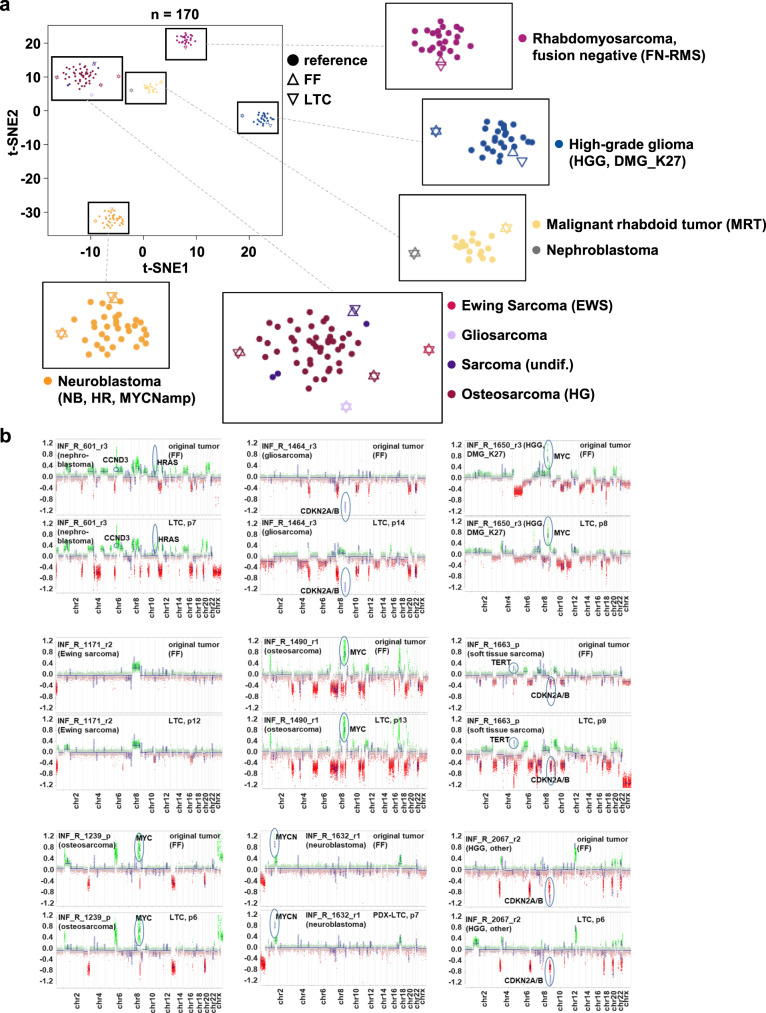
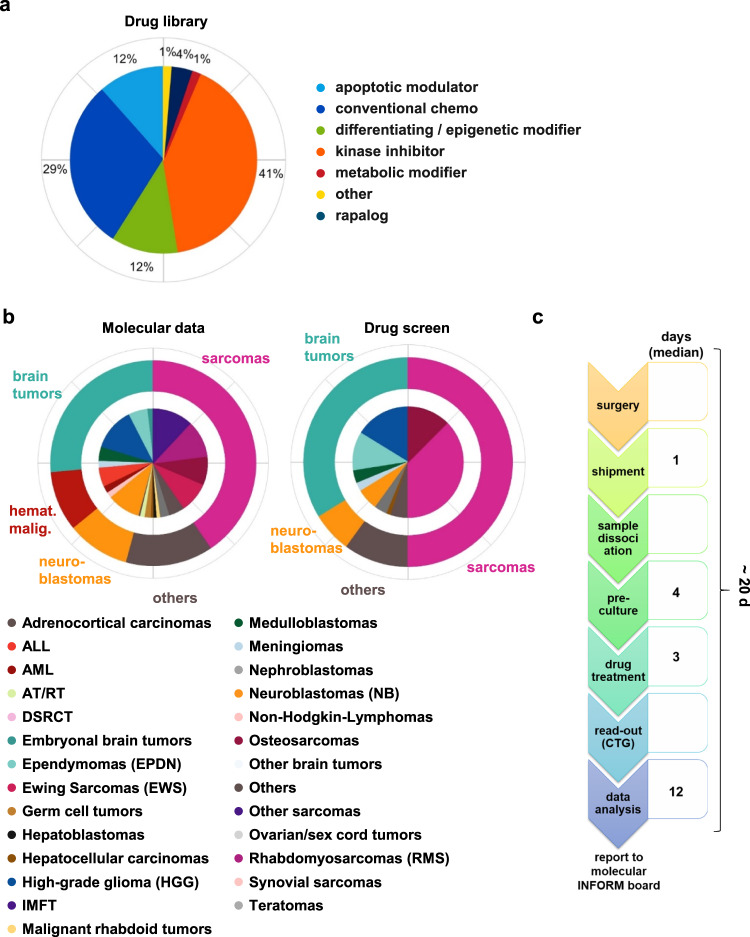
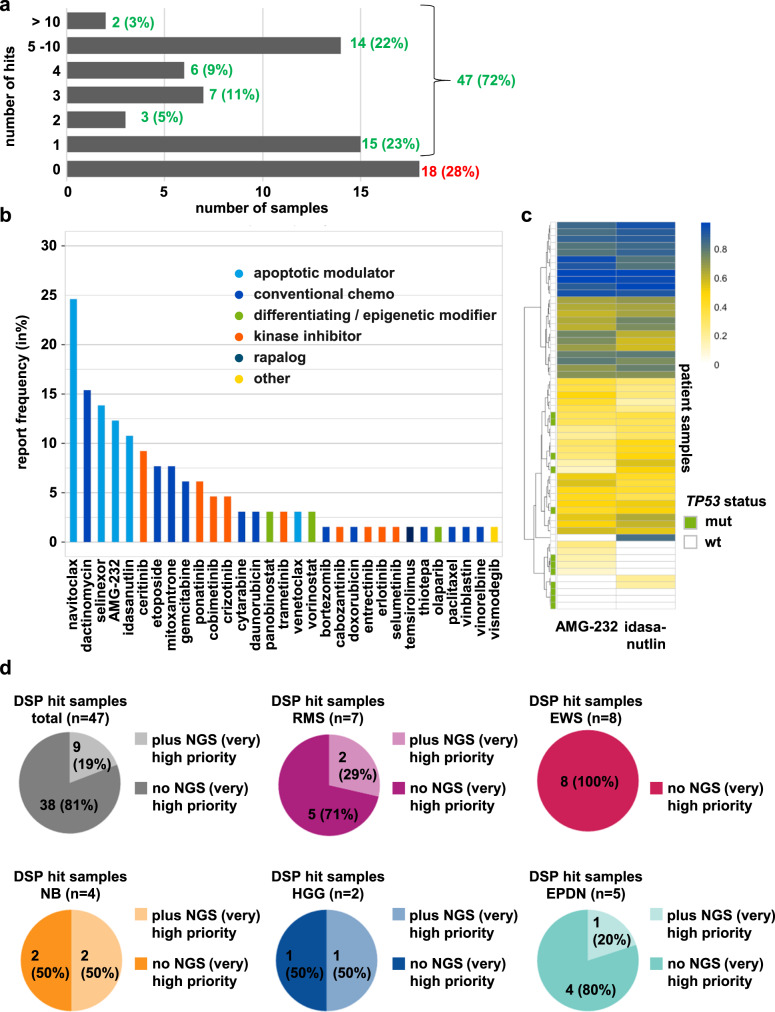
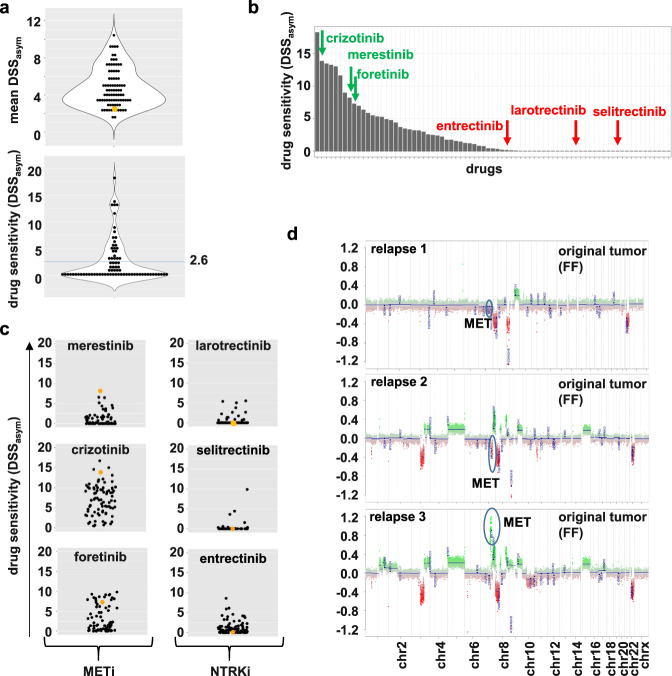
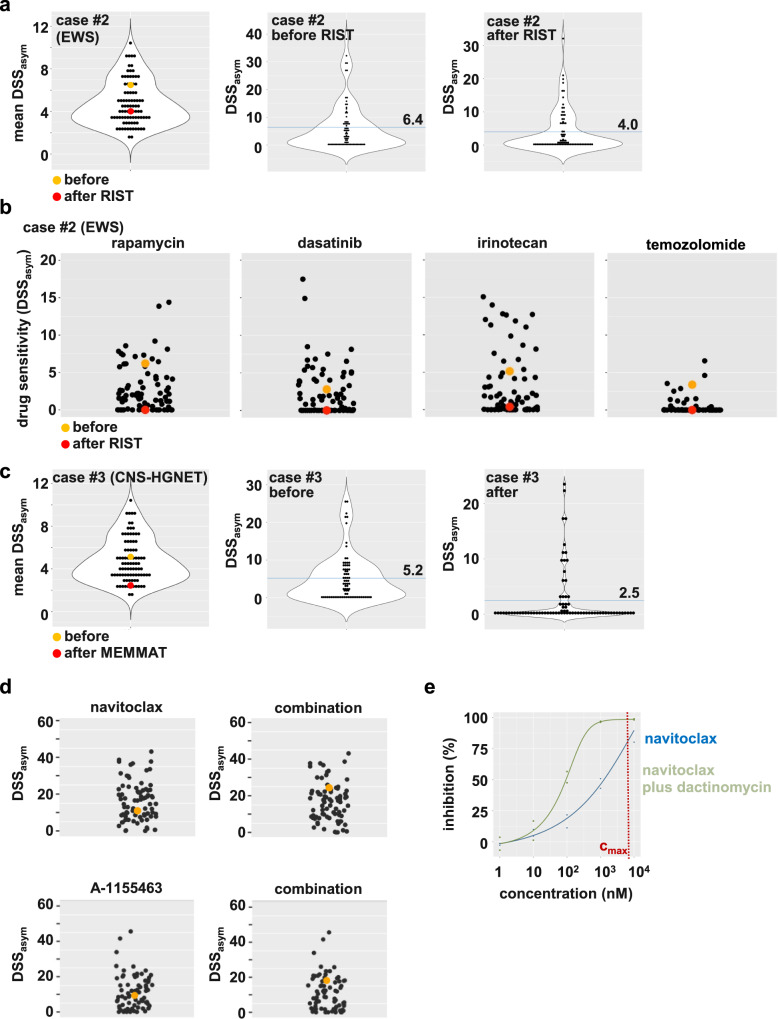
The international precision oncology program INFORM enrolls relapsed/refractory pediatric cancer patients for comprehensive molecular analysis. We report a two-year pilot study implementing ex vivo drug sensitivity profiling (DSP) using a library of 75-78 clinically relevant drugs. We included 132 viable tumor samples from 35 pediatric oncology centers in seven countries. DSP was conducted on multicellular fresh tumor tissue spheroid cultures in 384-well plates with an overall mean processing time of three weeks. In 89 cases (67%), sufficient viable tissue was received; 69 (78%) passed internal quality controls. The DSP results matched the identified molecular targets, including BRAF, ALK, MET, and TP53 status. Drug vulnerabilities were identified in 80% of cases lacking actionable (very) high-evidence molecular events, adding value to the molecular data. Striking parallels between clinical courses and the DSP results were observed in selected patients. Overall, DSP in clinical real-time is feasible in international multicenter precision oncology programs.


Conflict of interest statement

C.M.v.T. and I. Øra participated in the advisory boards of Novartis and Bayer. S.M.P. receives funding from Bayer, Pfizer, Eli-Lilly, Roche, Amgen, Astra Zeneca, PharmaMar, Sanofi and Servier in the context of an IMI-2-funded EU project entitled ITCC-P4 (www.itccp4.eu). M.S.-S. participated in advisory boards of SOBI, Roche and Bayer (hemophilia) and receives funding from Bayer for providing data on patients with NTRK-positive infantile fibrosarcoma as a historical cohort. O.W. participated in the advisory boards of Novartis, BMS and Janssen and received research grants from BVD, Day One Therapeutics. The remaining authors declare no competing interests.

Figures

Fig. 1
Fig. 1. Workflow of INFORM personalized drug sensitivity profiling. Created with BioRender.com.
a Sample collection and shipment. b Generation of patient-derived ex vivo fresh tissue spheroid cultures (FTCs) and treatment with a drug library. Readout: metabolic activity. c Data collection, analysis and preparation of drug sensitivity reports.
Fig. 2
Fig. 2. Assessment of shipment conditions and tissue viability.
a Effect of sample shipment in 0.9% NaCl versus medium on sample viability, measured with automated viable and dead cell counting (ViCell or Cellometer). The color code on the right reflects the different tumor diagnoses. The black dots indicate the mean, error bars reflect SD. Students t-test (two-sided). b Violin plot: Effect of sample shipment in 0.9% NaCl versus cell culture medium on sample viability. Colors indicate screen type (full, meaning all three plates versus partial, meaning 1–2 plates versus no screen/screen that failed QC). The black dots indicate the mean, error bars reflect SD. Students t-test (two-sided). Pie diagrams: percentage of samples per screen type for samples shipped in 0.9% NaCl or medium. The color code in the middle reflects the screen type. c Violin plot: Effect of sample shipment at room temperature versus cooled on sample viability, with colors indicating the screening type. The black dots indicate the mean, error bars reflect SD. Students t-test (two-sided). Pie diagrams: percentage of samples per screening type for samples shipped at room temperature or code. The color code in the middle reflects the screen type. d Correlation plots calculated after log10 transformation comparing the volume of tissue piece to the viable cell number and the type of screen (full, meaning all three plates versus partial, meaning 1–2 plates versus no screen/screen (full or partial) that failed QC). The gray area represents the confidence intervals. Not all samples are displayed as volume or cell number data were not always available. Statistical method: Pearson correlation with R. e Accumulated incoming sample number of the two-year pilot phase (n = 132). f Effect of transport duration on sample viability, measured with automated viable and dead cell counting (ViCell or Cellometer). The color code reflects the tumor diagnoses as in panel b). g Viability at DSP seeding. The color code reflects the type of screen (full, meaning all three plates versus partial, meaning 1–2 plates versus screen that failed QC). The black dots indicate the mean, error bars reflect SD. EPDN ependymoma, EWS Ewing sarcoma, NB neuroblastoma, HGG high-grade glioma, RMS rhabdomyosarcoma. n.s.: not significant.
Fig. 3
Fig. 3. Dissociation of tumor tissue and characterization of the patient-derived 3D culture models.
a Workflow of incoming tissue processing until the generation of patient-derived 3D multicellular fresh tissue culture (FTC). b Violin dot depicting the preculture time of screened samples in days; the y-axis is square-root transformed (sqrt) to better illustrate the distribution of all data points. The color code reflects the different tumor diagnoses (same as in d). The black dots indicate the mean, error bars reflect SD. c Bright field images (×10 magnification, cropped) for patient-derived 3D FTC precultures (d3, d5, d8) at passage 0. d Bright-field image (×10 magnification, cropped) for a patient-derived 3D culture from the same ependymoma (EPDN) sample at p0 (d3), at drug screen (384-well) and p1. e Bright-field images (×10 magnification, cropped) for patient-derived 3D long-term cultures (>p6, LTC). f Violin dot plot displaying the seeding cell number per well of the screened samples. The color code on the right reflects the different tumor diagnoses. The black dots indicate the mean, error bars reflect SD. g Violin dot plot illustrating the tumor cell content (in percent) of fresh frozen material accompanying the fresh tumor specimen submitted for DSP. The color code reflects the screening type (full, meaning all three plates versus partial, meaning 1–2 plates versus no screen/screen that failed quality control (QC)). The black dots indicate the mean, error bars reflect SD. h Immune cell type deconvolution results from the same medulloblastoma (MB) sample from FF (fresh frozen; original tumor), at p. 0 (directly after dissociation) and p. 1 (seeding time-point) with the most commonly used bulk RNA-seq deconvolution tools: CIBERSORT, QuantiSeq, and EPIC. TC tumor cell.
Fig. 4
Fig. 4. Molecular characterization of the patient-derived 3D culture models.
a t-SNE analysis of DNA methylation profiles for comparison of the original tumors and the corresponding tumor-derived long-term culture (LTC) models with already existing well-characterized reference tumors (malignant rhabdoid tumors, FN-RMS tumors and high-risk (HR) MYCNamp neuroblastomas). b Pairwise comparison of the copy-number profiles of nine tumors (upper panel) and their corresponding LTCs (lower panel) reveal similar genome-wide methylation patterns and maintenance of relevant driver events. FF fresh frozen material of the original tumor, LTC long-term culture, EWS Ewing sarcoma, FN-RMS fusion-negative rhabdomyosarcoma, HGG, DMG_K27M high-grade glioma, subtype K27M mutant diffuse midline glioma HGG, other another subtype of high-grade glioma, MRT malignant rhabdoid tumor, NB, HR, MYCNamp high-risk neuroblastoma with MYCN amplification, osteosarcoma (HG) high-grade osteosarcoma, sarcoma undiff undifferentiated sarcoma. Sample abbreviations: r relapse, p progression.
Fig. 5
Fig. 5. DSP pipeline and cohort overview.
a Composition of the core drug library, consisting of 75–78 drugs. b Cohort overview. Left: Tumor diagnoses of fresh frozen material used for molecular analysis through NGS (n = 1642). Right: Tumor diagnosis distribution in the present cohort of INFORM samples with vital tissue submission. The pie diagrams represent the distribution of the indicated diagnoses within the whole cohort. The outer circles represent broad tumor categories: sarcomas (magenta), brain tumors (green), hematological malignancies (hemat. malig., red), neuroblastomas (orange) and others (brown). The inner circle represents the more detailed tumor diagnoses within each category, as explained in the color code below the pie charts. c Timeline from surgery to drug report for QC-passed full screens and where timeline data were available (n = 49). ALL acute lymphocytic leukemia, AML acute myeloid leukemia, AT/RT atypical teratoid rhabdoid tumor, DSRCT desmoplastic small-round-cell tumor, EPDN ependymoma, EWS Ewing sarcoma, HGG high-grade glioma, IMFT inflammatory myofibroblastic tumor, NB neuroblastoma, RMS rhabdomyosarcoma, QC quality control.
Fig. 6
Fig. 6. Identified drug hits reported to the INFORM molecular tumor board.
a Bar diagram displaying the number of reported hits per sample and in %. b Bar diagram depicting the report frequency (in %) of single drugs and drug classes. Color code integrated. c Unsupervised hierarchical clustering based on DSSasym quantiles for the MDM2 inhibitors AMG-232 and idasanutlin. The color scale shown at the top represents quantile values. The TP53 status is highlighted with green (mutant) and white (wild-type) bars on the left side. d Pie diagrams reflecting the proportion of samples with reported hits with or without reported NGS (very) high-evidence targets for the total DSP cohort and different diagnoses.
Fig. 7
Fig. 7. Case report #1: NTRK fusion-positive high-grade glioma with acquired resistance to NTRKinhibitors due to MET amplification.
a Violin dot plots displaying the mean DSSasym values for the whole cohort (upper graph) and each drug for the respective sample (lower graph; blue line: mean). The sample of interest (here, case #1 relapse 3) is marked in orange. b Waterfall plot sorting all tested drugs for the case #1 relapse 3 sample upon their DSSasym values, starting with the highest on the left. c Dot plots depicting the DSSasym values for the indicated drugs for all successfully screened samples. The sample of interest (here, case #1 relapse 3) is marked in orange. All three MET inhibitors (merestinib, crizotinib, foretinib) show above-average responses, whereas the three NTRK inhibitors all have a DSSasym of or close to 0. d Copy-number profiles of the FF samples reveal an acquired (or selected) MET amp in the plot for relapse 3.
Fig. 8
Fig. 8. Case reports #2 and #3: Evolution of treatment-associated drug resistance in serial sample collections.
a Violin dot plots of case #2, a relapsed EWSR1:FLI1-positive Ewing sarcoma (EWS) before and after RIST therapy. The dot plots display the mean DSSasym values for the whole cohort (left) and each drug for the respective sample before RIST treatment (middle) and after RIST treatment (right). The sample of interest before RIST is marked in orange, and the sample after RIST is marked in red. The blue line represents the mean. b Drug dot plots depicting the DSSasym values for the indicated drugs for all successfully screened samples. The sample of interest before RIST is marked in orange, and the sample after RIST is marked in red. All four drugs displayed a strong decrease in DSSasym after RIST therapy. c Violin dot plots of case #3, a relapsed CNS-HGNET brain tumor. Shown are DSP 1 and DSP 2 before and after MEMMAT therapy. The dot plots display the mean DSSasym values for the whole cohort (left) and each drug for the respective case (DSP 1 in the middle; DSP 2 on the right). The sample of interest DSP1 before MEMMAT is marked in orange, and DSP2 after MEMMAT is marked in red. The blue line represents the mean. d Drug dot plots depicting the DSSasym values for the single treatment (navitoclax or BCL-XL inhibitor A-1155463) and the combination (navitoclax plus dactinomycin or A-1155463 plus dactinomycin). The sample of interest (case #3, CNS-HGNET) is marked in orange. e Dose-response curves of a single compound (navitoclax) and combinatorial treatment (navitoclax plus IC25 10 nM dactinomycin). The overlay of both curves, reflecting a shift in sensitivity upon combinatorial treatment, is depicted. The combination screen was performed with cryopreserved cells cultured for four days after thawing for drug testing. % inhibition: normalized inhibition of metabolic activity.

References

    1. van Tilburg CM, et al. The Pediatric Precision Oncology INFORM Registry: Clinical Outcome and Benefit for Patients with Very High-Evidence Targets. Cancer Discov. 2021;11:2764–2779. doi: 10.1158/2159-8290.CD-21-0094. - DOI - PMC - PubMed
    1. Worst BC, et al. Next-generation personalised medicine for high-risk paediatric cancer patients - The INFORM pilot study. Eur. J. Cancer. 2016;65:91–101. doi: 10.1016/j.ejca.2016.06.009. - DOI - PubMed
    1. Harttrampf AC, et al. Molecular Screening for Cancer Treatment Optimization (MOSCATO-01) in Pediatric Patients: A Single-Institutional Prospective Molecular Stratification Trial. Clin. Cancer Res. 2017;23:6101–6112. doi: 10.1158/1078-0432.CCR-17-0381. - DOI - PubMed
    1. Wong M, et al. Whole genome, transcriptome and methylome profiling enhances actionable target discovery in high-risk pediatric cancer. Nat. Med. 2020;26:1742–1753. doi: 10.1038/s41591-020-1072-4. - DOI - PubMed
    1. Newman S, et al. Genomes for kids: the scope of pathogenic mutations in pediatric cancer revealed by comprehensive DNA and RNA sequencing. Cancer Discov. 2021 doi: 10.1158/2159-8290.CD-20-1631. - DOI - PMC - PubMed