. 2022 Dec 27;54(1):82.
doi: 10.1186/s12711-022-00772-0.

A comparison of marker-based estimators of inbreeding and inbreeding depression

Affiliations

A comparison of marker-based estimators of inbreeding and inbreeding depression

Armando Caballero et al. Genet Sel Evol. .

Abstract

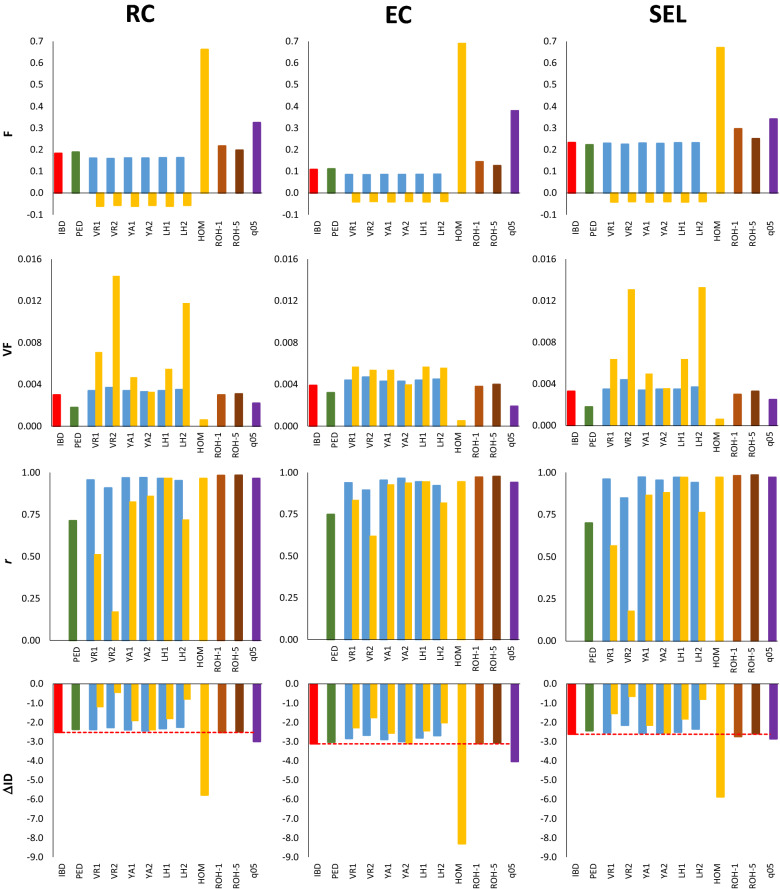
Background: The availability of genome-wide marker data allows estimation of inbreeding coefficients (F, the probability of identity-by-descent, IBD) and, in turn, estimation of the rate of inbreeding depression (ΔID). We investigated, by computer simulations, the accuracy of the most popular estimators of inbreeding based on molecular markers when computing F and ΔID in populations under random mating, equalization of parental contributions, and artificially selected populations. We assessed estimators described by Li and Horvitz (FLH1 and FLH2), VanRaden (FVR1 and FVR2), Yang and colleagues (FYA1 and FYA2), marker homozygosity (FHOM), runs of homozygosity (FROH) and estimates based on pedigree (FPED) in comparison with estimates obtained from IBD measures (FIBD).

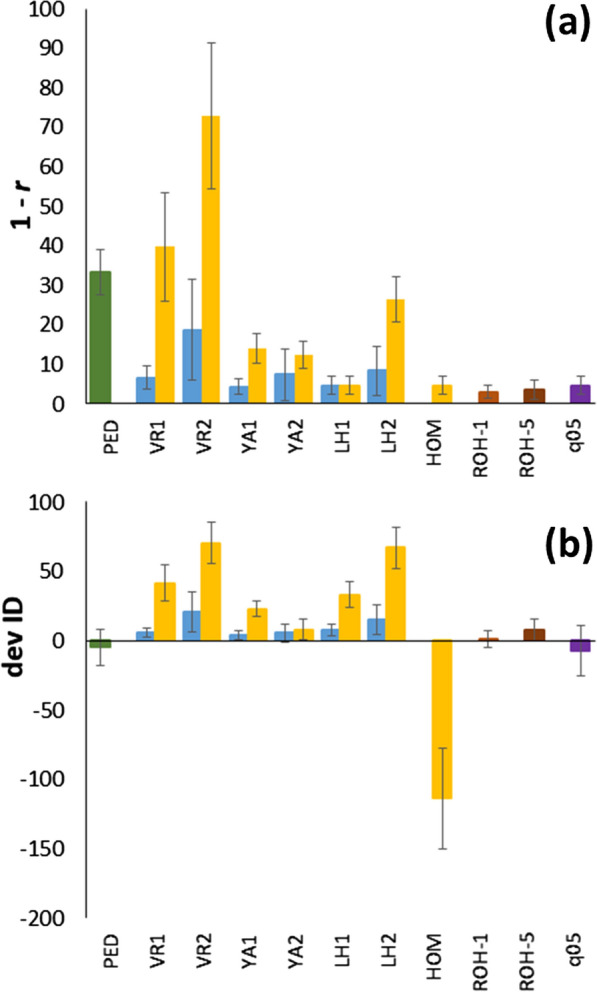
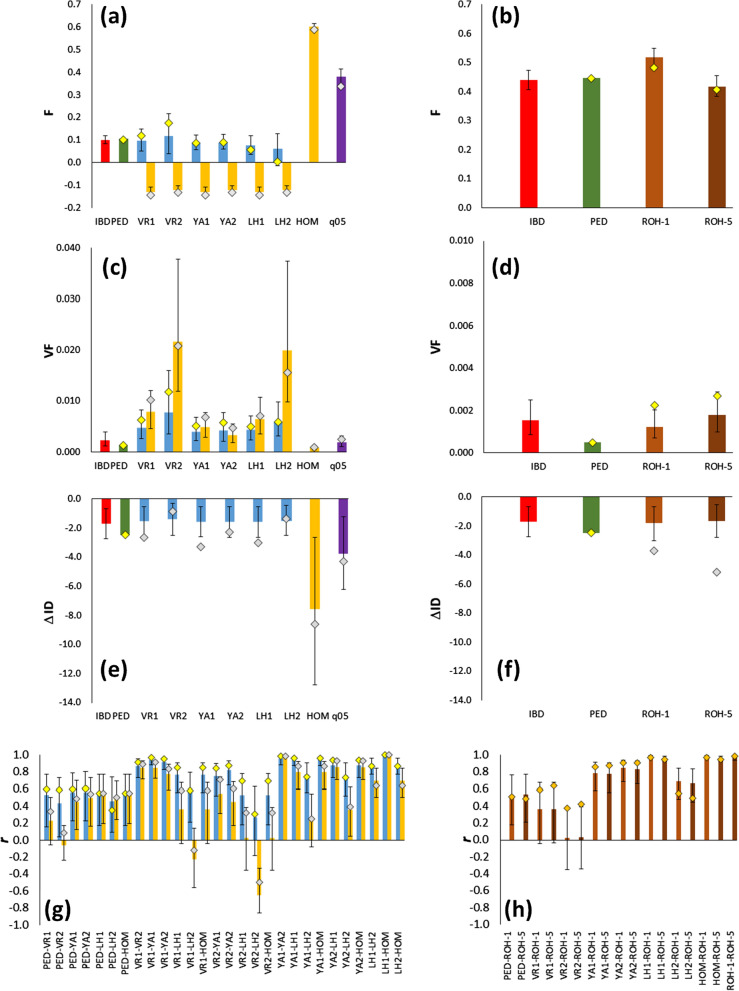
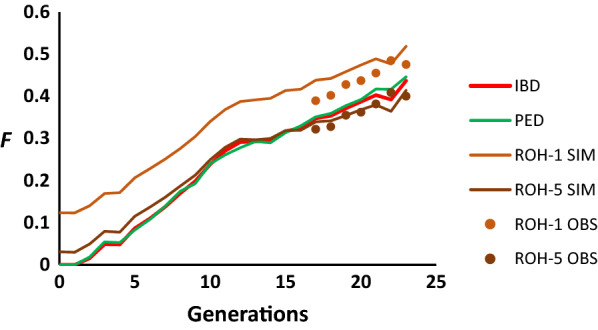
Results: If the allele frequencies of a base population taken as a reference for the computation of inbreeding are known, all estimators based on marker allele frequencies are highly correlated with FIBD and provide accurate estimates of the mean ΔID. If base population allele frequencies are unknown and current frequencies are used in the estimations, the largest correlation with FIBD is generally obtained by FLH1 and the best estimator of ΔID is FYA2. The estimators FVR2 and FLH2 have the poorest performance in most scenarios. The assumption that base population allele frequencies are equal to 0.5 results in very biased estimates of the average inbreeding coefficient but they are highly correlated with FIBD and give relatively good estimates of ΔID. Estimates obtained directly from marker homozygosity (FHOM) substantially overestimated ΔID. Estimates based on runs of homozygosity (FROH) provide accurate estimates of inbreeding and ΔID. Finally, estimates based on pedigree (FPED) show a lower correlation with FIBD than molecular estimators but provide rather accurate estimates of ΔID. An analysis of data from a pig population supports the main findings of the simulations.

Conclusions: When base population allele frequencies are known, all marker-allele frequency-based estimators of inbreeding coefficients generally show a high correlation with FIBD and provide good estimates of ΔID. When base population allele frequencies are unknown, FLH1 is the marker frequency-based estimator that is most correlated with FIBD, and FYA2 provides the most accurate estimates of ΔID. Estimates from FROH are also very precise in most scenarios. The estimators FVR2 and FLH2 have the poorest performances.


Conflict of interest statement

The authors declare that they have no competing interests.

Figures

Fig. 1
Fig. 1
Estimates of inbreeding based on alternative measures, correlation among them, and rate of inbreeding depression for fitness obtained for a population of N = 20 breeding individuals maintained for 10 discrete generations assuming random mating and random contributions from parents to progeny (RC), equalization of contributions from parents to progeny (EC), and artificial selection for a neutral quantitative trait (SEL). Mean (F) and variance (VF) of inbreeding coefficients at generation 10, correlation between estimated inbreeding coefficients and those obtained from IBD measures (r), and mean values of the rate of inbreeding depression (ΔID). Bars refer to true IBD values (FIBD; horizontal red line), and estimated from pedigree records (FPED) and from different marker frequency-based measures (FVR1, FVR2, FYA1, FYA2, FLH1, FLH2, FHOM; see text for definitions) assuming the frequencies of the base generation (blue bars), those of the current generation (yellow bars) or a constant frequency of 0.5 (Fq05; purple bars). Estimates from runs of homozygosity are shown for fragments larger than 1 Mb (FROH-1) or 5 Mb (FROH-5). Only subscripts of estimators are shown for the sake of clarity
Fig. 2
Fig. 2
a Correlation (r), expressed as 1–r (in percentage), of the different estimates of inbreeding with true IBD inbreeding, and b Average difference between estimates of the rate of inbreeding depression (ΔID) and those obtained from true IBD inbreeding. All results in the study from Fig. 1, Additional file 5: Fig. S3, Additional file 6: Fig. S4 and Additional file 10: Fig. S7a–c were averaged (intervals denote 1 standard deviation). The estimates refer to pedigree records (FPED; green bars) and to different marker frequency-based measures (FVR1, FVR2, FYA1, FYA2, FLH1, FLH2, Fq05; see text for definitions), assuming the frequencies of the base generation (blue bars), those of the current generation (yellow bars), or a constant frequency of 0.5 (purple bars). Estimates from runs of homozygosity are shown for fragments larger than 1 Mb (FROH-1) or 5 Mb (FROH-5). Only subscripts of estimators are shown for a better view
Fig. 3
Fig. 3
Simulated (bars) and empirical (diamonds) estimates of inbreeding for the Guadyerbas pig population. Mean (F) and variance (VF) of simulated inbreeding coefficients in cohort 23, obtained from true IBD values (FIBD), and estimated from pedigree records (FPED) and from markers (FVR1, FVR2, FYA1, FYA2, FLH1, FLH2, FROH; see text for definitions) assuming the frequencies of the base generation (cohort 17 in a and c and cohort 0 in b and d; blue bars and yellow diamonds), those of the current generation (cohort 23; yellow bars and grey diamonds) or a constant frequency of 0.5 (purple bars). e and f Estimates of the inbreeding depression rate (ΔID) for litter size from 103 females born in cohorts 17–23. The estimate from FPED was obtained from data of 832 females born in all cohorts (0–23). g and h Correlations among simulated inbreeding coefficients in cohort 23. The intervals shown denote 95% of the variation across simulated replicates in order to see if the observed values are within the expected simulated values. Only subscripts of estimators are shown for a better view
Fig. 4
Fig. 4
Change in the average simulated and observed inbreeding coefficient across generations for the Guadyerbas pig population. Lines refer to average simulated IBD values (FIBD), estimated from pedigree records (FPED) and from simulated (SIM) and observed (OBS; circles) runs of homozygosity considering fragments larger than 1 Mb (FROH-1) or 5 Mb (FROH-5). Only subscripts of estimators are shown for clarity

References

    1. Frankham R, Ballou JD, Briscoe DA. Introduction to conservation genetics. 2. Cambridge: Cambridge University Press; 2010.
    1. Lynch M, Walsh B. Genetics and analysis of quantitative traits. Sunderland: Sinauer Associates Inc.; 1998.
    1. Hedrick PW. Genetics of populations. Sudbury: Jones and Bartlett Publishers; 2010.
    1. Caballero A. Quantitative genetics. Cambridge: Cambridge University Press; 2020.
    1. Wright S. Coefficients of inbreeding and relationships. Am Nat. 1922;56:330–339. doi: 10.1086/279872. - DOI

LinkOut - more resources