. 2022 Dec 27;20(1):290.
doi: 10.1186/s12915-022-01477-y.

Gut microbe Lactiplantibacillus plantarum undergoes different evolutionary trajectories between insects and mammals

Affiliations

Gut microbe Lactiplantibacillus plantarum undergoes different evolutionary trajectories between insects and mammals

Elisa Maritan et al. BMC Biol. .

Abstract

Background: Animals form complex symbiotic associations with their gut microbes, whose evolution is determined by an intricate network of host and environmental factors. In many insects, such as Drosophila melanogaster, the microbiome is flexible, environmentally determined, and less diverse than in mammals. In contrast, mammals maintain complex multispecies consortia that are able to colonize and persist in the gastrointestinal tract. Understanding the evolutionary and ecological dynamics of gut microbes in different hosts is challenging. This requires disentangling the ecological factors of selection, determining the timescales over which evolution occurs, and elucidating the architecture of such evolutionary patterns.

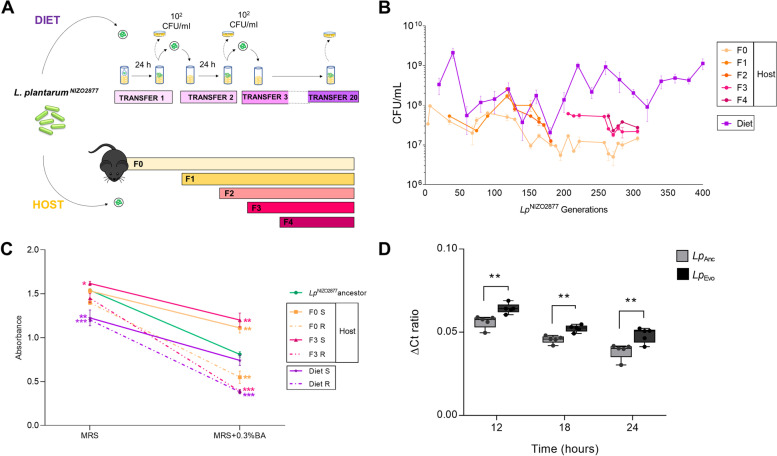
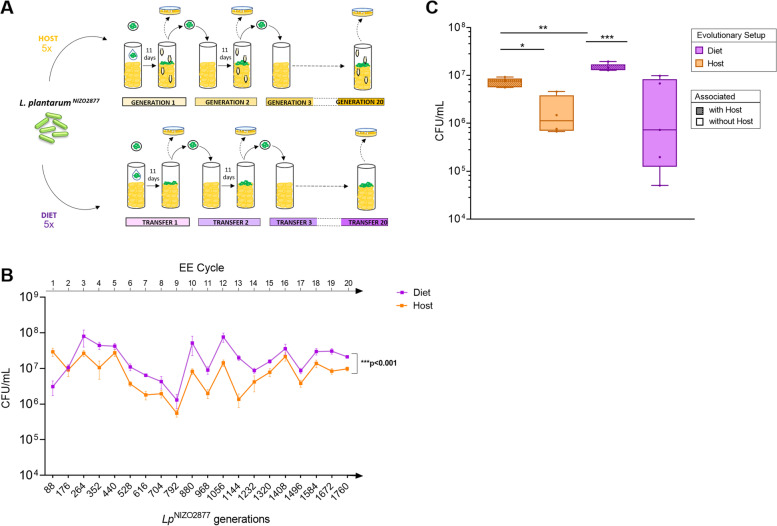
Results: We employ experimental evolution to track the pace of the evolution of a common gut commensal, Lactiplantibacillus plantarum, within invertebrate (Drosophila melanogaster) and vertebrate (Mus musculus) hosts and their respective diets. We show that in Drosophila, the nutritional environment dictates microbial evolution, while the host benefits L. plantarum growth only over short ecological timescales. By contrast, in a mammalian animal model, L. plantarum evolution results to be divergent between the host intestine and its diet, both phenotypically (i.e., host-evolved populations show higher adaptation to the host intestinal environment) and genomically. Here, both the emergence of hypermutators and the high persistence of mutated genes within the host's environment strongly differed from the low variation observed in the host's nutritional environment alone.

Conclusions: Our results demonstrate that L. plantarum evolution diverges between insects and mammals. While the symbiosis between Drosophila and L. plantarum is mainly determined by the host diet, in mammals, the host and its intrinsic factors play a critical role in selection and influence both the phenotypic and genomic evolution of its gut microbes, as well as the outcome of their symbiosis.

Keywords: Drosophila melanogaster; Experimental evolution; Gut microbiota evolution; Host–microbe symbiosis; Lactiplantibacillus plantarum; Mouse; Whole genome sequencing.


Conflict of interest statement

The authors declare that they have no competing interests.

Figures

Fig. 1
Fig. 1
L. plantarum evolution in mice leads to higher adaptation to the host intestinal environment. A Schematic representation of the LpNIZO2877experimental evolution (EE) protocols in the mouse diet (Diet setup) and mouse intestine (Host setup). The ancestral strain was inoculated in the mouse laboratory diet and in the mouse intestine by intragastric gavage. Five and two replicates of EE were performed for the Diet and the Host setup, respectively. An evolved bacterial subpopulation was plated out on MRS agar plates for colony counting at different time points throughout the EE in both setups. The EE in the Diet setup was conducted up to 20 transfers (i.e., ~20 days, corresponding to approximately 400 Lp generations). In the mouse intestine, Lp EE was carried out from generation 0 (F0) to 4 (F4) of mice (i.e., 10 months after the mono-association, ~300 days, corresponding to ~286 Lp generations) for one replicate and for one generation (F0) (3 months after the mono-association) for the second replicate. Four female mice were housed in a single cage. One male and two female mice were housed in a separate single cage. BLpNIZO2877 growth trend monitored over the course of the EE in both experimental setups (Host and Diet). C Final absorbance values (OD = 600) reached by the Lp strains under standard growth conditions (MRS broth) and in MRS broth added to with 0.3% bile acids (BA). S indicates smooth colonies, while R indicates rough colonies. Each dot represents the mean of at least three experimental replicates per condition, with bars indicating the respective SD (standard deviation). For both experimental conditions (MRS broth and MRS broth + 0.3% BA), asterisks indicate significance between the final absorbance values of each strain against those of the LpNIZO2877ancestor (unpaired t test; *p ≤ 0.05, **p < 0.01, and ***p < 0.001). D Quantitative PCR analysis of LpNIZO2877 ancestral strain (Anc) and LpNIZO2877-derived population (Evo) evolved in the mouse intestine. Each bar represents the standard error of the mean (SEM) of normalized ∆CT ratios (1/∆CT) of 3–4 mice/group. Statistical significance of the results is included (unpaired t test, **p≤0.01)
Fig. 2
Fig. 2
Mutations that occurred during L. plantarum experimental evolution in mice. A Pie chart reporting the number of Lp genes that accumulated mutations over the course of each experimental evolution setup (Host- and Diet-exclusive mutations) and in both setups (shared). B Total summed frequencies of all mutations observed in each sample from the mouse host evolution experiment. The panel above shows the structure of the evolution experiment in mouse hosts. Bacterial populations were sequenced at the indicated time points. C Base substitution spectra observed in the mouse diet, as well as mouse host populations divided into all mutations and those associated with the mutS A41T and mutS Δ1303 mutator lineages (see Additional file 5: Fig. S5). D Frequency trajectories of the mutS A41T and mutS Δ1303 mutations and mutations in other DNA replication and repair genes (mutL, dinB, dnaE) that may alter mutation rates in the mouse host populations
Fig. 3
Fig. 3
L. plantarum genes with mutations that persisted over the course of the evolution experiment in the mouse intestine. Each target is grouped according to the predicted functional category. The colors of the heatmap indicate the relative abundance of each mutational target across time points. Lighter spaces indicate that no mutations were detected. The timeline above the heatmap represents the samples from which each Lp population was retrieved and sequenced
Fig. 4
Fig. 4
Drosophila melanogaster benefits L. plantarum growth on a short timescale. A Design of the Lp experimental evolution (EE) with and without Drosophila (Host and Diet setups, respectively). For the first EE cycle, the ancestor strain (LpNIZO2877) was inoculated into tubes containing a poor-nutrient Drosophila diet (Diet setup) or a poor-nutrient diet containing 40 germ-free Drosophila embryos (Host setup). No further inoculation of the ancestor was performed until the end of the experimental evolution. As soon as at least 15 pupae emerged from all host tubes (i.e., after ~11 days, corresponding to ~88 bacterial generations), 150 μl of food was collected from both setups using a sterile loop, homogenized, and plated out to isolate bacteria (frozen “fossil” records of EE cycle 1). This bacterial population was used as the inoculum for the following generation/transfer. Subsequent EE cycles followed the same experimental procedure as cycle 1 and started from the fossil records belonging to the previous generation/transfer. The EE lasted 20 cycles (220 days, corresponding to ~1760 bacterial generations). BLp growth over the course of the Host and Diet EE protocols across 20 total EE cycles (i.e., 1760 bacterial generations). Each point represents the mean of the five experimental replicates, with bars indicating the standard error of the mean (SEM). ANCOVA ***p < 0.0001). C Microbial load obtained by mono-associating each of the five replicates of both setups (Host- and Diet-evolved bacteria) isolated from cycle 17, both with and without the host. Each bar represents the standard error of the mean (SEM) obtained by analyzing five replicate populations for each condition. Ordinary one-way ANOVA (*p ≤ 0.05, **p <0.01, and ***p < 0.001)
Fig. 5
Fig. 5
Mutations occurred during L. plantarum experimental evolution in the fly setup. A Pie chart reporting the number of Lp genes that accumulated mutations over the course of each experimental evolution setup (Host- and Diet-exclusive mutations) and in both setups (Shared). B Total summed frequencies of all mutations observed in each sample from the Host and Diet evolution experiment. Each point represents the mean of the 3 experimental replicates analyzed, with bars indicating the standard deviation (SD). C Base substitution spectra observed in the fly host and diet. The total number of mutations detected in each group (N) is shown above each bar. D Dynamics of mutations in fly diet and host treatments. Muller plots representing the evolutionary dynamics of Lp genes that mutated in the Host and Diet-evolved populations across EE cycles 2, 8, 14, and 20 (i.e., after 176, 704, 1232, and 1760 Lp generations)

References

    1. Dethlefsen L, McFall-Ngai M, Relman DA. An ecological and evolutionary perspective on human–microbe mutualism and disease. Nature. 2007;449:811–818. doi: 10.1038/nature06245. - DOI - PMC - PubMed
    1. Hooper LV, Midtvedt T, Gordon JI. How host-microbial interactions shape the nutrient environment of the mammalian intestine. Annu Rev Nutr. 2002;22:283–307. doi: 10.1146/annurev.nutr.22.011602.092259. - DOI - PubMed
    1. Ley RE, Peterson DA, Gordon JI. Ecological and evolutionary forces shaping microbial diversity in the human intestine. Cell. 2006;124:837–848. doi: 10.1016/j.cell.2006.02.017. - DOI - PubMed
    1. Moeller AH, Caro-Quintero A, Mjungu D, Georgiev AV, Lonsdorf EV, Muller MN, et al. Cospeciation of gut microbiota with hominids. Science. 2016;353:380–382. doi: 10.1126/science.aaf3951. - DOI - PMC - PubMed
    1. Backhed F. Host-bacterial mutualism in the human intestine. Science. 2005;307:1915–1920. doi: 10.1126/science.1104816. - DOI - PubMed

Publication types

LinkOut - more resources