. 2022 Dec 27;11(1):57.
doi: 10.1186/s40035-022-00333-x.

Enhanced delivery of a low dose of aducanumab via FUS in 5×FAD mice, an AD model

Affiliations

Enhanced delivery of a low dose of aducanumab via FUS in 5×FAD mice, an AD model

Chanho Kong et al. Transl Neurodegener. .

Abstract

Background: Aducanumab (Adu), which is a human IgG1 monoclonal antibody that targets oligomer and fibril forms of beta-amyloid, has been reported to reduce amyloid pathology and improve impaired cognition after administration of a high dose (10 mg/kg) of the drug in Alzheimer's disease (AD) clinical trials. The purpose of this study was to investigate the effects of a lower dose of Adu (3 mg/kg) with enhanced delivery via focused ultrasound (FUS) in an AD mouse model.

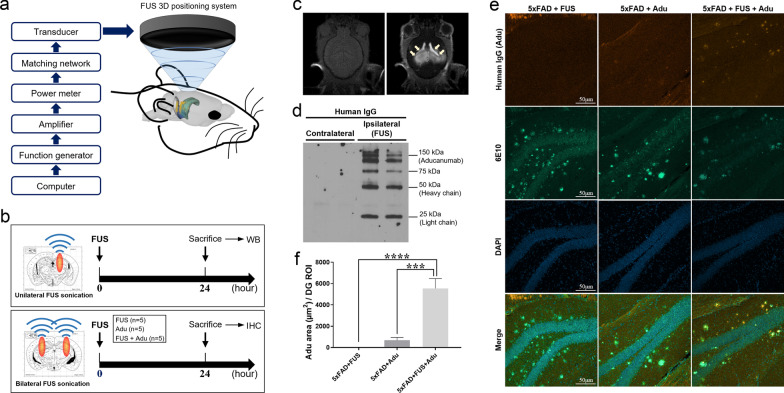
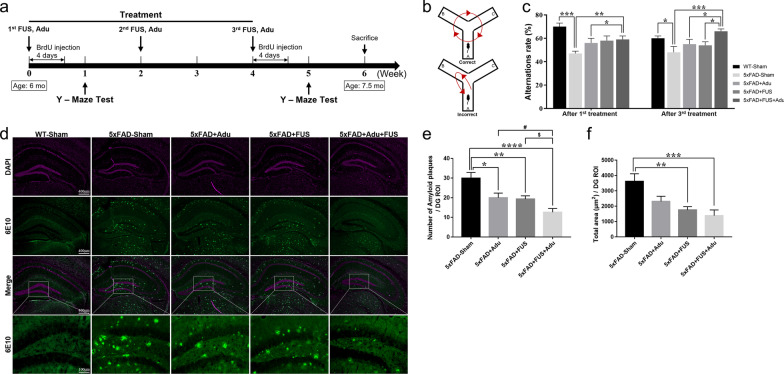
Methods: The FUS with microbubbles opened the blood-brain barrier (BBB) of the hippocampus for the delivery of Adu. The combined therapy of FUS and Adu was performed three times in total and each treatment was performed biweekly. Y-maze test, Brdu labeling, and immunohistochemical experimental methods were employed in this study. In addition, RNA sequencing and ingenuity pathway analysis were employed to investigate gene expression profiles in the hippocampi of experimental animals.

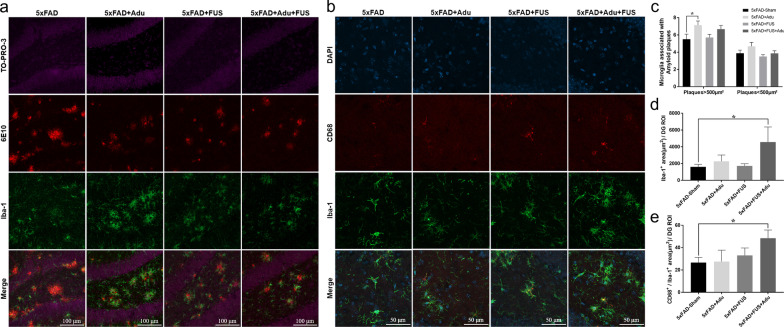
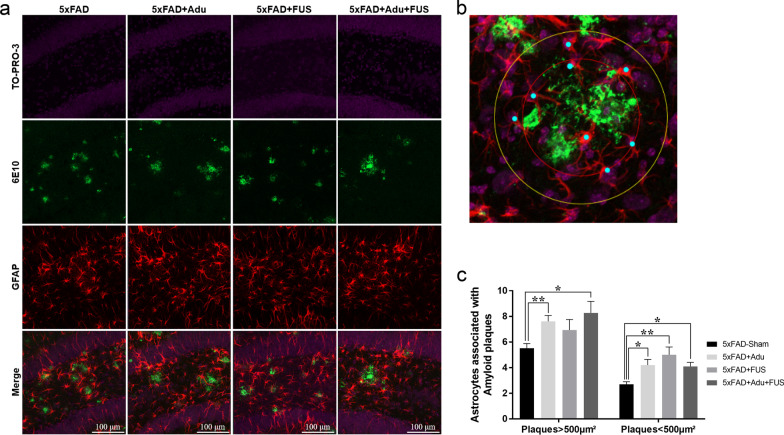
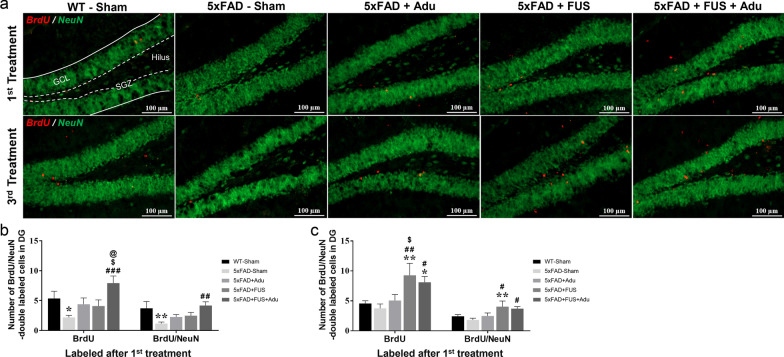
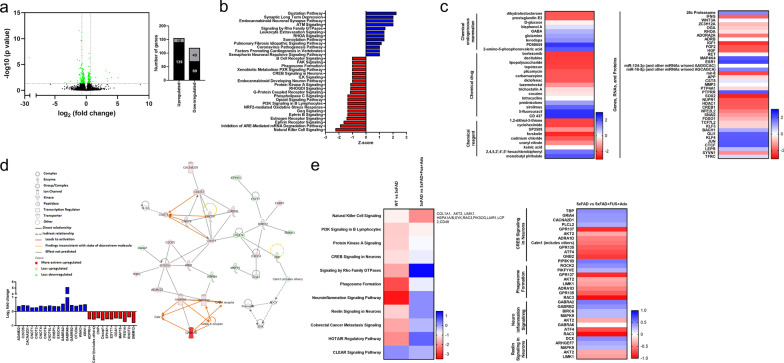
Results: The FUS-mediated BBB opening markedly increased the delivery of Adu into the brain by approximately 8.1 times in the brains. The combined treatment induced significantly less cognitive decline and decreased the level of amyloid plaques in the hippocampi of the 5×FAD mice compared with Adu or FUS alone. Combined treatment with FUS and Adu activated phagocytic microglia and increased the number of astrocytes associated with amyloid plaques in the hippocampi of 5×FAD mice. Furthermore, RNA sequencing identified that 4 enriched canonical pathways including phagosome formation, neuroinflammation signaling, CREB signaling and reelin signaling were altered in the hippocami of 5×FAD mice receiving the combined treatment.

Conclusion: In conclusion, the enhanced delivery of a low dose of Adu (3 mg/kg) via FUS decreases amyloid deposits and attenuates cognitive function deficits. FUS-mediated BBB opening increases adult hippocampal neurogenesis as well as drug delivery. We present an AD treatment strategy through the synergistic effect of the combined therapy of FUS and Adu.

Keywords: Aducanumab; Alzheimer’s disease; Focused ultrasound; Transcriptome profiling.


Conflict of interest statement

The authors declare that they have no competing interests.

Figures

Fig. 1
Fig. 1
FUS-mediated BBB opening significantly increased the delivery of Adu in the brain. a A scheme of the FUS system set up for BBB opening in mice. b A schematic diagram for unilateral (upper panel) and bilateral (lower panel) FUS sonication. c Pre- and post-gadolinium T1-weighted images: FUS-mediated BBB opening was confirmed with MRI. d FUS was treated unilaterally to the brains of experimental animals. A representative image of Western blotting with an antibody against human IgG after Adu injection and unilateral FUS treatment. e Representative confocal images (20x) of human IgG (Aducanumab), Aβ stained with 6E10 antibody and DAPI in the dentate gyrus of the hippocampus. f A bar graph showing the levels of Adu assessed with human IgG antibody in the hippocampus. Data are presented as mean ± SEM. Statistical analyses were performed using one-way ANOVA, followed by Tukey’s post hoc analysis. (****P < 0.0001, ***P < 0.001, n = 5 mice for each group)
Fig. 2
Fig. 2
Treatment with FUS and Adu ameliorated cognitive impairment and levels of Aβ in the hippocampus. a Timeline of FUS and Adu treatment in 5×FAD mice. b Schematic illustration of the Y-maze spontaneous alternation test. c Alternation ratio in the Y-maze test at one week after the 1st treatment and at one week after the 3rd treatment. d Representative images (5×) of Aβ stained with 6E10 antibody and DAPI in the hippocampus. Bottom, representative images (20X) of Aβ stained with 6E10 antibody in the dentate gyrus of the hippocampus. e A bar graph showing the number of amyloid plaques in the dentate gyrus of the hippocampus (*P < 0.05, **P < 0.01, ***P < 0.001, and ****P < 0.0001 compared with 5×FAD-Sham mice, ANOVA followed by Tukey’s post hoc analysis, #P < 0.05 compared with 5×FAD + Adu mice, $P < 0.05 compared with 5×FAD + FUS mice by Student’s t-test, n = 11–15 mice for each group). f A bar graph showing the total area of amyloid plaques in the dentate gyrus of the hippocampus. Data are expressed as the means ± SEM. Statistical analyses were performed using one-way ANOVA, followed by Tukey’s post hoc analysis. (**P < 0.01, ***P < 0.001 compared with 5×FAD-Sham mice, n = 11–15 mice for each group)
Fig. 3
Fig. 3
Treatment of FUS and Adu increased the number of activated phagocytic microglia associated with amyloid plaques in the hippocampus. a Representative images showing Iba-1-positive cells (green) surrounding Aβ plaques (red) in the dentate gyrus of the hippocampus. b Representative images of CD68 (red) and Iba-1(green) contained in the dentate gyrus of the hippocampus. c A bar graph showing the number of Iba1+microglia within 20 µm from Aβ plaques that were larger than 500 µm2 or smaller than 500 µm2. d A bar graph showing the total area of microglia. e A bar graph showing the phagosome area (CD68+/Iba1+) in microglia. Data are expressed as the means ± SEM. Statistical analyses were performed using one-way ANOVA, followed by Tukey’s post hoc analysis. (*P < 0.05 compared with 5×FAD-Sham mice, n = 3–4 mice for each group)
Fig. 4
Fig. 4
Treatment of FUS and Adu increased plaque-associated astrocytes in the hippocampus. a Representative images showing GFAP-positive cells (red) surrounding Aβ plaques (green) in the dentate gyrus of the hippocampus. b A representative higher-magnification image for the quantification of number of plaque-associated astrocytes. c A bar graph showing the number of astrocytes within 20 µm from Aβ plaques that were larger than 500 µm2 or smaller than 500 µm2. Data are expressed as the means ± SEM. Statistical analyses were performed using the Kruskal–Wallis test. (*P < 0.05 and **P < 0.01 compared with 5×FAD-Sham mice, n = 3–4 mice for each group)
Fig. 5
Fig. 5
Treatment with FUS and Adu increased neurogenesis in the hippocampus. a Representative images showing immunofluorescence of neuronal nuclear marker (NeuN, green) and 5-bromo-2′-deoxyuridine (BrdU, red) in the dentate gyrus of the hippocampus. Scale bars: 100 µm. SGZ: subgranular zone, GCL; granular cell layer. b Bar graphs showing the number of BrdU- and BrdU/NeuN-positive cells after the 1st treatment. c Bar graphs showing the number of BrdU- and BrdU/NeuN-positive cells after the 3rd treatment. Data are expressed as the means ± SEM. Statistical analyses were performed using one-way ANOVA followed by a least significant difference post-hoc analysis. (*P < 0.05, and **P < 0.01, compared with WT-Sham mice, #P < 0.05, ##P < 0.01, and ###P < 0.001 compared with 5×FAD-Sham mice, $P < 0.05 compared with 5×FAD + Adu mice, @P < 0.05 compared with 5×FAD + FUS mice, n = 5–10 for each group)
Fig. 6
Fig. 6
Treatment of FUS and Adu altered gene expression profiles in the hippocampus. a Left figure is a volcano plot. The x-axis represents the log2 conversion of the fold change (FC) values, and the y-axis represents the corrected significance level after base log10 conversion (q value). Green dots in the volcano plot and right graph indicate all DEGs that were found to differ significantly (q value < 0.05). The black bar in the right graph represents the number of genes with an absolute value of log2 FC greater than 0.7, and the gray bar represents the number of genes with an absolute value of log2 FC less than 0.7. b Canonical pathway analysis. Activated canonical pathway (blue bar) and inhibited canonical pathway (red bar) were identified (Z score > 1 or < − 1). c A heatmap of upstream regulators (Z score > 1 or < − 1). d A gene interaction network map (upper) and related DEGs’ log2 FC values (lower). e A heatmap of canonical pathways via comparison analysis (left) and four selected canonical pathways, including related molecules

References

    1. Tampi RR, Forester BP, Agronin M. Aducanumab: evidence from clinical trial data and controversies. Drugs Context. 2021 doi: 10.7573/dic.2021-7-3. - DOI - PMC - PubMed
    1. Cummings J, Lee G, Ritter A, Sabbagh M, Zhong K. Alzheimer's disease drug development pipeline: 2020. Alzheimer’s Dement Transl ResClin Interv. 2020;6(1):e12050. - PMC - PubMed
    1. Cummings J, Lee G, Zhong K, Fonseca J, Taghva K. Alzheimer's disease drug development pipeline: 2021. Alzheimer’s Dement Transl Res Clin Interv. 2021;7(1):e12179. - PMC - PubMed
    1. Dunn B, Stein P, Cavazzoni P. Approval of aducanumab for Alzheimer disease—the FDA’s perspective. JAMA Intern Med. 2021;181(10):1276–1278. - PubMed
    1. Sevigny J, Chiao P, Bussière T, Weinreb PH, Williams L, Maier M, et al. The antibody aducanumab reduces Aβ plaques in Alzheimer’s disease. Nature. 2016;537(7618):50–56. - PubMed

Publication types