. 2022 Dec 28:11:e81856.
doi: 10.7554/eLife.81856.

Maximizing CRISPRi efficacy and accessibility with dual-sgRNA libraries and optimal effectors

Affiliations

Maximizing CRISPRi efficacy and accessibility with dual-sgRNA libraries and optimal effectors

Joseph M Replogle et al. Elife. .

Abstract

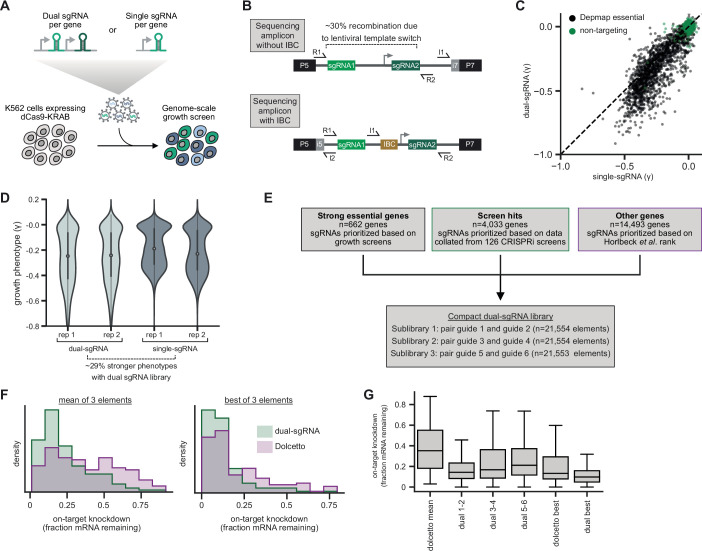
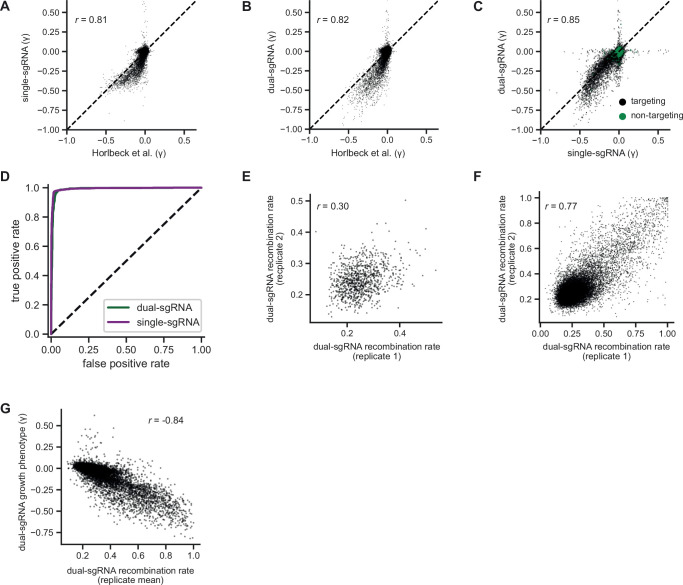
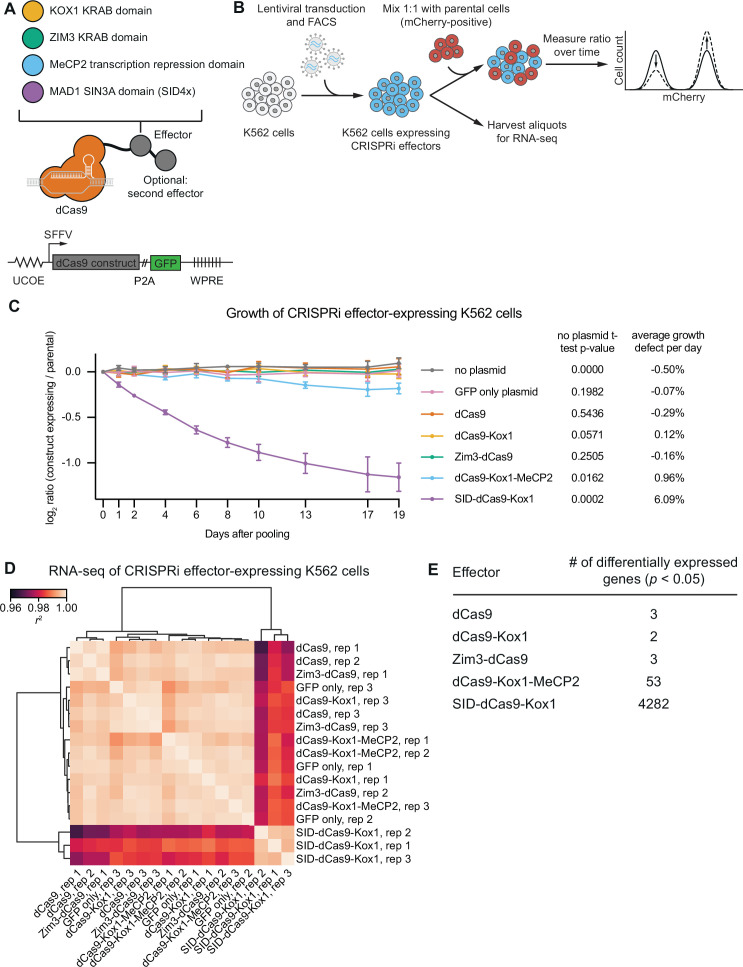
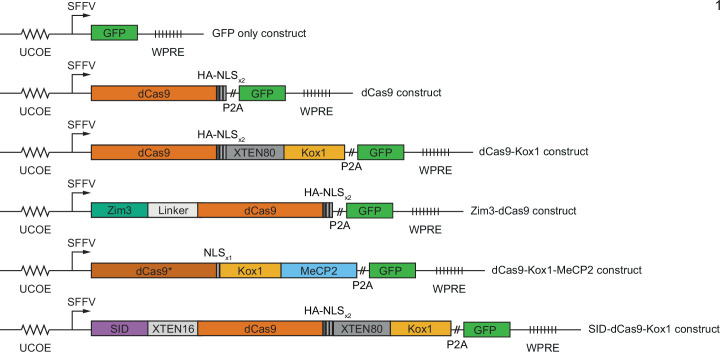
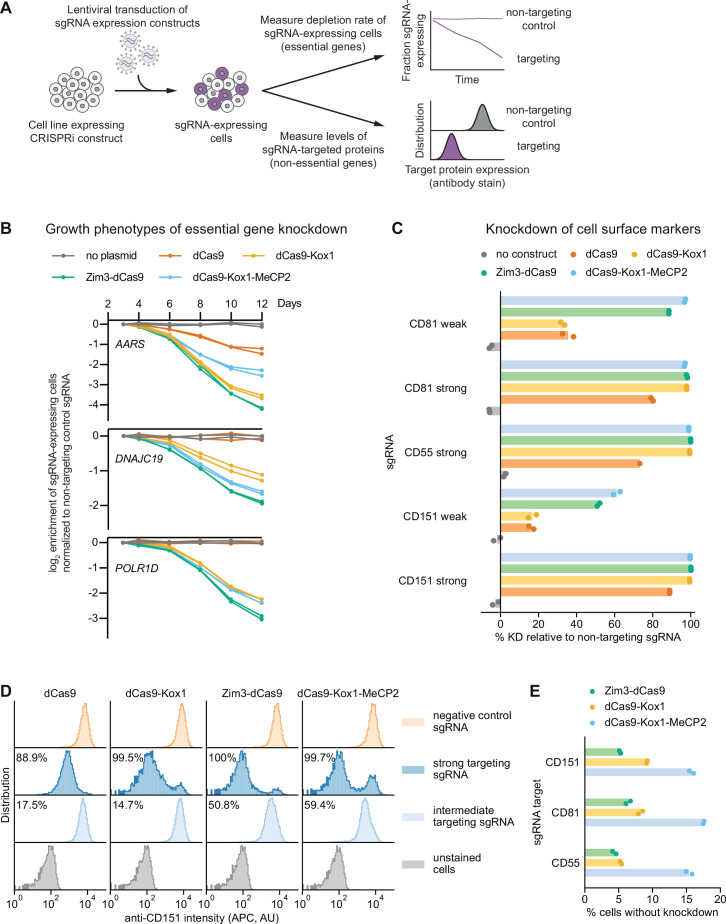
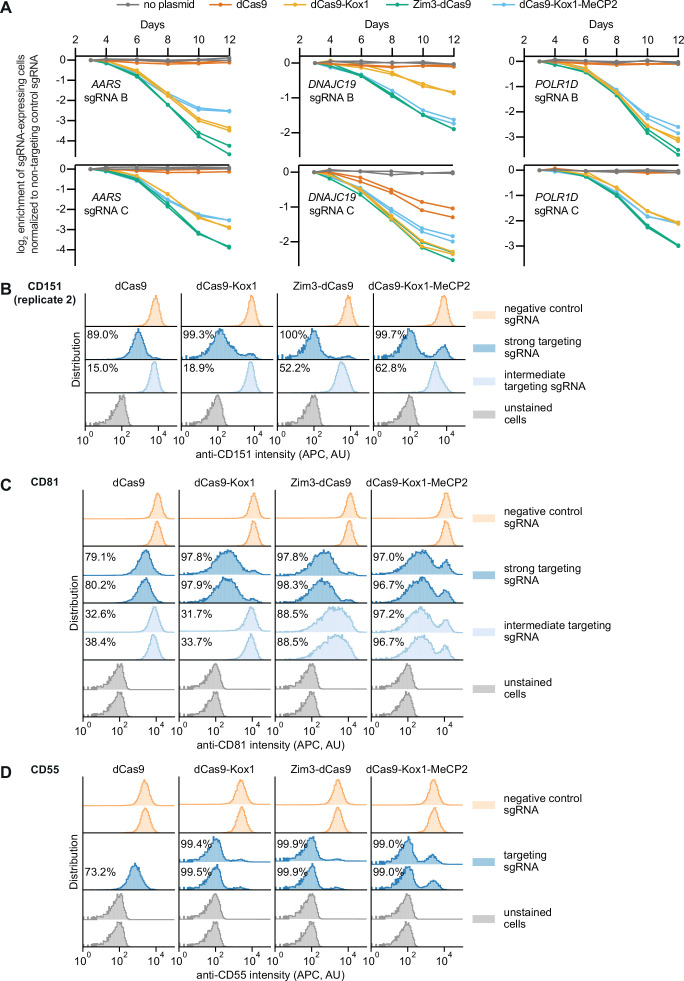
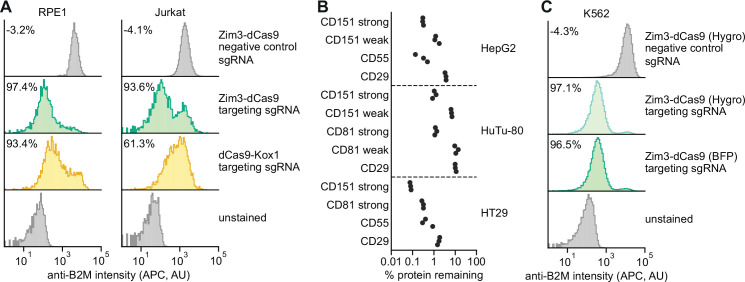
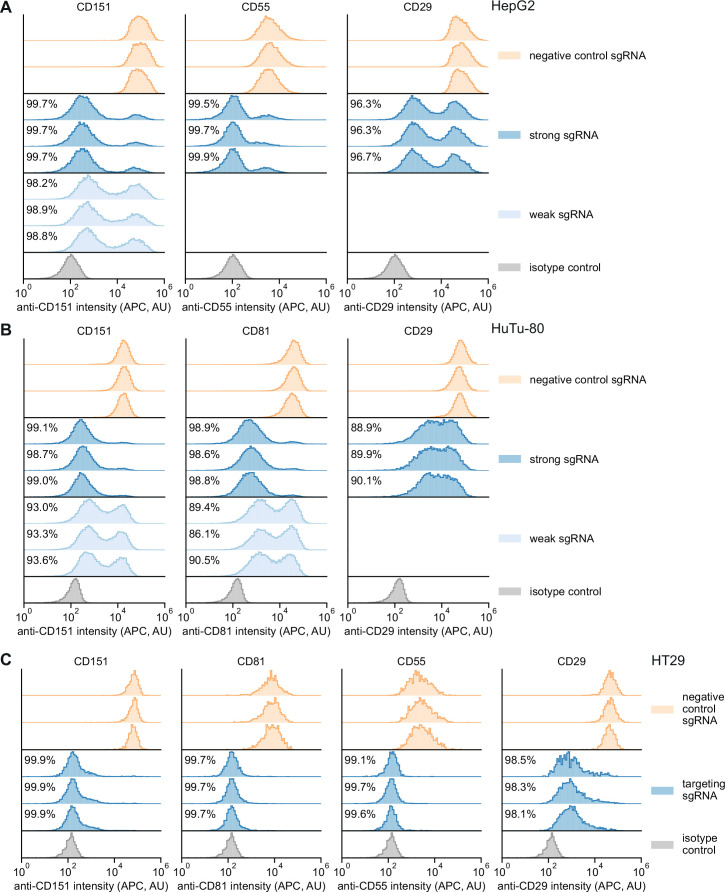
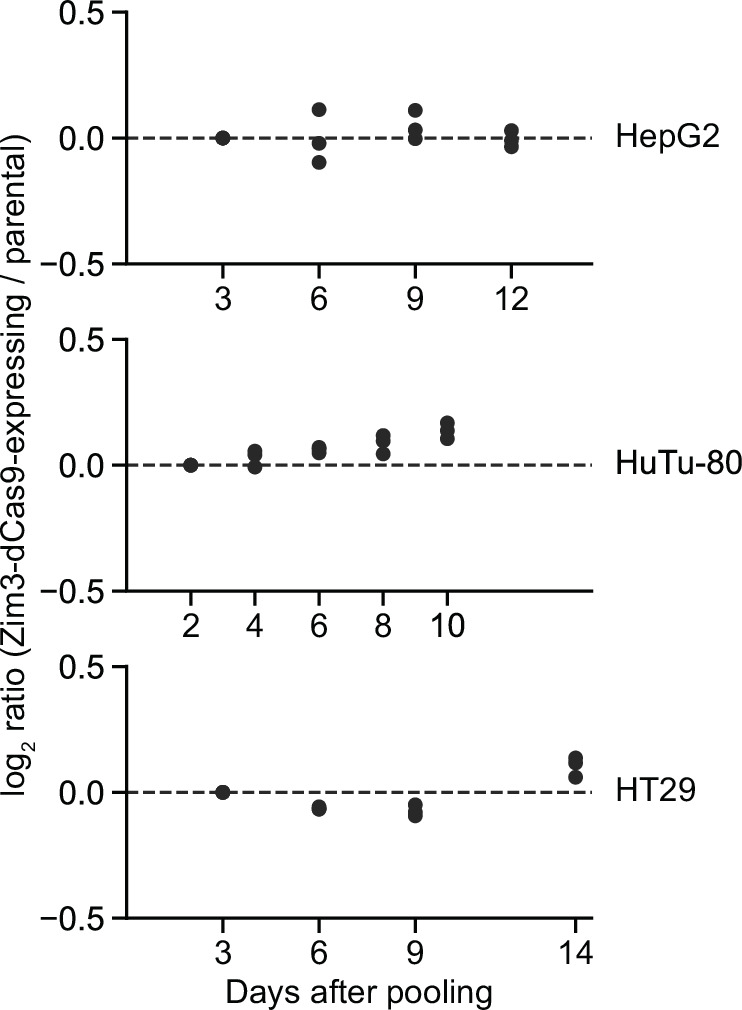
CRISPR interference (CRISPRi) enables programmable, reversible, and titratable repression of gene expression (knockdown) in mammalian cells. Initial CRISPRi-mediated genetic screens have showcased the potential to address basic questions in cell biology, genetics, and biotechnology, but wider deployment of CRISPRi screening has been constrained by the large size of single guide RNA (sgRNA) libraries and challenges in generating cell models with consistent CRISPRi-mediated knockdown. Here, we present next-generation CRISPRi sgRNA libraries and effector expression constructs that enable strong and consistent knockdown across mammalian cell models. First, we combine empirical sgRNA selection with a dual-sgRNA library design to generate an ultra-compact (1-3 elements per gene), highly active CRISPRi sgRNA library. Next, we compare CRISPRi effectors to show that the recently published Zim3-dCas9 provides an excellent balance between strong on-target knockdown and minimal non-specific effects on cell growth or the transcriptome. Finally, we engineer a suite of cell lines with stable expression of Zim3-dCas9 and robust on-target knockdown. Our results and publicly available reagents establish best practices for CRISPRi genetic screening.

Keywords: CRISPR; CRISPR interference; functional genomics; genetic screen; genetics; genomics; human; knockdown.


Conflict of interest statement

JR consults for Maze Therapeutics and Waypoint Bio, JB, AP, CL, NM, YD, BR, XW, KL, AG, RP, DR, MW No competing interests declared, TN consults for Maze Therapeutics. The Regents of the University of California with TMN, MJ, LAG, and JSW as inventors have filed patent applications related to CRISPRi/a screening and Perturb-seq, LG declares outside interest in Chroma Medicine. The Regents of the University of California with TMN, MJ, LAG, and JSW as inventors have filed patent applications related to CRISPRi/a screening and Perturb-seq. LAG, MK, and JSW are inventors on US Patent 11,254,933 related to CRISPRi/a screening, MK serves on the Scientific Advisory Boards of Engine Biosciences, Casma Therapeutics, Cajal Neuroscience, and Alector, and is an advisor to Modulo Bio and Recursion Therapeutics. LAG, MK, and JSW are inventors on US Patent 11,254,933 related to CRISPRi/a screening, JW declares outside interest in 5 AM Venture, Amgen, Chroma Medicine, KSQ Therapeutics, Maze Therapeutics, Tenaya Therapeutics, Tessera Therapeutics, and Third Rock Ventures. The Regents of the University of California with TMN, MJ, LAG, and JSW as inventors have filed patent applications related to CRISPRi/a screening and Perturb-seq. LAG, MK, and JSW are inventors on US Patent 11,254,933 related to CRISPRi/a screening, MJ consults for Maze Therapeutics and Gate Bioscience. The Regents of the University of California with TMN, MJ, LAG, and JSW as inventors have filed patent applications related to CRISPRi/a screening and Perturb-seq

Figures

Figure 1.
Figure 1.. Design and validation of ultra-compact dual-single guide RNA (sgRNA) CRISPR interference (CRISPRi) libraries.
(A) Schematic of growth screen used to compare single- and dual-sgRNA libraries. (B) Schematic of dual-sgRNA library sequencing strategies. (C) Comparison of growth phenotypes for DepMap essential genes between single- and dual-sgRNA libraries. Sequencing libraries were prepared using the strategy labeled ‘Sequencing amplicon without IBC’ in panel B. Growth phenotypes are reported as γ (log2 fold-enrichment of Tfinal over T0, per doubling) and well correlated between libraries (r=0.91). Only values between –1 and 0.1 are shown. (D) Comparison of growth phenotypes for DepMap essential genes between single- and dual-sgRNA libraries. In the violin plot, the violin displays the kernel density estimate, the central white point represents the median, and the central black bar represents the interquartile range (IQR). (E) Design of final dual-sgRNA library. (F) Comparison of target gene knockdown by dual-sgRNA library versus Dolcetto library. Target gene knockdown was measured by single-cell RNA-sequencing (Perturb-seq). For each library, the ‘mean of 3 elements’ was calculated as the mean knockdown of all three elements targeting each gene. The ‘best of 3 elements’ represents the element with the best knockdown per each gene. (G) Comparison of target gene knockdown across elements in dual-sgRNA library versus Dolcetto. In the box plot, the box shows the IQR, the line dividing the box shows the median value, and the whiskers extend to show 1.5× the IQR. Outlier observations >1.5× IQR are not shown.
Figure 1—figure supplement 1.
Figure 1—figure supplement 1.. Additional comparisons of pilot single- and dual-single guide RNA (sgRNA) library screens.
(A) Comparison of growth phenotypes for all elements between our pilot single-sgRNA library and Horlbeck et al. data, merged by gene name (n=20,228 elements). Growth phenotypes are reported as γ (log2 fold-enrichment of Tfinal over T0, per doubling) and correlated between experiments (r=0.82). (B) Comparison of growth phenotypes for all elements between our pilot dual-sgRNA library and Horlbeck et al. data, merged by gene name (n=20,228 elements). Growth phenotypes are reported as γ and correlated between experiments (r=0.83). (C) Comparison of growth phenotypes for all elements between our pilot single- and dual-sgRNA libraries, merged by gene name (n=21,239 with 20,228 targeting elements and 1011 non-targeting elements). Growth phenotypes are reported as γ and correlated between experiments (r=0.86). (D) Comparison of true and false-positive rates in single element screens. ‘Positives’ (n=1363 elements) were defined as genes with a K562 CRISPRi growth screen p-value <0.001 and γ<–0.05 (Horlbeck et al., 2016a), and ‘negatives’ were defined as non-targeting control sgRNA pairs (n=1011 elements). (E) Comparison of recombination rates for non-targeting dual-sgRNA elements between replicates of our K562 growth screen. Non-targeting elements with a growth phenotype (γ>0.05 or γ<−0.05) were excluded (n=973 elements). Recombination rates were weakly correlated between replicates (r=0.30). (f) Comparison of recombination rates for all dual-sgRNA elements between replicates of our K562 growth screen (n=20,387 elements). Recombination rates were strongly correlated between replicates (r=0.77). (G) Comparison of recombination rates and growth phenotypes for all dual-sgRNA elements in our K562 growth screen (n=20,387 elements). Growth phenotypes are reported as γ. Recombination rates were strongly anticorrelated with growth phenotypes (r=−0.84).
Figure 2.
Figure 2.. CRISPR interference (CRISPRi) effectors containing SID or MeCP2 domains have non-specific effects on cell viability and gene expression.
(A) Schematics of CRISPRi transcription repressor domains and general lentiviral expression construct used for all CRISPRi effectors. UCOE = ubiquitous chromatin opening element; SFFV = spleen focus-forming virus promoter; P2A = ribosomal skipping sequence; WPRE = woodchuck hepatitis virus post-transcriptional regulatory element. Further information on repressor domains and lentiviral expression constructs can be found in the main text and Materials and methods. (B) Experimental design to test effects of stable expression of each CRISPRi effector on growth and transcription in K562 cells. (C) Growth defects of effector-expressing cells, measured as the log2 of the ratio of mCherry-negative (effector-expressing) to mCherry-positive (not effector-expressing) cells in each well normalized to the same ratio on day 0. mCherry levels were measured for 19 days after pooling cells. Data represent mean ± SD from three independent transductions of expression constructs. p-Values are from an unpaired two-tailed t-test comparing D19 values for each sample to the D19 value for the ‘no plasmid’ sample. Average percent growth defect per day is the log2 D19 value divided by the number of days, multiplied by 100 for a percent value. (D) Clustered heatmap of correlation of transcript counts from K562 cells expressing indicated CRISPRi effectors or a GFP control. Correlations across samples were calculated using normalized counts (reads per million) for all genes with mean normalized count >1 and then clustered using the Ward variance minimization algorithm implemented in scipy. r2 is squared Pearson correlation. Data represent three independent transductions of expression constructs. (E) Number of differentially expressed genes (p<0.05) for cells expressing each effector versus cells expressing GFP only. p-Values were calculated using a Wald test and corrected for multiple hypothesis testing as implemented in DeSeq2.
Figure 2—figure supplement 1.
Figure 2—figure supplement 1.. Design of constructs for CRISPR interference (CRISPRi) effector expression.
Figure 3.
Figure 3.. Zim3-dCas9 and dCas9-Kox1-MeCP2 mediate strongest knockdown.
(A) Experimental design to measure knockdown mediated by different CRISPR interference (CRISPRi) effectors by delivering single guide RNAs (sgRNAs) targeting either essential genes or cell surface markers. (B) Depletion of K562 cells expressing essential gene-targeting sgRNAs and different CRISPRi effectors, measured as the ratio of mCherry-positive (sgRNA-expressing) to mCherry-negative (not sgRNA-expressing) cells in a given well. mCherry levels were measured for 12 days after transduction, starting on day 3. Data from two replicate transductions. (C) Percent knockdown of cell surface markers by different CRISPRi effectors in K562 cells. Cell surface marker levels were measured on day 6 post-transduction by staining with an APC-conjugated antibody. Knockdown was calculated as the ratio of median APC signal in sgRNA-expressing cells and median APC signal in cells expressing a non-targeting control sgRNA after subtraction of background APC signal. Data from two replicate transductions. Cells expressing dCas9 and a strong CD55-targeting sgRNA are represented by a single replicate. (D) Distribution of anti-CD151 signal intensity (APC) in individual cells from one representative transduction. Data from second replicate are shown in Figure 3—figure supplement 1B. Knockdown was quantified as in C as the ratio of the median APC signals. (E) Percentage of cells without observable knockdown despite expressing a strong sgRNA, as quantified from the fluorescence distributions.
Figure 3—figure supplement 1.
Figure 3—figure supplement 1.. Additional measurements of on-target activity of CRISPR interference (CRISPRi) effectors.
(A) Depletion of K562 cells expressing essential gene-targeting single guide RNAs (sgRNAs) and different CRISPRi effectors, measured as the ratio of mCherry-positive (sgRNA-expressing) to mCherry-negative (not sgRNA-expressing) cells in a given well, as in Figure 3A. mCherry levels were measured for 12 days after transduction, starting on day 3. Data from two replicate transductions. (B) Distribution of anti-CD151 signal intensity (APC) in K562 cells expressing indicated CRISPRi effectors from second replicate transduction. Knockdown was quantified as in Figure 3C. (C) Distribution of anti-CD81 signal intensity (APC) in K562 cells expressing indicated CRISPRi effectors from two replicate transductions. Knockdown was quantified as in Figure 3C. (D) Distribution of anti-CD55 signal intensity (APC) in K562 cells expressing indicated CRISPRi effectors from two replicate transductions. Cells expressing dCas9 and the CD55-targeting sgRNA are represented by a single replicate. Knockdown was quantified as in Figure 3C.
Figure 4.
Figure 4.. Validation of a suite of optimized Zim3-dCas9 cell lines.
(A) Distribution of anti-B2M signal intensity (APC) in individual RPE1 (left) and Jurkat (right) cells expressing indicated CRISPR interference (CRISPRi) effectors and single guide RNAs (sgRNAs). Knockdown was calculated as the ratio of median APC signal in transduced (sgRNA-expressing) cells and median APC signal in non-transduced cells in the same well, after subtraction of background APC signal. (B) Depletion of indicated cell surface markers in HepG2 (top), HuTu-80 (middle), and HT29 (bottom) cells expressing Zim3-dCas9. Cell surface marker levels were measured 6–14 days post-transduction by staining with APC-conjugated antibodies. Knockdown was calculated as the ratio of median APC signal in sgRNA-expressing cells and median APC signal in cells expressing a non-targeting control sgRNA after subtraction of background APC signal. (C) Distribution of anti-B2M signal intensity (APC) in individual K562 cells expressing indicated CRISPRi effectors and sgRNAs. The Zim3-dCas9 (Hygro) cell line was generated by transduction followed by hygromycin selection and does not express a fluorescent protein. Knockdown was calculated as in A.
Figure 4—figure supplement 1.
Figure 4—figure supplement 1.. Single-cell distributions of knockdown in different Zim3-dCas9 cell lines.
(A) Distribution of anti-CD151, anti-CD55, and anti-CD29 signal intensities (APC) in HepG2 cells expressing Zim3-dCas9. Data from three independent transductions are shown. A weak targeting single guide RNA (sgRNA) was only included for CD151. For the isotype control, cells expressing the negative control sgRNA were stained with an APC-conjugated isotype control antibody. A single replicate is shown for the isotype control. Knockdown was calculated as in Figure 4B. (B) Distribution of anti-CD151, anti-CD81, and anti-CD29 signal intensities (APC) in HuTu-80 cells expressing Zim3-dCas9. Data from three independent transductions are shown. A weak targeting sgRNA was only included for CD151 and CD81. For the isotype control, cells expressing the negative control sgRNA were stained with an APC-conjugated isotype control antibody. A single replicate is shown for the isotype control. Knockdown was calculated as in Figure 4B. (C) Distribution of anti-CD151, anti-CD81, anti-CD55, and anti-CD29 signal intensities (APC) in HT29 cells expressing Zim3-dCas9. Data from three independent transductions are shown. Only strong targeting sgRNAs were included. For the isotype control, cells expressing the negative control sgRNA were stained with an APC-conjugated isotype control antibody. A single replicate is shown for the isotype control. Knockdown was calculated as in Figure 4B.
Figure 4—figure supplement 2.
Figure 4—figure supplement 2.. Growth of different Zim3-dCas9-expressing cell lines.
Growth rates of HepG2, HuTu-80, and HT29 cells expressing Zim3-dCas9, measured as the log2 of the ratio of BFP-negative (effector-expressing) to BFP-positive (not effector-expressing) cells normalized to the same ratio at the first measurement day. Data represent three independent mixtures of cells that were cultured in parallel. BFP levels dropped slightly over time in HuTu-80 cells, leading to the apparent increase in Zim3-dCas9-expressing cells.

References

    1. Adamson B, Norman TM, Jost M, Cho MY, Nuñez JK, Chen Y, Villalta JE, Gilbert LA, Horlbeck MA, Hein MY, Pak RA, Gray AN, Gross CA, Dixit A, Parnas O, Regev A, Weissman JS. A multiplexed single-cell CRISPR screening platform enables systematic dissection of the unfolded protein response. Cell. 2016;167:1867–1882. doi: 10.1016/j.cell.2016.11.048. - DOI - PMC - PubMed
    1. Adamson B, Norman TM, Jost M, Weissman JS. Approaches to Maximize SgRNA-Barcode Coupling in Perturb-Seq Screens. bioRxiv. 2018 doi: 10.1101/298349. - DOI
    1. Alerasool N, Segal D, Lee H, Taipale M. An efficient KRAB domain for crispri applications in human cells. Nature Methods. 2020;17:1093–1096. doi: 10.1038/s41592-020-0966-x. - DOI - PubMed
    1. Behan FM, Iorio F, Picco G, Gonçalves E, Beaver CM, Migliardi G, Santos R, Rao Y, Sassi F, Pinnelli M, Ansari R, Harper S, Jackson DA, McRae R, Pooley R, Wilkinson P, van der Meer D, Dow D, Buser-Doepner C, Bertotti A, Trusolino L, Stronach EA, Saez-Rodriguez J, Yusa K, Garnett MJ. Prioritization of cancer therapeutic targets using CRISPR-cas9 screens. Nature. 2019;568:511–516. doi: 10.1038/s41586-019-1103-9. - DOI - PubMed
    1. Bock C, Datlinger P, Chardon F, Coelho MA, Dong MB, Lawson KA, Lu T, Maroc L, Norman TM, Song B, Stanley G, Chen S, Garnett M, Li W, Moffat J, Qi LS, Shapiro RS, Shendure J, Weissman JS, Zhuang X. High-content CRISPR screening. Nature Reviews Methods Primers. 2022;2:8. doi: 10.1038/s43586-021-00093-4. - DOI - PMC - PubMed

Publication types

MeSH terms

Substances

Associated data