. 2022 Dec 28:11:e80380.
doi: 10.7554/eLife.80380.

Lack of evidence for increased transcriptional noise in aged tissues

Affiliations

Lack of evidence for increased transcriptional noise in aged tissues

Olga Ibañez-Solé et al. Elife. .

Abstract

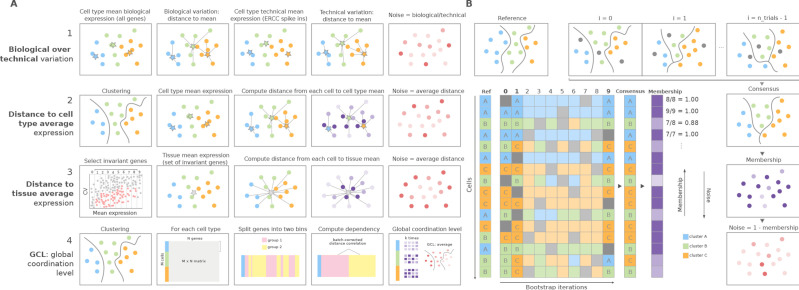
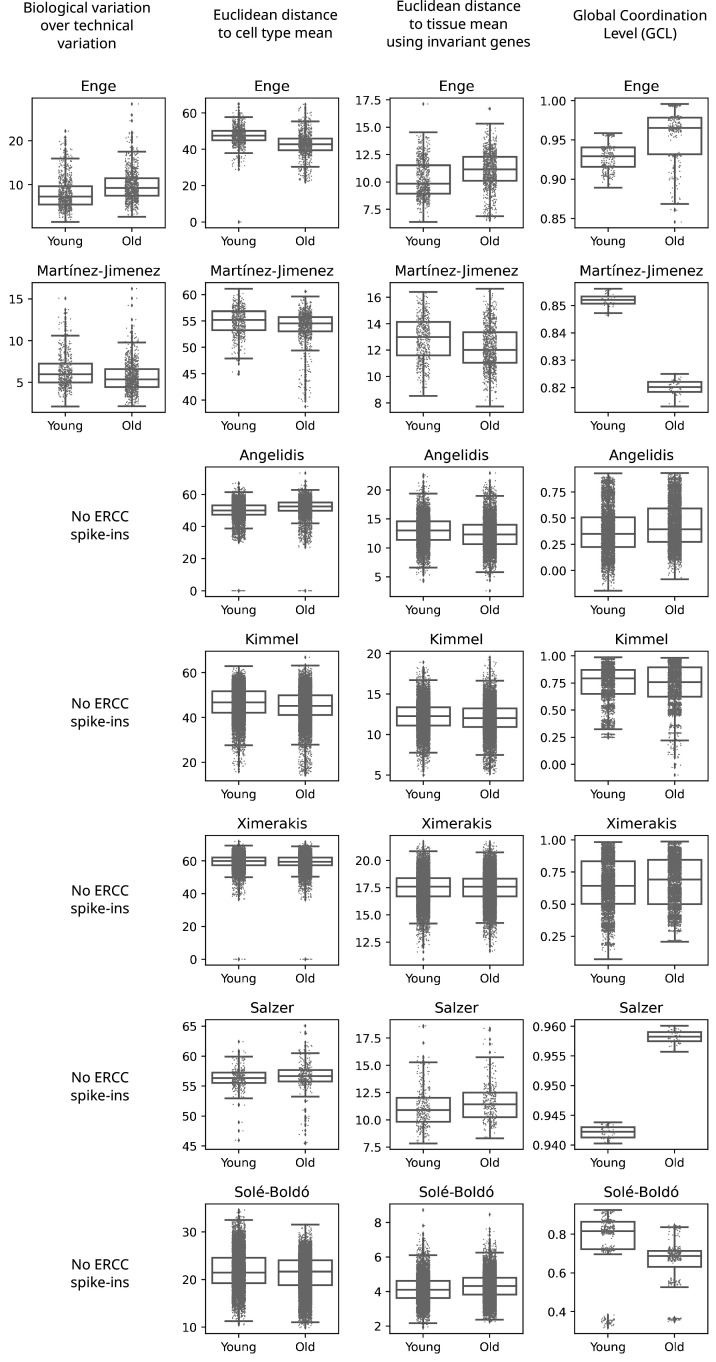
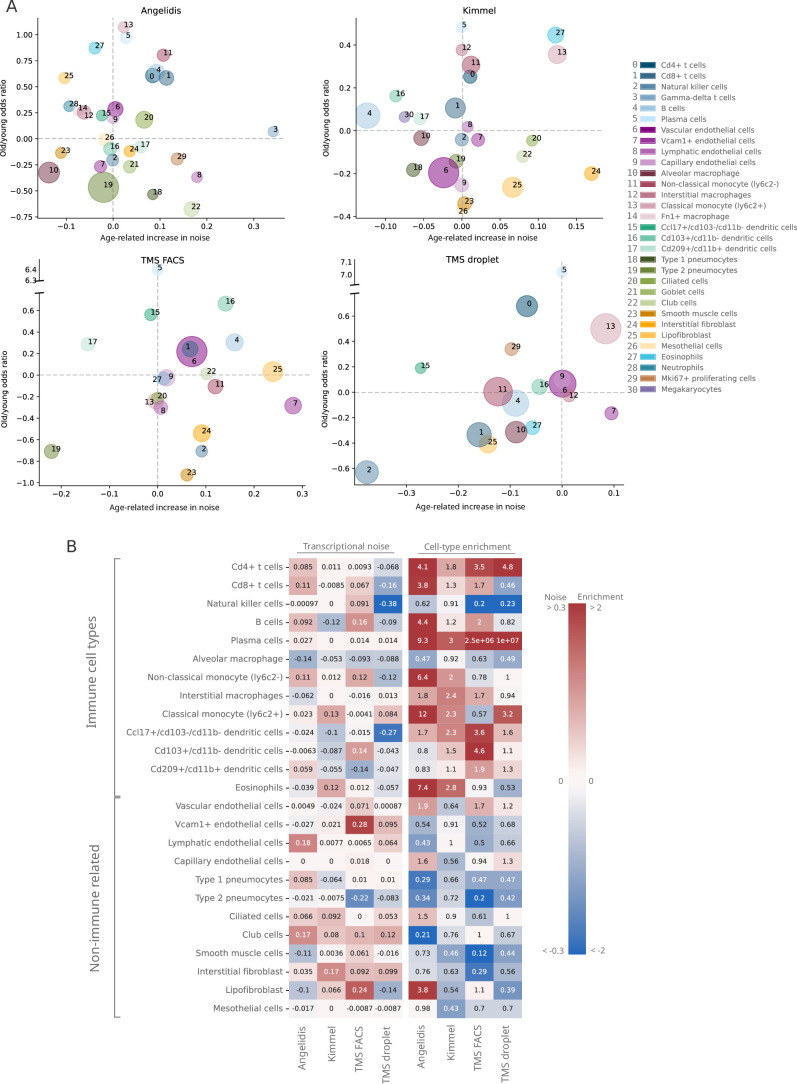
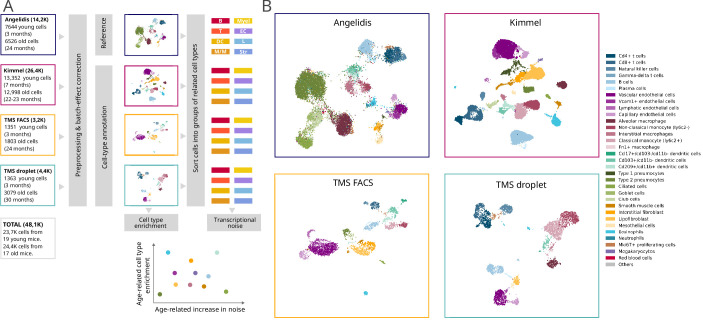
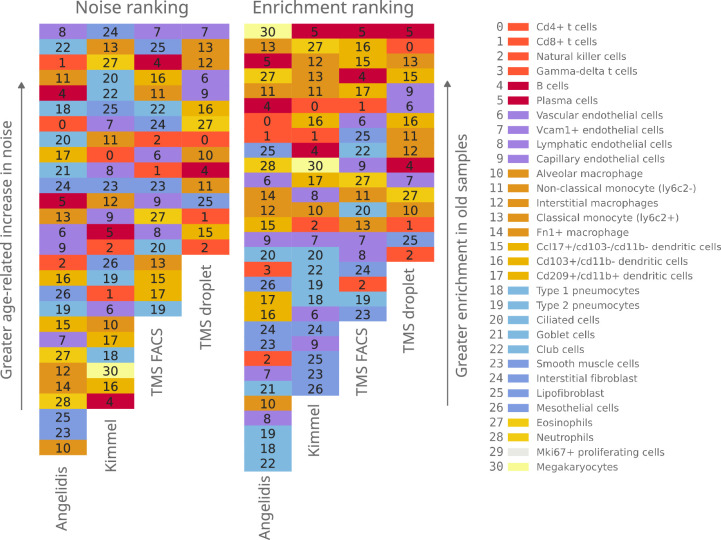
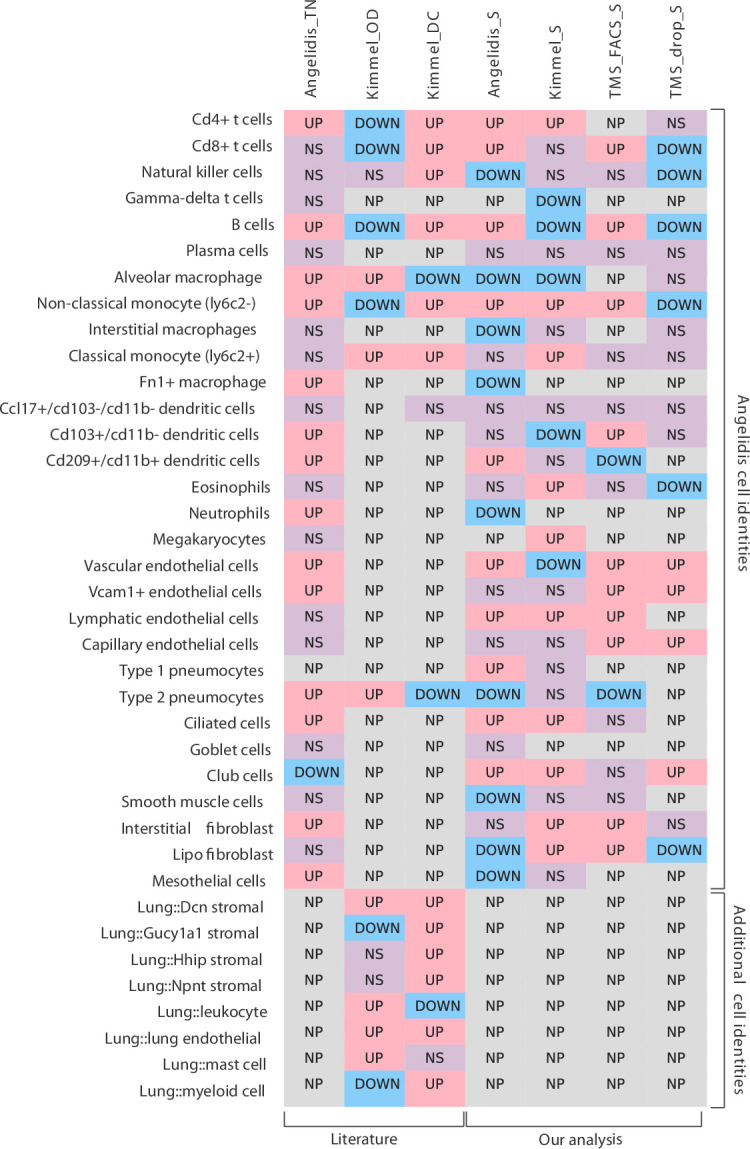
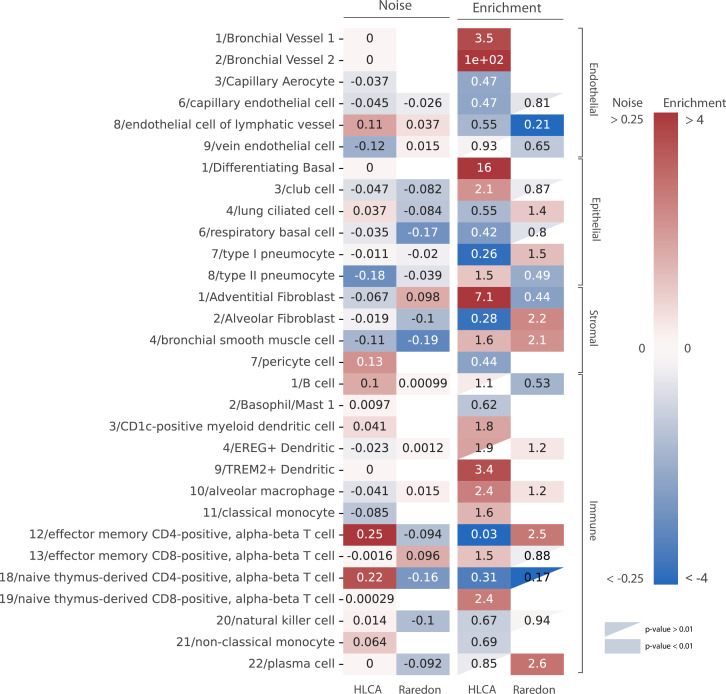
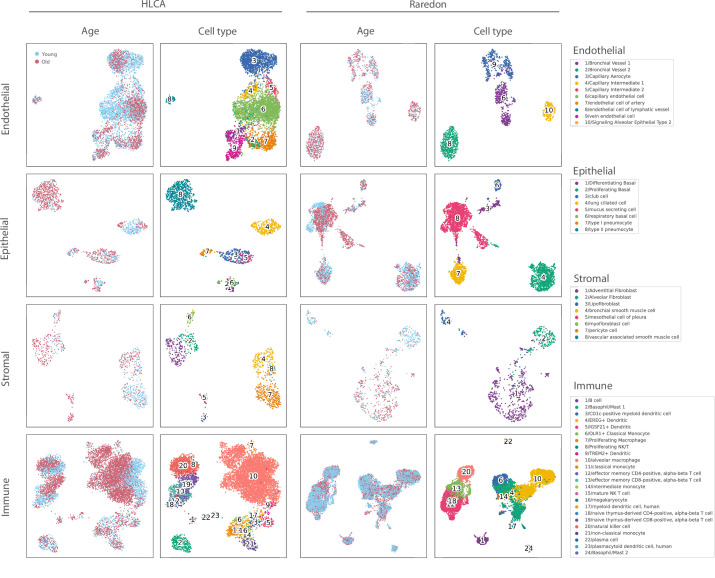
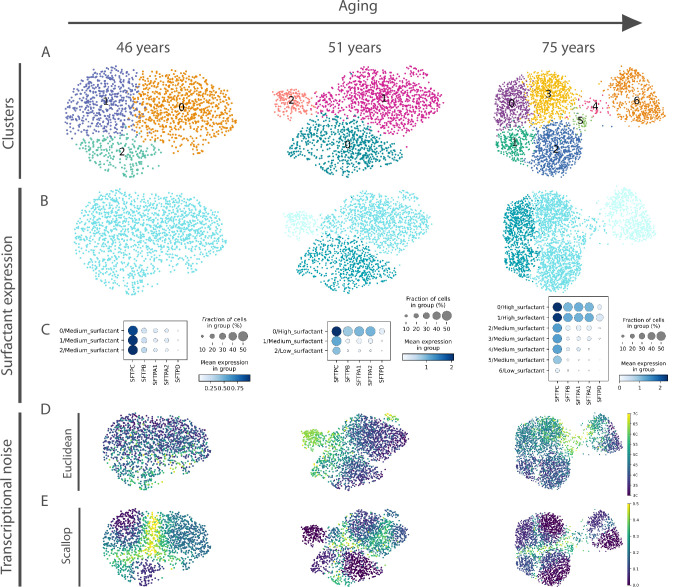
Aging is often associated with a loss of cell type identity that results in an increase in transcriptional noise in aged tissues. If this phenomenon reflects a fundamental property of aging remains an open question. Transcriptional changes at the cellular level are best detected by single-cell RNA sequencing (scRNAseq). However, the diverse computational methods used for the quantification of age-related loss of cellular identity have prevented reaching meaningful conclusions by direct comparison of existing scRNAseq datasets. To address these issues we created Decibel, a Python toolkit that implements side-to-side four commonly used methods for the quantification of age-related transcriptional noise in scRNAseq data. Additionally, we developed Scallop, a novel computational method for the quantification of membership of single cells to their assigned cell type cluster. Cells with a greater Scallop membership score are transcriptionally more stable. Application of these computational tools to seven aging datasets showed large variability between tissues and datasets, suggesting that increased transcriptional noise is not a universal hallmark of aging. To understand the source of apparent loss of cell type identity associated with aging, we analyzed cell type-specific changes in transcriptional noise and the changes in cell type composition of the mammalian lung. No robust pattern of cell type-specific transcriptional noise alteration was found across aging lung datasets. In contrast, age-associated changes in cell type composition of the lung were consistently found, particularly of immune cells. These results suggest that claims of increased transcriptional noise of aged tissues should be reformulated.

Keywords: aging; cell identity; computational biology; human; lung; mouse; single-cell RNA sequencing; systems biology; transcription; variability.

Plain language summary

The human body contains hundreds of different cell types which vary greatly in shape and size despite all sharing the same genetic material. This is because each cell switches on, or ‘expresses’, a unique set of genes that gives them a specific identity, such as becoming a nerve or a muscle cell. Recent studies have shown that cells in some tissues tend to lose their identity with age, and activate some of the genes that define them less strongly. This results in seemingly identical cells expressing the same genes in a more variable way, a phenomenon commonly referred to as noise. A technique called single-cell RNA sequencing is typically used to measure the activity of genes in individual cells, and has been used to study the role of noise in a wide range of aging tissues. However, the results of these studies have been analyzed using different computational methods, making it difficult to make comparisons between tissues and organisms. This has led to an ongoing debate about whether increased noise is a signature feature of aging, and if it is experienced throughout the body or restricted to certain cell types. To overcome this, Ibáñez-Solé, Ascensión et al. developed two new computational tools for analyzing noise and changes in cell identity: these were then applied to seven unique sequencing datasets which had been collected from various tissues in humans and mice at different ages. While there were some differences in the level of noise between young and old cells, these changes were not consistent across tissues and organisms. In contrast, other features associated with aging were consistently found in each of the sequencing datasets. The role of noise in aging has been gaining increasingly more attention in the scientific literature. However, the findings of Ibáñez-Solé, Ascensión et al. suggest that this phenomenon is not a hallmark of the aging process, and that the field should focus on other factors that reduce the health of tissues and cells as organisms get older. The computational approach they developed could also be used to evaluate the role of noise in other contexts, such as certain diseases.


Conflict of interest statement

OI, AA, MA, AI No competing interests declared

Figures

Figure 1.
Figure 1.. Overview of computational methods for the quantification of transcriptional noise and example workflow in Scallop.
(A) The methods implemented in Decibel Python toolkit are summarized through diagrams depicting how they measure transcriptional noise. (1) Biological variation (whole transcriptome-based Pearson’s correlation distance between each cell and the mean expression vector), divided by the technical variation (External RNA Controls Consortium [ERCC] spike-in based distance; Enge et al., 2017). (2) Mean whole transcriptome-based Euclidean distance to cell type average (Enge et al., 2017). (3) Mean invariant gene-based Euclidean distance to tissue average (Enge et al., 2017). (4) GCL (Levy et al., 2020) per cell type. Stars represent the ‘center’ of each cluster (average gene expression for each cell type). (B) Scallop: example workflow on a 16 cell dataset. A reference clustering solution (Ref) is obtained by running a community detection algorithm (default: Leiden) on the whole dataset. Three clusters are obtained: A (blue), B (green), and C (orange). Then, a subset of cells is randomly selected and subjected to unsupervised clustering n_trials = 10 times (cells not selected in each bootstrap iteration are shown in gray). The cluster labels across bootstrap iterations are harmonized by mapping the cluster labels with the greatest overlap, using the Hungarian method (Munkres, 1957). A consensus clustering solution is derived by selecting the most frequently assigned cluster label per cell, and the membership score is computed as the frequency with which the consensus label was assigned to each cell. Scallop measures noise as a 1 ‍ − membership value assigned to each cell.
Figure 1—figure supplement 1.
Figure 1—figure supplement 1.. Performance of Scallop and two distance-to-centroid methods on four artificial datasets with increasing transcriptional noise.
(A) Uniform manifold approximation and projections showing the cell type labels (1–9) for the four artificial datasets with different degrees of noise. All four datasets consist of 10 K cells and have the same cellular composition. Datasets are shown from least to most noisy: low, medium low, medium high, and high noise. De.prob represents the probability that a gene is differentially expressed between cell types in the dataset. (B–D) The output of three methods for the quantification of transcriptional noise: Scallop (B), whole transcriptome-based euclidean distance to cell type mean (C), and invariant gene-based euclidean distance to tissue mean (D).
Figure 1—figure supplement 2.
Figure 1—figure supplement 2.. Ability of Scallop and a distance-to-centroid method to detect noisy cells within cell type clusters.
(A) Uniform manifold approximation and projections (UMAPs) showing the cell type labels (1–9) and the top 10% noisiest and 10% most stable cells according to Scallop and a distance-based method (whole-transcriptome Euclidean distance to the cell type mean) for three artificial datasets with increasing transcriptional noise (medium low, medium high, and high from Figure 1—figure supplement 1). (B) UMAPs showing cell type labels for the three artificial datasets. Area on the UMAP that contains the noisiest cells is highlighted, and the cell type labels that are most represented in it are shown. Stripplots over boxplots showing the distribution of transcriptional noise per cell type, as measured by Scallop and the whole-transcriptome Euclidean distance to cell type mean.
Figure 1—figure supplement 3.
Figure 1—figure supplement 3.. Effect of cellular composition on the performance of Scallop.
(A) Uniform manifold approximation and projections (UMAPs) showing the cell type labels for five equally sized datasets (4500 cells) with the same cell type populations (1–9) in different relative abundances. Datasets are shown from most to least imbalanced, according to their imbalance degree (ID). Cell type labels shown on the UMAP plots are equivalent across cell types. (B) Absolute and relative (%) abundance of each cell type. (C) Transcriptional noise as measured by Scallop: 1 - membership to clusters. (D) Top noisy/stable cells: 10% noisiest and 10% most stable cells according to Scallop. (E) Stripplots over boxplots showing the distribution of transcriptional noise values per cell type. (F) Percentage of noise (averaged over all the cells constituting each cluster).
Figure 1—figure supplement 4.
Figure 1—figure supplement 4.. Effect of dataset size on the performance of Scallop.
(A) Artificial datasets with different sizes (number of cells). All datasets were obtained by subsampling cells from the same dataset and contain the same nine cell types. (B) Average percentage of noise per cell type in each of the datasets. (C) Stripplots showing the distribution of transcriptional noise values in the two extreme datasets (N=1000 and N=10,000 cells).
Figure 1—figure supplement 5.
Figure 1—figure supplement 5.. Effect of the number of genes on the performance of Scallop.
(A) Uniform manifold approximation and projection plots of artificial datasets where the expression of top 10 markers for the cell type Group2 has been set to zero. We test the effect of removing the gene markers that define the cell type Group2. (B) Stripplots showing the distribution of transcriptional noise per cell type in four datasets containing 5 K, 8 K, 11 K, and 14 K genes. (C) Average percentage of noise per cell type in each dataset.
Figure 1—figure supplement 6.
Figure 1—figure supplement 6.. Effect of marker expression on the performance of Scallop.
(A) Uniform manifold approximation and projections (UMAPs) showing the cell type labels (1–9) for the 10 K medium high noise artificial dataset and 10 versions of the same dataset where the top 10 markers of cell type Group2 have been removed. Top1 represents a dataset that has had the expression of the first gene marker for Group2 set to zero, Top2 has had the first 2 gene markers set to zero, and so on. The cell type under study (Group2) is labeled with a ‘2’ on each UMAP. (B) Transcriptional noise values for Group2 cells as we remove its main markers from the dataset. The average percentage of transcriptional noise is shown on top of the stripplots. (C) UMAPs showing the expression of five gene markers from the top 10 list.
Figure 1—figure supplement 7.
Figure 1—figure supplement 7.. Performance of Scallop in comparison to pre-existing methods for the quantification of transcriptional noise.
The different methods were tested on a dataset of 8278 human T lymphocytes. (A) Uniform manifold approximation and projections (UMAPs) and dotplot showing CD3, CD4, and CD8 marker gene expression per cluster. (B) Representation of transcriptional noise levels, as measured by using two distance-to-centroid methods (euc_dist and euc_dist_tissue_invar), 1 - membership (scallop_noise) and global coordination level (GCL). (C) The 10% most stable (purple) and 10% most unstable (red) cells are represented on the UMAP plots for Euclidean distance to cell type mean (top row) and Scallop methods (bottom row), respectively.
Figure 1—figure supplement 8.
Figure 1—figure supplement 8.. Scallop robustness in relation to input parameters.
The plots on the left show the median correlation distance between membership scores of different runs of Scallop against (A) the number of trials, (B) the fraction of cells used in each bootstrap, and (C) the resolution given to the clustering method (Leiden) in five independent scRNAseq datasets (PBMC3K, Joost et al., 2016; Paul et al., 2015; Moignard et al., 2015, Heart10K). The median correlation distance was computed over 100 runs of Scallop. The swarmplots on the right show the distribution of the correlation distances between membership scores against each of the input parameters for the heart10k dataset. The median is shown as a red point. While, for the sake of clarity, a random sample of 100 correlation distances is shown for each value of the parameter under study, the median was computed using all the correlation distances. Scallop membership scores converge as we increase the number of bootstrap iterations and the fraction of cells used in the clustering.
Figure 1—figure supplement 9.
Figure 1—figure supplement 9.. Stable cells as identified with Scallop are more representative of the cell type than unstable cells.
Distribution of log-fold changes (top row) and adjusted p-values (middle row) of the first 100 differentially expressed genes (DEGs) between each cell type or subtype and the rest of the cells in six cell types and subtypes from the 10× PBMC3K dataset. The overlap between the DEGs found when using all of the cells, only the stable cells, and only the unstable cells is also shown (bottom row). The adjusted p-values obtained with all the cells are equivalent to those obtained using only the most stable half of the cells. In contrast, the differential expression of many genes is not statistically significant when using the unstable half from each population. The overlap between the top 100 DEGs obtained is very high between the stable cells and all cell subsets, whereas DEGs obtained in unstable cells have a very low intersection with all cells.
Figure 2.
Figure 2.. No consistent increase in transcriptional noise detected in seven single-cell RNA sequencing (scRNASeq) datasets of aging at the tissue level.
The graphs show the amount of transcriptional noise, computed as 1 - membership to cell type clusters, in the young and old age groups of seven scRNAseq datasets of different tissues. For each dataset, the distribution of transcriptional noise values is shown as a stripplot over a boxplot, where the whiskers represent 1.5 times the interquartile range. Next to them the proportions of stable and noisy cells (noise ≥0.2) per age group are shown (purple bars = stable cells, pink bars = noisy cells). At the bottom right panel, the percentage of noisy cells with a transcriptional noise over a cutoff of 0.2 is plotted against the cutoff. Each colored line represents a different dataset.
Figure 2—figure supplement 1.
Figure 2—figure supplement 1.. Composition of the seven single-cell RNA sequencing datasets of aging used in the human aging lung analysis.
Uniform manifold approximation and projections (UMAPs) showing the age and cell type composition of the seven datasets used in the analysis of the age-related transcriptional noise at the tissue level. The UMAPs show the final composition of the datasets used in the experiment. The cell type annotations were obtained from the original authors in all datasets except Kimmel lung, where the labels from Angelidis were projected onto the dataset.
Figure 2—figure supplement 2.
Figure 2—figure supplement 2.. Measurements of transcriptional noise on seven single-cell RNA sequencing datasets of aging using computational methods implemented in Decibel.
Stripplots showing the distribution of noise values, as measured by the four alternative methods (biological variation over technical variation, Euclidean distance to cell type mean, Euclidean distance to tissue mean using invariant genes, and global coordination level - GCL) in the seven datasets used in the analysis of the age-related transcriptional noise at the tissue level. Boxplots and their whiskers represent the interquartile range (IR) and 1.5*IR, respectively. ERCC, External RNA Controls Consortium.
Figure 3.
Figure 3.. Lack of evidence for an increase in transcriptional noise of the murine aging lung and detection of an enrichment in immune cells.
(A) Bubble chart of transcriptional noise and cell type enrichment (old/young odds ratio [OR]) of 31 murine lung cell identities. The age-related change in transcriptional noise (horizontal axis) is computed by Scallop as the decrease in median membership score per cell identity between young and old cells. The enrichment of each cell type in old samples with respect to their young counterpart is represented as the old/young OR (vertical axis). The area of the bubbles represents the expected proportion of each cell type in the whole dataset according to the binomial generalized linear model fitted for that dataset. (B) Immune cell type enrichment but not age-associated increase in transcriptional noise, is consistently detected in old mice lungs. The increase in transcriptional noise associated with aging (left) and the cell type enrichment (right) are shown for several lung cell identities classified on the left as immune and non-immune. Cell identities present in at least three out of the four studied datasets are shown, and the age-related difference in transcriptional noise of missing cell identities is imputed from the remaining three measurements (mean difference across datasets).
Figure 3—figure supplement 1.
Figure 3—figure supplement 1.. Composition of the four single-cell RNA sequencing datasets of the murine aging lung used in this figure.
(A) Experimental approach. Four murine aging lung datasets were preprocessed and cell type-annotated. The cell-type labels from Angelidis were used as a reference to annotate the rest of the datasets. Differences in cell-type abundance between young and old mice were quantified using generalized linear models. From each dataset, eight subsets of related cell types were created to classify the 31 cell types into 8 categories, which were used as input for Scallop to analyze the differences in cell-to-cell variability. (b) Cell type-annotated mouse lung datasets. Uniform manifold approximation and projection plots showing the four datasets with their cell type annotations.
Figure 3—figure supplement 2.
Figure 3—figure supplement 2.. Qualitative ranking of murine aging lung cell types according to transcriptional noise and cell type enrichment.
The 31 detected lung cell types were classified in the Noise ranking (left) according to their greater age-related increase in noise. They were also classified in the Enrichment ranking (right) according to their greater enrichment in old samples. Cell categories that were represented by fewer than 100 cells were excluded from the transcriptional noise evaluation and therefore do not appear in the plot. Specific cell types are shown in the same color and with the same numbers as specified in the legend.
Figure 3—figure supplement 3.
Figure 3—figure supplement 3.. Comparison of the originally reported cell type-associated increase in transcriptional noise with the results obtained with Scallop.
The content of the first three columns was drawn from the original publications (Angelidis et al., 2019; Kimmel et al., 2019). More specifically, Angelidis_TN is the transcriptional noise per cell identity on the Angelidis dataset (from their Figure 2); Kimmel_OD is the gene overdispersion per cell type on the Kimmel dataset (from their Figure 2B); and Kimmel_DC is the cell-cell heterogeneity per cell identity measured as the Euclidean distance to the centroid of the cell identity for a particular age. Columns 4–7 summarize the results of our analysis of age-related loss of cell type identity in the murine lung. Specifically, Angelidis_S, Kimmel_S, TMS_FACS_S, and TMS_drop_S report the transcriptional noise per cell identity on the four datasets, measured as the difference in median membership score between young and old individuals. The cell identities used are those drawn from Angelidis. Since some cell identities from Kimmel dataset did not have a 1:1 correspondence to the Angelidis cell identities, they are shown using their original notation at the bottom of the table (‘Additional cell identities’). UP/DOWN: age-related increase/decrease in noise, NS: the difference in noise between young and old individuals is not statistically significant. NP: the cell identity was not present in the dataset in sufficient amounts to perform the analysis. For most cell types, it can be concluded that there is little overlap between cell identity-specific noise measurements across datasets and methods.
Figure 4.
Figure 4.. Human aging lungs show no increase in transcriptional noise but consistent depletion and enrichment of specific endothelial and immune cell types.
The increase in transcriptional noise associated with aging (Noise, left) and the cell type enrichment (Enrichment, right) values are shown for 30 human lung cell identities as detected in the human lung cell atlas (HLCA) and Raredon datasets (Raredon et al., 2019; Travaglini et al., 2020). For each cell type, its age-related increase in noise (difference in 1 ‍ − membership between old and young individuals per cell type) and the old/young odds ratio (OR) are shown. Only cell types whose enrichment/depletion is statistically significant in at least one of the datasets are shown, and the ORs associated with a p-value >0.01 are shown as a triangle. The color-bar for the enrichment is shown in a logarithmic scale.
Figure 4—figure supplement 1.
Figure 4—figure supplement 1.. Composition of the two single-cell RNA sequencing datasets of the human aging lung used in this figure.
The uniform manifold approximation and projection plots with the age and cell type identity annotations are shown for each tissue compartment (endothelial, epithelial, stromal, and immune) and each dataset separately.
Figure 5.
Figure 5.. Euclidean distance-to-centroid methods are unable to distinguish bona fide transcriptional noise from alternative cell fate specification.
(A) An increasing number of alveolar macrophage subclusters (as obtained with Leiden) are detected in three donors (aged 46, 51, and 75 years) from the Travaglini et al., 2020 (human lung cell atlas) dataset. (B–C) The new cell clusters are characterized by differential surfactant protein gene expression levels, as clearly seen on the uniform manifold approximation and projection (B) and dotplot (C) representations. (D–E) Transcriptional noise measurements, using the Euclidean distance to cell type mean (D) and 1 ‍ − membership using Scallop (E), demonstrate that only the latter method is able to distinguish bona fide transcriptional noise from the formation of new clusters that are transcriptionally stable.
Figure 5—figure supplement 1.
Figure 5—figure supplement 1.. Expression of surfactant protein genes by human alveolar macrophages.
Differential expression by alveolar macrophage cell clusters of the genes coding for surfactant proteins SFTPA1, SFTPA2, SFTPB, SFTPC, and SFTPD is shown for three donors (aged 46, 51, and 75) of the Travaglini et al. (human lung cell atlas) dataset.
Figure 5—figure supplement 2.
Figure 5—figure supplement 2.. Alveolar macrophages are the most affected by aging.
Transcriptional noise in aged pancreatic β-cells. β-cells from young and old donors were isolated from the human aging pancreas dataset by Enge et al., 2017. (A) Uniform manifold approximation and projections (UMAPs) showing all pancreatic cell types and the selected β-cells with their corresponding cell type, age, and donor annotations. The β-cells from the 21-year-old donor are highlighted on the UMAP to point out that most cells from that donor appear clustered together on the UMAP, while the cells coming from the rest of the donors are spread over the whole plot. (B) Four methods for the quantification of transcriptional noise that yield cell-wise measurements: External RNA Controls Consortium (ERCC)-based (biological over technical variation), euc_dist (whole transcriptome-based Euclidean distance to cell type mean expression), euc_dist_invar (invariant gene-based Euclidean distance to average tissue expression), note that in this case the dataset only contains a single cell type, so the distance is computed to the average β-cell expression, scallop (1 - membership to most frequently assigned cluster). (C) Global Coordination Level per age category (number of divisions: 50) and Euclidean distance between 1000 randomly selected cells. (D) UMAPs showing the noise measurements per cell type using the same four methods (as in B). (E) Boxplots showing the distribution of transcriptional noise values for each donor. We can see that, rather than observing an age-dependent pattern, the 21-year-old donor presents much lower transcriptional noise values than the rest of the donors. However, there is no significant difference between the 22-year-old donor and the rest of the donors. We conclude that the statistically significant differences between the young and old age categories can be attributed to the abnormal noise values obtained for the 21-year-old donor. (F) UMAP and boxplots showing insulin expression per cell and per donor. The 21-year-old donor presents an abnormally low insulin expression.
Appendix 4—figure 1.
Appendix 4—figure 1.. Uniform manifold approximation and projection plot showing the samples from the seven individuals present in the Kimmel lung dataset.
Even though most cells cluster together according to their cell type rather than by individual, samples from donor Y1 cluster together. We observed that there was a big batch effect between this and the rest of the individuals. Histogram showing the log-transformed total number of counts/cell per individual mice. The distribution of counts/cell of the samples from mouse Y1 is very different to the rest of the samples. This difference could not be overcome using the batch-effect correction tool bbknn. Downsampling the counts so that the number of counts/cell was balanced across individual mice did not solve the problem either. Therefore, we decided to discard the samples Y1L1 and Y1L2.
Appendix 5—figure 1.
Appendix 5—figure 1.. Murine aging lung datasets: sample composition and cell type marker expression.
(A) There are no mouse- or age-related batch effects. Uniform manifold approximation and projection plots of the four aging lung datasets showing the age and mouse labels. Cells cluster according to their cell type rather than to their age group or individual mouse. (B) Expression of lung cell type markers by each annotated cluster. The dotplots show the expression of the cell type markers from Angelidis et al., 2019 on the four annotated lung datasets. The size of the dots represents the fraction of cells expressing one particular marker in the group of cells assigned a particular cell type label. The color represents the level of expression of the marker in that group averaged over the cells that have a positive expression of that marker.

References

    1. Almanzar N, Antony J, Baghel AS. A single-cell transcriptomic atlas characterizes ageing tissues in the mouse. Nature. 2020;583:590–595. doi: 10.1038/s41586-020-2496-1. - DOI - PMC - PubMed
    1. Angelidis I, Simon LM, Fernandez IE, Strunz M, Mayr CH, Greiffo FR, Tsitsiridis G, Ansari M, Graf E, Strom T-M, Nagendran M, Desai T, Eickelberg O, Mann M, Theis FJ, Schiller HB. An atlas of the aging lung mapped by single cell transcriptomics and deep tissue proteomics. Nature Communications. 2019;10:963. doi: 10.1038/s41467-019-08831-9. - DOI - PMC - PubMed
    1. Bahar R, Hartmann CH, Rodriguez KA, Denny AD, Busuttil RA, Dollé MET, Calder RB, Chisholm GB, Pollock BH, Klein CA, Vijg J. Increased cell-to-cell variation in gene expression in ageing mouse heart. Nature. 2006;441:1011–1014. doi: 10.1038/nature04844. - DOI - PubMed
    1. Blondel VD, Guillaume JL, Lambiotte R, Lefebvre E. Fast unfolding of communities in large networks. Journal of Statistical Mechanics. 2008;1:10008. doi: 10.1088/1742-5468/2008/10/P10008. - DOI
    1. Cagan A, Baez-Ortega A, Brzozowska N, Abascal F, Coorens THH, Sanders MA, Lawson ARJ, Harvey LMR, Bhosle S, Jones D, Alcantara RE, Butler TM, Hooks Y, Roberts K, Anderson E, Lunn S, Flach E, Spiro S, Januszczak I, Wrigglesworth E, Jenkins H, Dallas T, Masters N, Perkins MW, Deaville R, Druce M, Bogeska R, Milsom MD, Neumann B, Gorman F, Constantino-Casas F, Peachey L, Bochynska D, Smith ESJ, Gerstung M, Campbell PJ, Murchison EP, Stratton MR, Martincorena I. Somatic mutation rates scale with lifespan across mammals. Nature. 2022;604:517–524. doi: 10.1038/s41586-022-04618-z. - DOI - PMC - PubMed

Publication types