. 2022 Dec 28:11:e82207.
doi: 10.7554/eLife.82207.

A choline-releasing glycerophosphodiesterase essential for phosphatidylcholine biosynthesis and blood stage development in the malaria parasite

Affiliations

A choline-releasing glycerophosphodiesterase essential for phosphatidylcholine biosynthesis and blood stage development in the malaria parasite

Abhinay Ramaprasad et al. Elife. .

Abstract

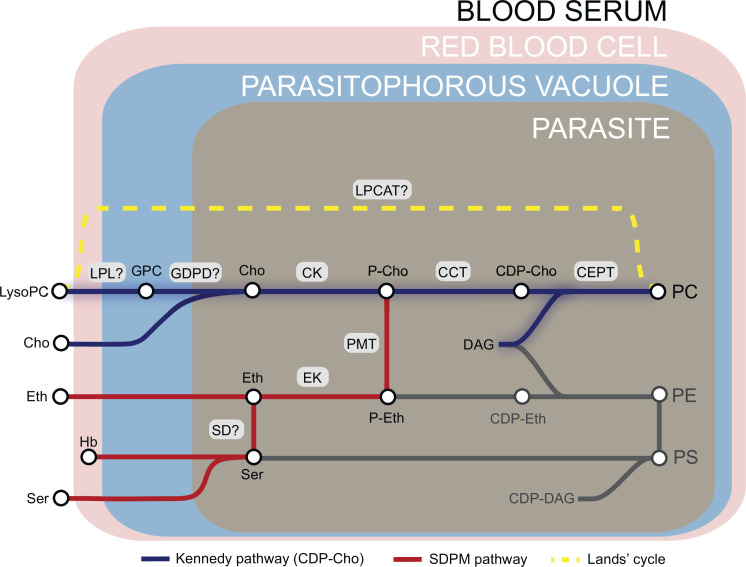
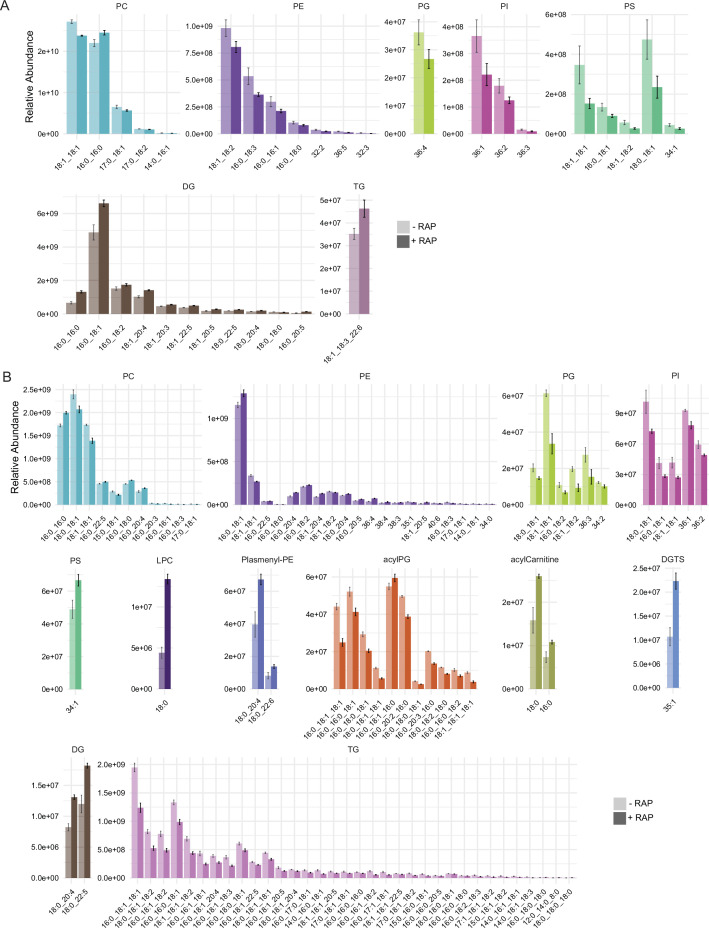
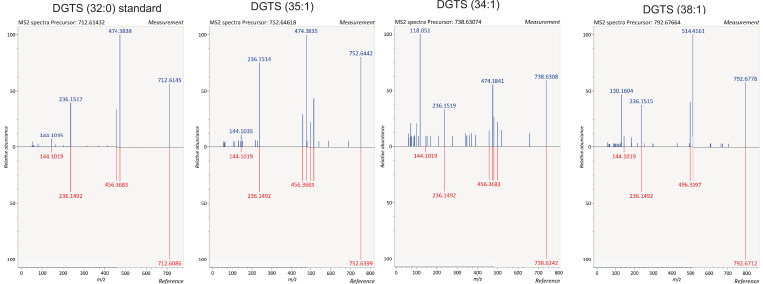
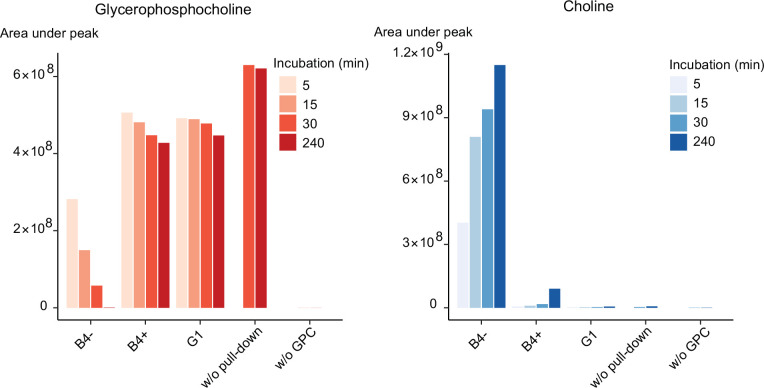
The malaria parasite Plasmodium falciparum synthesizes significant amounts of phospholipids to meet the demands of replication within red blood cells. De novo phosphatidylcholine (PC) biosynthesis via the Kennedy pathway is essential, requiring choline that is primarily sourced from host serum lysophosphatidylcholine (lysoPC). LysoPC also acts as an environmental sensor to regulate parasite sexual differentiation. Despite these critical roles for host lysoPC, the enzyme(s) involved in its breakdown to free choline for PC synthesis are unknown. Here, we show that a parasite glycerophosphodiesterase (PfGDPD) is indispensable for blood stage parasite proliferation. Exogenous choline rescues growth of PfGDPD-null parasites, directly linking PfGDPD function to choline incorporation. Genetic ablation of PfGDPD reduces choline uptake from lysoPC, resulting in depletion of several PC species in the parasite, whilst purified PfGDPD releases choline from glycerophosphocholine in vitro. Our results identify PfGDPD as a choline-releasing glycerophosphodiesterase that mediates a critical step in PC biosynthesis and parasite survival.

Keywords: P. falciparum; Plasmodium; biochemistry; chemical biology; glycerophosphodiesterase; infectious disease; lysophosphatidylcholine; malaria; microbiology; phosphatidylcholine synthesis.

Plain language summary

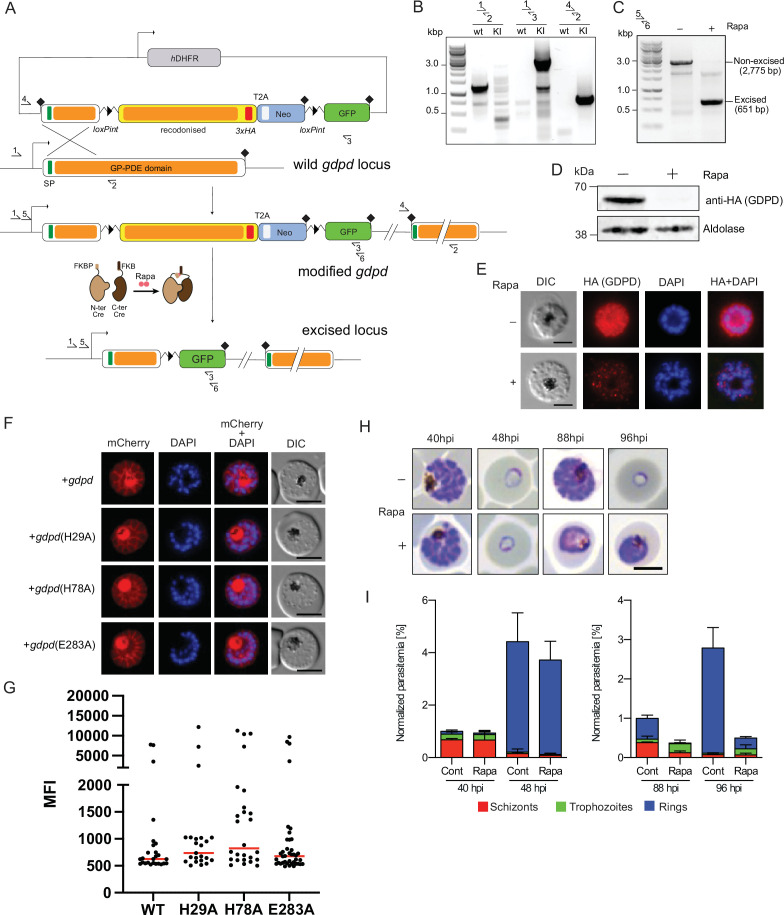
Malaria kills over half a million people every year worldwide. A single-celled parasite called Plasmodium falciparum is responsible for the most lethal form of the disease. This malaria-causing agent is carried by mosquitos which transmit the parasite to humans through their bite. Once in the bloodstream, the parasite enters red blood cells and starts to replicate so it can go on to infect other cells. Like our cells, P. falciparum is surrounded by a membrane, and further membranes surround a number of its internal compartments. To make these protective coats, the parasite has to gather a nutrient called choline to form an important building block in the membrane. The parasite gets most of its choline by absorbing and digesting a molecule known as lysoPC found in the bloodstream of its host. However, it was unclear precisely how the parasite achieves this. To address this question, Ramaprasad, Burda et al. used genetic and metabolomic approaches to study how P. falciparum breaks down lysoPC. The experiments found that mutant parasites that are unable to make an enzyme called GDPD were able to infect red blood cells, but failed to grow properly once inside the cells. The mutant parasites took up less choline and, as a result, also made fewer membrane building blocks. The team were able to rescue the mutant parasites by supplying them with large quantities of choline, which allowed them to resume growing. Taken together, the findings of Ramaprasad, Burda et al. suggest that P. falciparum uses GDPD to extract choline from lysoPC when it is living in red blood cells. More and more P. falciparum parasites are becoming resistant to many of the drugs currently being used to treat malaria. One solution is to develop new therapies that target different molecules in the parasite. Since it performs such a vital role, GDPD may have the potential to be a future drug target.


Conflict of interest statement

AR, PB, EC, AS, SP, CW, FH, JM, LC, TG, MB No competing interests declared

Figures

Figure 1.
Figure 1.. Phosphatidylcholine (PC) synthesis in malaria parasites.
The CDP-choline dependent Kennedy pathway, the SDPM pathway and Lands’ cycle produce PC from the metabolic precursors lysoPC, choline (Cho), ethanolamine (Eth), serine (Ser, including that obtained from digestion of haemoglobin, Hb), and fatty acids, all salvaged from the host milieu. PC is primarily produced through the Kennedy pathway using Cho sourced mainly from serum lysoPC. Breakdown of lysoPC into choline is thought to occur in the parasitophorous vacuole via a two-step hydrolysis process involving an unidentified lysophospholipase (LPL) and a glycerophosphodiesterase (GDPD; PF3D7_1406300) (this work). Other abbreviations: CCT, CTP:phosphocholine cytidyltransferase; CEPT, choline/ethanolamine-phosphotransferase; CK, choline kinase; DAG, diacylglycerol; EK, ethanolamine kinase; GPC, glycerophosphocholine; LPCAT, lysophosphatidylcholine acyltransferase; PMT, phosphoethanolamine methyltransferase; SD, serine decarboxylase. ‘?’ indicates parasite enzymes not yet identified.
Figure 2.
Figure 2.. Subcellular localization and conditional ablation of PfGDPD.
(A) Endogenous PfGDPD tagged with GFP shows dual localization in the cytosol and PV. GDPD colocalization with soluble PV marker, SP-mScarlet (Mesén-Ramírez et al., 2019), expressed episomally in the GDPD-GFP line is shown in mature schizonts (top) and free merozoites (bottom). Scale bars, 5 µm. (B) Strategy used for conditional disruption of PfGDPD in parasite line GDPD:HA:loxPint. The predicted catalytic domain (GP-PDE, glycerophosphodiester phosphodiesterase; orange) was floxed by introducing an upstream loxPint and a loxP site following the translational stop site. Sites of targeted Cas9-mediated double-stranded DNA break (scissors), left and right homology arms for homology-directed repair (5’ and 3’), introduced loxP sites (arrow heads), secretory signal peptide (green), recodonized sequences (yellow), 3xHA epitope (red) and diagnostic PCR primers (half arrows 1–4) are indicated. RAP-induced DiCre-mediated excision results in removal of the catalytic domain. (C) Diagnostic PCR 12 hr following mock- or RAP-treatment of ring-stage GDPD:HA:loxPint parasites (representative of three independent experiments) confirms efficient gene excision. Expected amplicon sizes are indicated. (D) Western blots (representative of two independent experiments) showing successful RAP-induced ablation of PfGDPD expression in cycle 0 GDPD:HA:loxPint parasites sampled at 24 hr and 48 hr post invasion and cycle 1 trophozoites (72 hr). HSP70 was probed as loading control. (E) IFA of RAP-treated (+) and mock-treated (-) mature GDPD:HA:loxPint cycle 0 schizonts following mock- (-) or RAP-treatment (+) at ring-stage, showing that expression of PfGDPD-HA is lost following RAP treatment. Scale bar, 5 µm. (F) RAP-treatment results in loss of replication in two clonal lines, B4 (black) and B8 (grey), of GDPD:HA:loxPint parasites (error bars, ± SD). Data shown are averages from triplicate biological replicates using different blood sources. (G) Genetic complementation with an episomal, constitutively expressed mCherry-tagged PfGDPD fully restores growth of Rapa-treated GDPD:loxPint:HA:Neo-R parasites. In contrast, mutant PfGDPD alleles carrying Ala substitutions of the catalytic H29 and H78 residues or the metal-binding residue E283 do not complement. Inset, zoomed AlphaFold model of PfGDPD catalytic groove and coordinated Mg2+ ion, with relevant residues highlighted in red. The erythrocytic cycle when rapalog was added has been designated as cycle 0.
Figure 2—figure supplement 1.
Figure 2—figure supplement 1.. Endogenous tagging of PfGDPD.
(A) Schematic of SLI-based endogenous tagging of PfGDPD. GFP, green fluorescent protein; T2A, skip peptide; Neo-R, neomycin-resistance gene; hDHFR, human dihydrofolate reductase; asterisks, stop codons; arrows, promoters. (B) Diagnostic PCR showing correct integration of the GFP-tagging construct in the GDPD locus.
Figure 2—figure supplement 2.
Figure 2—figure supplement 2.. Diagnostic PCR for successful integration in GDPD:loxPint:HA line.
Diagnostic PCR showing correct integration of the pREP-GDPD modification plasmid in the PfGDPD locus in GDPD:loxPint:HA parasites. Primers used are denoted in Figure 2B.
Figure 2—figure supplement 3.
Figure 2—figure supplement 3.. Conditional knockout of PfGDPD expression using the SLI system.
(A) Schematic of the SLI-based DiCre-mediated conditional knockout strategy. (B) Diagnostic PCR showing correct integration of the SLI modification plasmid in the GDPD locus in the GDPD:loxPint:HA:Neo-R line. (C) Diagnostic PCR 36 hr following mock- or Rapa- treatment confirms efficient gene excision. Expected amplicon sizes are indicated. (D) Western blot of 3xHA-tagged PfGDPD in control and Rapa-treated parasites 48 hr post-Rapa-treatment. (E) IFA of 3xHA-tagged PfGDPD in control and Rapa-treated parasites 48 hr post-Rapa treatment. Scale bars 5 µm. (F) Mutagenesis of several key functional residues does not affect localization of PfGDPD. Live-cell microscopy of C2-arrested GDPD:loxPint:HA:Neo-R schizonts expressing the non-mutant (WT) and mutant PfGDPD coding sequence C-terminally fused to mCherry. Nuclei were stained with DAPI (blue). Scale bars 5 µm. (G) PfGDPD expression levels in PfGDPD complementation cells lines. Late trophozoite and schizont/segmenter stage parasites episomally expressing WT or mutated PfGDPD-mCherry were analyzed by live cell microscopy using the same imaging settings and their mean fluorescence intensity (MFI) was determined. Shown are individual values and medians (red) of 23–40 imaged parasites per line. No statistically significant differences in expression levels between WT and mutated GDPDs were observed (One-way ANOVA, p=0.4219). (H) Light microscopic images of Giemsa-stained parasites following mock- or Rapa-treatment at ring stages. (I) Life stage quantification of parasites at selected time points after Rapa-treatment (error bars, ± SD, triplicate Rapa treatments).
Figure 3.
Figure 3.. PfGDPD is essential for asexual blood stage development.
(A) Light microscopic images of Giemsa-stained cycle 0 and 1 GDPD:HA:loxPint parasites following mock- or RAP-treatment at ring stage in cycle 0 (representative of 2 independent experiments). PfGDPD-null parasites began to exhibit defective development at around 19 hr post-invasion (19 hpi) in cycle 1, producing abnormal trophozoites. The growth defect was confirmed and quantified using flow cytometry to measure parasite DNA content. Fluorescence intensity of the SYBR Green-stained RAP-treated population (red) was detectably lower than that of the control population (grey) from 19 hr into cycle 1. Scale bar, 5 µm. (B) Life stage quantification of GDPD:HA:loxPint parasites at selected time points in cycle 1 (error bars, ± SD, triplicate RAP treatments) following RAP treatment of rings in cycle 0. Mock-treated parasites (DMSO) transitioned normally from trophozoite to schizont stage while RAP-treated parasites showed accumulation of abnormal ring and trophozoite forms. (C) PfGDPD-null parasites exhibit an invasion defect. Fold change in parasitaemia after 4 hr invasion of mock-treated (-) and RAP-treated (+) GDPD:HA:loxPint schizonts under shaking and static conditions (crossbar represents median fold change in four replicate RAP treatments with different blood sources; individual points represent a single replicate). (D) Numbers of merozoites in highly mature cycle 0 schizonts (obtained by arresting egress using the reversible egress inhibitor C2) following mock (-) or RAP-treatment (+) at ring stage. Merozoite numbers were slightly but significantly lower in PfGDPD-null parasites (crossbar represents median; n=50; Student t-test with Bonferroni adjusted p-value). (E) TEM micrographs of control and RAP-treated GDPD:HA:loxPint parasites allowed to mature for ∼40 hr in cycle 1 in order to maximise proportions of abnormal forms. Less haemozoin formation was evident in the digestive vacuole (arrowed) of the PfGDPD-null mutants compared to mock-treated controls. Scale bar, 500 nm. (F) Haemozoin content of individual parasites measured as transmitted polarized light at 44 hpi in cycle 0 and 24 hpi in cycle 1. (crossbar represents median; n=50; Student t-test with Bonferroni adjusted p-value).
Figure 3—figure supplement 1.
Figure 3—figure supplement 1.. TEM images of mock and RAP-treated GDPD:loxPint:HA parasites.
TEM images of mock- and RAP-treated GDPD:loxPint:HA parasites at different stages of development – (from left to right) young trophozoites, late trophozoite (with double nuclei) and a partially segmented schizont. Less haemozoin formation was evident in the digestive vacuole (arrowed) at all stages of development in PfGDPD-null parasites. Scale bar, 500 nm.
Figure 4.
Figure 4.. Choline supplementation rescues growth of PfGDPD-null parasites.
(A) Morphology of PfGDPD-null trophozoites at 32 hr in cycle 1 following RAP treatment of rings in cycle 0 in the presence or absence of choline. Fluorescence intensity of SYBR Green-stained populations at the same timepoint show choline-supplemented PfGDPD-null trophozoites (blue) can surpass the developmental arrest in non-supplemented parasites. Scale bar, 5 µm. (B) Replication of mock- (grey) and RAP-treated (red) GDPD:HA:loxPint parasites in the presence (solid line) or absence (dashed line) of choline (error bars, ± SD, triplicate experiments with different blood sources). (C) Effects of supplementation with different metabolic precursors on the replication of mock- (grey) or RAP-treated (red) GDPD:HA:loxPint parasites. Mean average fold increase in parasitaemia over two erythrocytic cycles was increased by 1 mM choline to close to wild type levels (grey). In contrast, 100 µM ethanolamine effected only a marginal improvement in the replication rate while 1 mM glycerophosphocholine (GPC) and 2 mM serine had no effect. (D) Continuous culture of PfGDPD-null parasites enabled by choline supplementation. Top, IFA showing absence of PfGDPD-HA expression in the emergent parasite population after three erythrocytic cycles of growth in choline-supplemented medium (right). For comparison, parasite populations in cycle 0 following treatment are shown (left and middle). Below, genome sequencing showing RAP-induced excision of the PfGDPD gene and no evidence of the non-excised locus in the choline-supplemented emergent RAP-treated parasite population. Scale bar, 10 µm. (E) Confirmation of the choline dependency of the PfGDPD-null parasite clone G1. Left, parasite cultures (starting parasitaemia 0.1%) were maintained with or without 1 mM choline for two erythrocytic cycles before measuring final parasitaemia (n=6). Right, effects of choline removal on intra-erythrocytic parasite development, assessed at different time points. In all cases results are shown compared to the parental GDPD:HA:loxPint line (B4) without choline supplementation. Scale bar, 5 µm. (F) Concentration-dependence of choline supplementation on replication of the choline-dependent PfGDPD-null parasite clone G1. Parasite cultures (starting parasitaemia 0.1%) were maintained for two erythrocytic cycles in the presence of a range of choline concentrations, before final parasitaemia quantified (n=6). Black dots, individual replicates. Blue dots, mean values. Grey band, dose-dependency curve ± SD.
Figure 5.
Figure 5.. Lipidomic profiling and metabolic labelling of PfGDPD-null parasites show disruption in PC biosynthesis and choline uptake from lysoPC.
(A) Lipidome analysis of mature cycle 0 GDPD:loxPint:HA schizonts following mock-or RAP-treatment at ring stage. The bubble plot shows the fold change in levels of various lipid species in PfGDPD-null schizonts compared to controls (3 independent biological replicates). (B) Metabolic labelling of mock- and RAP-treated GDPD:loxPint:HA parasites by a 14 hr incubation with 2H choline-labelled lysoPC 16:0 during trophozoite development. Dotplots depict percentage change in mean labelled proportions in each PC or lysoPC species (shown as bar graphs) in PfGDPD-null schizonts compared to controls across three independent biological replicates. (C) Metabolic labelling (top panel) and lipidome analysis (bottom panel) of PfGDPD-expressing GDPD:loxPint:HA (B4) and PfGDPD-null parasites (clone G1) by treatment for 18 hr with 2H choline-labelled lysoPC 16:0 during trophozoite development. Choline was removed from the culture medium 24 hr prior to labelling.
Figure 5—figure supplement 1.
Figure 5—figure supplement 1.. Relative peak intensities of the significantly altered lipid species.
Relative peak intensities of the significantly altered lipid species in (A) comparison between mock- or RAP-treated GDPD:loxPint:HA mature schizonts from cycle 0 and (B) comparison between choline-starved GDPD:loxPint:HA (B4) and PfGDPD-null (clone G1) parasites.
Figure 5—figure supplement 2.
Figure 5—figure supplement 2.. Identification of DGTS species.
Identification of DGTS species in lipids extracted from B4 and PfGDPD-null G1 parasites by comparing fragmentation spectra with a commercially available DGTS (32:0) standard.
Figure 5—figure supplement 3.
Figure 5—figure supplement 3.. DNA content-based assessment of parasite development.
DNA content-based assessment of parasite development in choline-starved PfGDPD-null G1 and parental B4 parasites before lipid extraction. No difference in growth was observed between choline-supplemented cultures and cultures 24 hr after removing choline. However, a significant lag in development was observed in labelled G1 parasites (three replicates GL1, GL2, GL3) at 44 hr compared to B4 and choline-supplemented controls.
Figure 6.
Figure 6.. Purified PfGDPD releases choline from GPC.
GPC and choline content in enzymatic reactions set up with affinity-purified GDPD-HA from similar numbers of mock- (B4-) and RAP-treated (B4+) GDPD:loxPint:HA parasites or the GDPD-null clonal parasite line (G1). Pulled-down samples were incubated with 10 mM GPC in a reaction buffer containing 10 mM MgCl2 for different durations at 37°C. Reactions without pulled-down fraction or GPC substrate were included as controls.
Figure 6—figure supplement 1.
Figure 6—figure supplement 1.. Affinity purification of PfGDPD-HA.
Affinity purification of PfGDPD-HA from GDPD:loxPint:HA and GDPD-null parasites. (A) SDS-PAGE stained with Coomassie blue showing saponin lysate, the bound and supernatant fractions. Arrow points to the band only present in mock-treated GDPD:loxPint:HA parasites. (B) Western blot with anti-HA antibody showing abundance of GDPD-HA in mock-treated GDPD:loxPint:HA, residual levels in RAP-treated GDPD:loxPint:HA and absence in GDPD-null clonal parasites.
Figure 6—figure supplement 2.
Figure 6—figure supplement 2.. In silico substrate docking in PfGDPD model.
(A) Structural conservation of PfGDPD active site residues and the Mg2+ binding site. The AlphaFold model of PfGDPD (AF-Q8IM31; shown as a light grey cartoon) indicates structural conservation of the active site residues and the metal ion binding site (coloured sticks) when superimposed onto its closest structural analogue, the magnesium-dependent marine phosphodiesterases KOD1 from Thermococcus kodarensis (4OEC, rmsd = 1.63 Å; tinted purple cartoon). (B) In silico docking and simulation of substrate specificity of PfGDPD. GPC is shown as a stick (C in pink, N in blue, P in orange, O in red), docked into the active site of PfGDPD (unitless ICM-Pro score –10). The GPC phosphate group is found in the vicinity of the active site residues His29 and His78 and the Mg2+ metal ion. ICM docking scores were low (around –10) possibly due to non-optimum side chain conformations in the active site pocket residues of the rigid PfGDPD receptor AlphaFold model. Docking of G3P, GPC, glycerophosphoethanolamine (GPE) and glycerophosphoserine (GPS) were successful with a preference for G3P, GPC, and GPE. As expected, docking with lysoPC (16:0) did not perform well suggesting a low preference for PfGDPD. These results suggest that PfGDPD has a substrate preference for GPC and GPE, but activity against GPS cannot be ruled out. (C) Orthology analysis of GDPD catalytic domain-containing proteins across all apicomplexan parasites and their chromerid ancestors reveals four distinct ortholog groups. Four ortholog groups can be identified within apicomplexan parasites and their algal ancestors (Chromera and Vitrella) with member orthologous genes present (black box) or absent (white box) in some organisms. Orthologs of PfGDPD (PF3D7_1406300) (OG6_139464) are found only the Haematozoan group of apicomplexan parasites (i.e. those possessing an intra-erythrocytic life cycle). Maximum likelihood phylogeny inferred from multiple sequence alignment and the protein domain information for the GDPD orthologs are shown (nodes with bootstrap values >80 are marked; domains: grey, GP-PDE domain; orange, signal peptide; green, transmembrane domain).
Figure 7.
Figure 7.. Ablation of GDPD expression does not induce sexual differentiation.
(A) Replication of mock- (solid line) and RAP-treated (dashed line) clonal line of GDPD:loxPint:HANF54 parasites over three erythrocytic cycles (error bars, ± SD). Data shown are averages from triplicate biological replicates using different blood sources. (B) Light microscopic images of Giemsa-stained GDPD:loxPint:HANF54 parasites at days 0, 2, 3 and 7 post treatment with conditioned media (-RAP+CM, known to induce sexual commitment), DMSO (-RAP) or rapamycin (+RAP). Gametocyte stages were apparent from day 6–7 in cultures treated with conditioned media while DMSO-treated cultures showed normal asexual stage progression and RAP-treated cultures showed development-stalled trophozoite stages from day 3. Images are representative of three independent treatments. Scale bar, 5 µm.
Figure 7—figure supplement 1.
Figure 7—figure supplement 1.. Diagnostic PCR for successful integration in GDPD:loxPint:HANF54 line.
Diagnostic PCR showing correct integration of the pREP-GDPD modification plasmid in the PfGDPD locus in GDPD:loxPint:HANF54 parasites (clonal line D10). Primers used are denoted in Figure 2B.

Similar articles

Cited by

References

    1. Abagyan R, Totrov M. Biased probability monte carlo conformational searches and electrostatic calculations for peptides and proteins. Journal of Molecular Biology. 1994;235:983–1002. doi: 10.1006/jmbi.1994.1052. - DOI - PubMed
    1. Abagyan R, Totrov M, Kuznetsov D. ICM?a new method for protein modeling and design: applications to docking and structure prediction from the distorted native conformation. Journal of Computational Chemistry. 1994;15:488–506. doi: 10.1002/jcc.540150503. - DOI
    1. AbouLaila M, Batadoj D, Salama A, Munkhjargal T, Ichikawa-Seki M, A Terkawi M, Yokoyama N, Igarashi I. Evaluation of the inhibitory effects of miltefosine on the growth of Babesia and Theileria parasites. Veterinary Parasitology. 2014;204:104–110. doi: 10.1016/j.vetpar.2014.05.023. - DOI - PubMed
    1. Ancelin ML, Vial HJ, Philippot JR. Inhibitors of choline transport into Plasmodium-infected erythrocytes are effective antiplasmodial compounds in vitro. Biochemical Pharmacology. 1985;34:4068–4071. doi: 10.1016/0006-2952(85)90390-9. - DOI - PubMed
    1. Ancelin ML, Vial HJ. Quaternary ammonium compounds efficiently inhibit Plasmodium falciparum growth in vitro by impairment of choline transport. Antimicrobial Agents and Chemotherapy. 1986a;29:814–820. doi: 10.1128/AAC.29.5.814. - DOI - PMC - PubMed

Publication types