. 2023 Jan;65(1):65-74.
doi: 10.1111/dgd.12835. Epub 2023 Jan 14.

An ImageJ-based tool for three-dimensional registration between different types of microscopic images

Affiliations

An ImageJ-based tool for three-dimensional registration between different types of microscopic images

Hiroshi Koyama et al. Dev Growth Differ. 2023 Jan.

Abstract

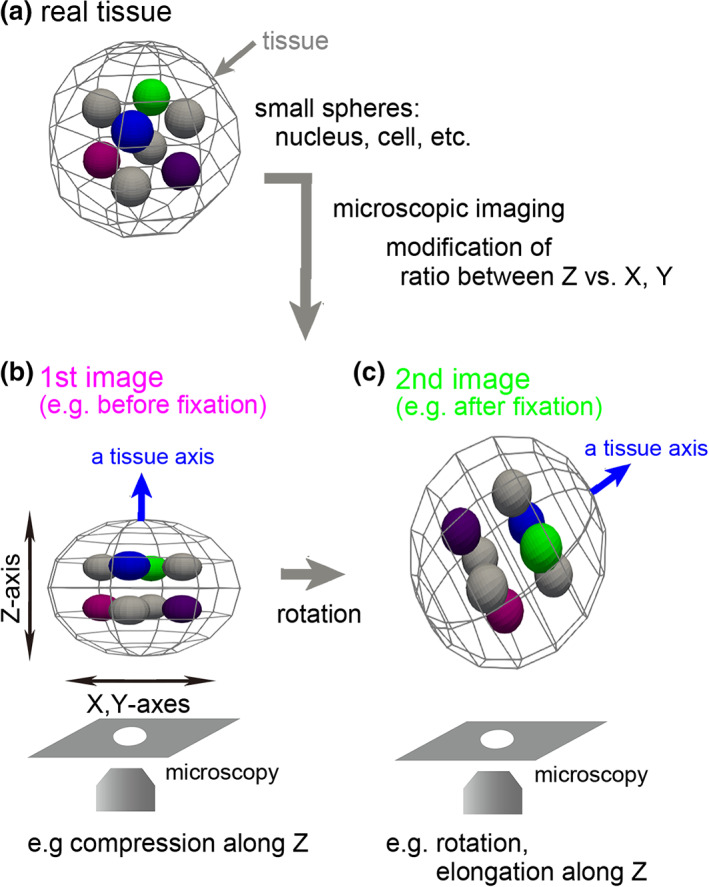
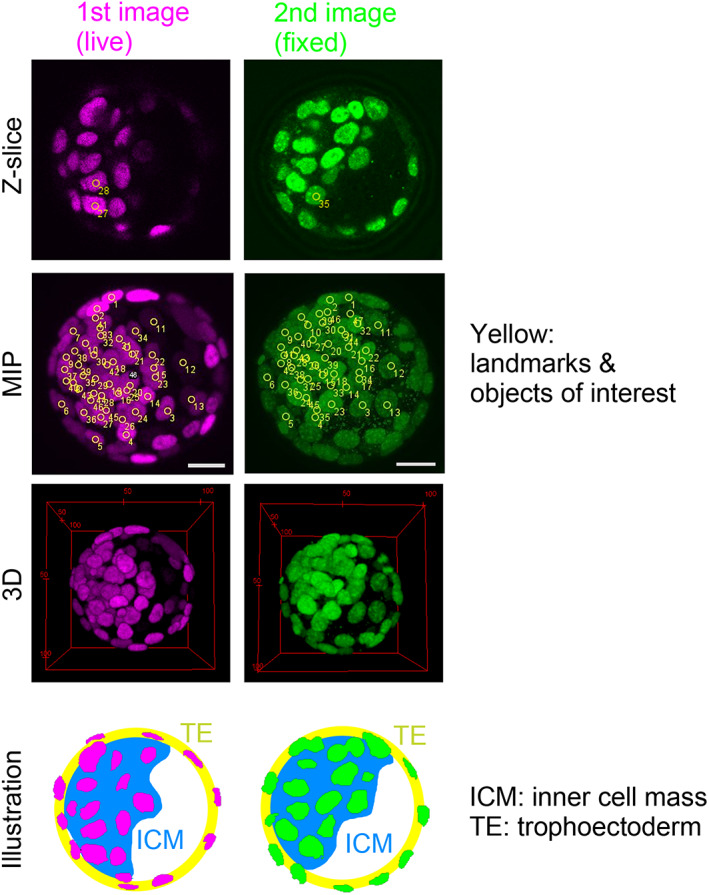
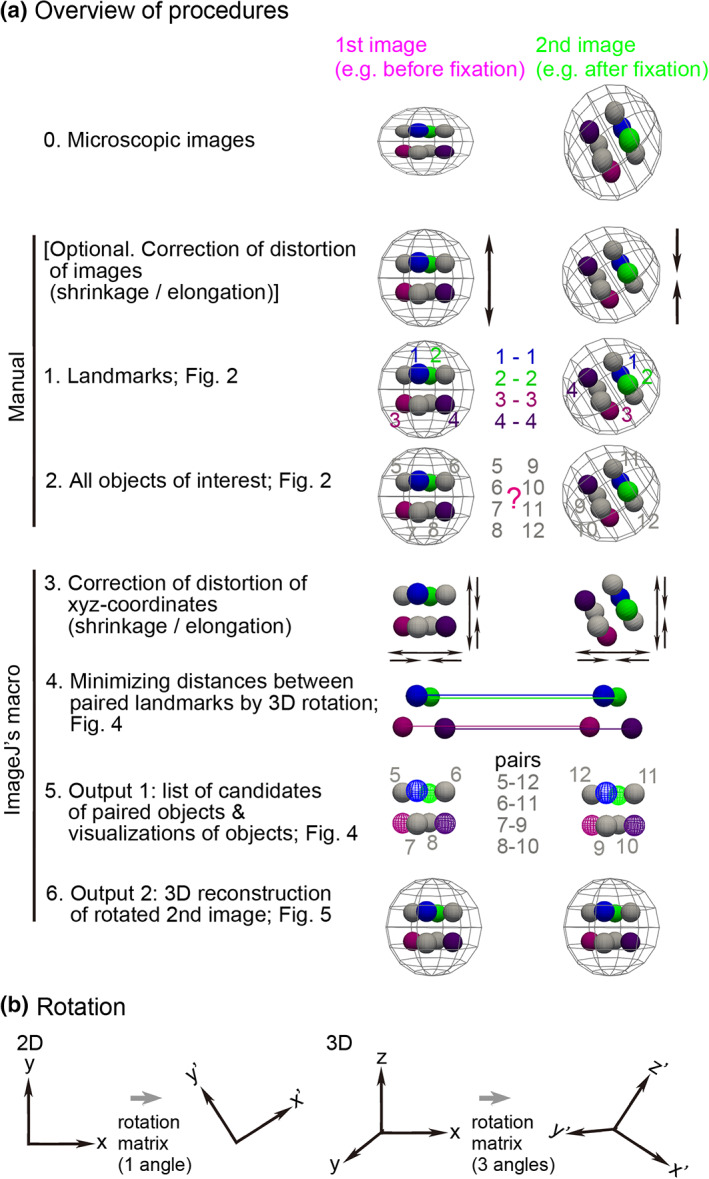
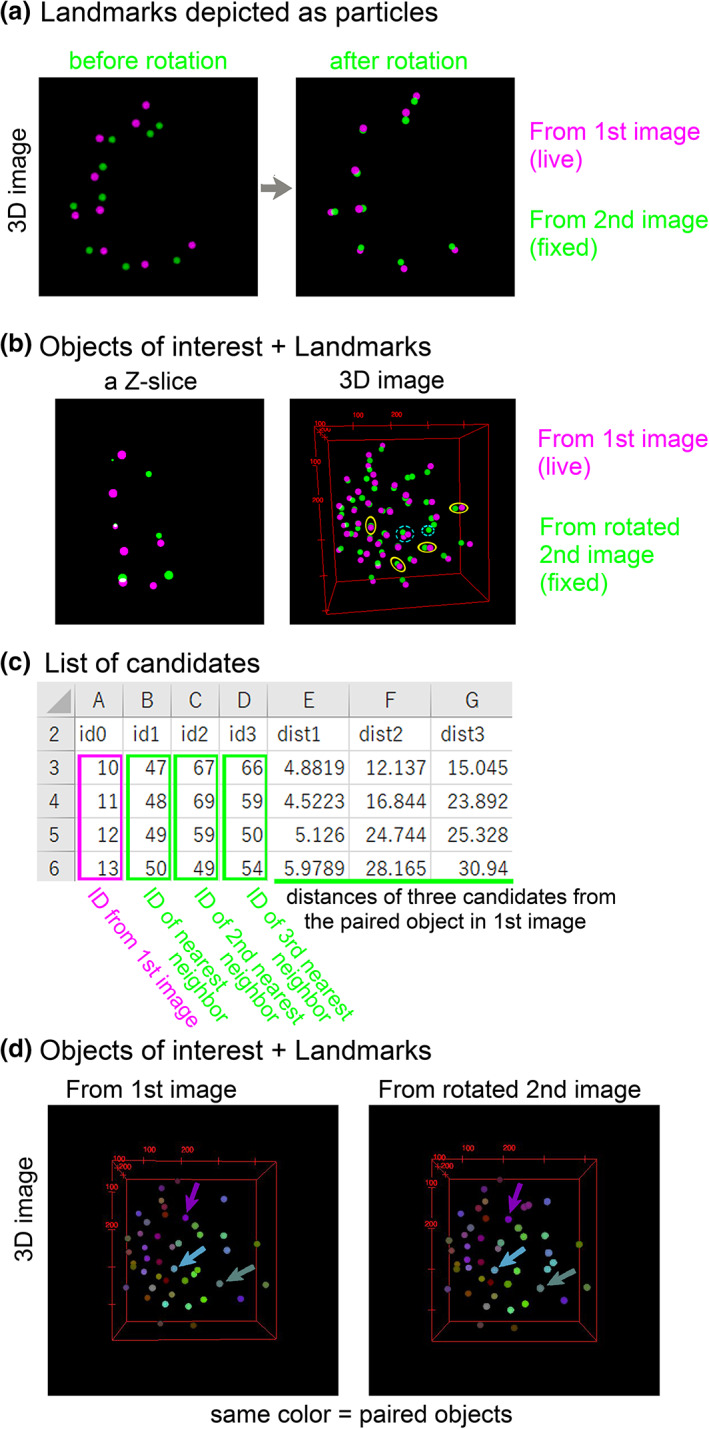
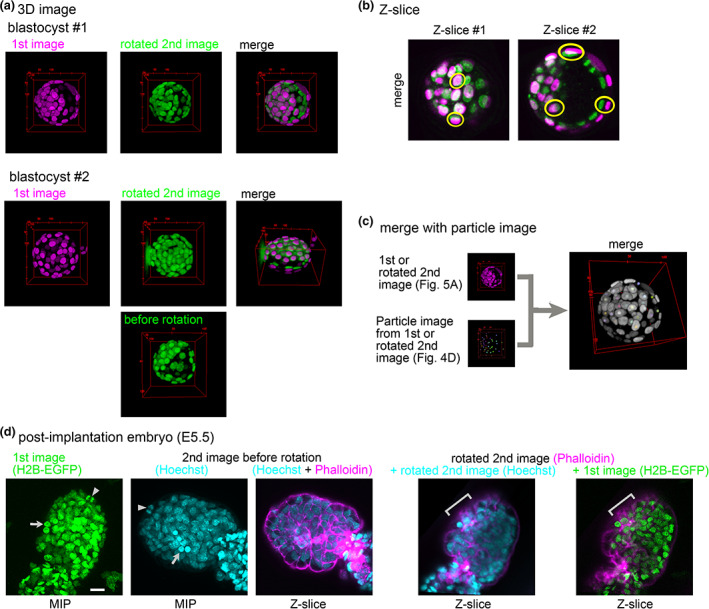
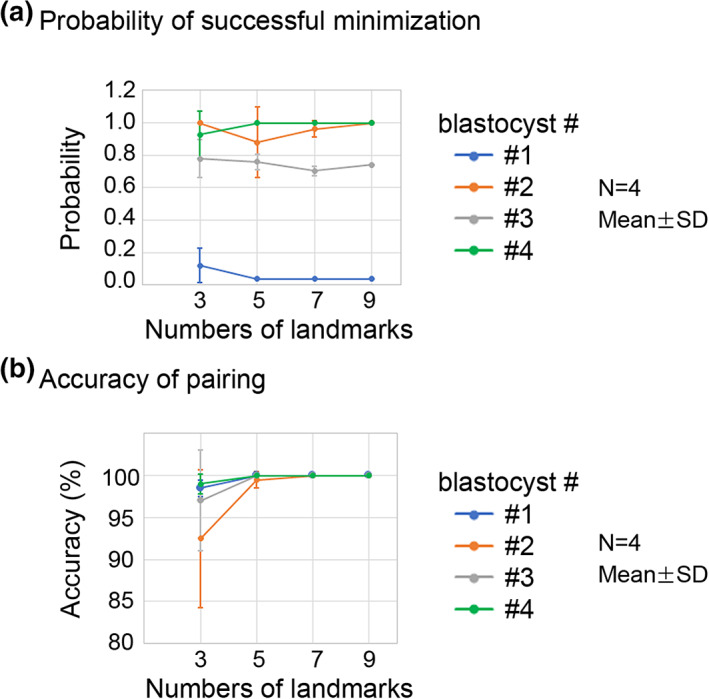
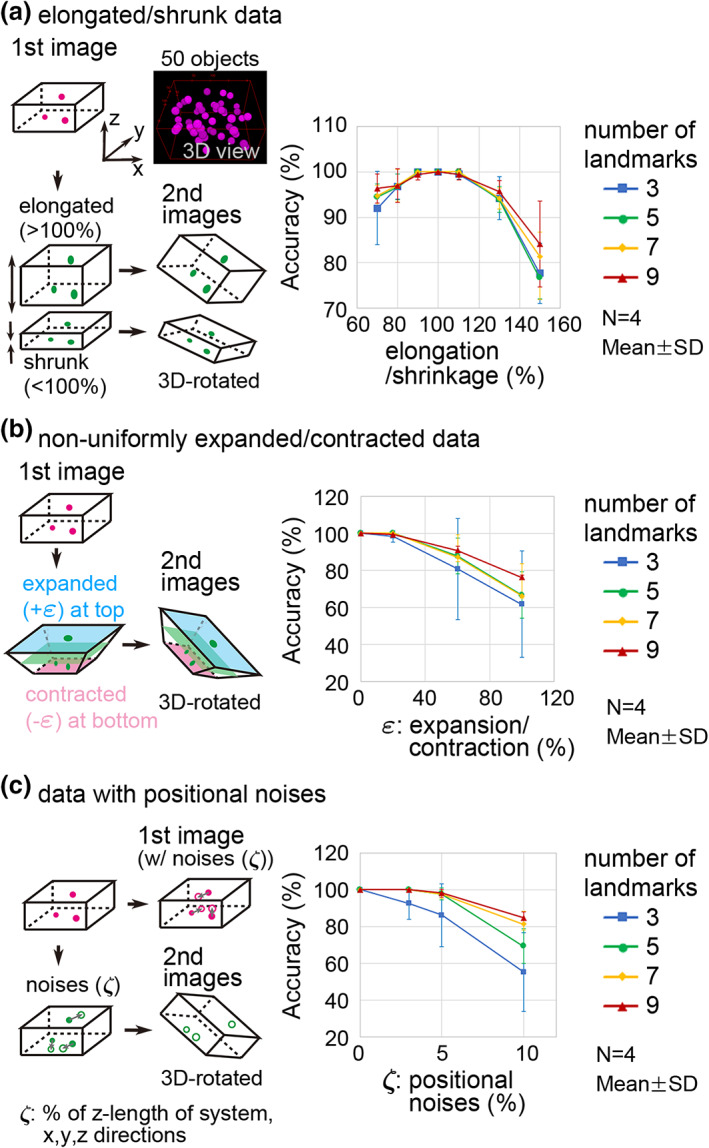
Three-dimensional (3D) registration (i.e., alignment) between two microscopic images is very helpful to study tissues that do not adhere to substrates, such as mouse embryos and organoids, which are often 3D rotated during imaging. However, there is no 3D registration tool easily accessible for experimental biologists. Here we developed an ImageJ-based tool which allows for 3D registration accompanied with both quantitative evaluation of the accuracy and reconstruction of 3D rotated images. In this tool, several landmarks are manually provided in two images to be aligned, and 3D rotation is computed so that the distances between the paired landmarks from the two images are minimized. By simultaneously providing multiple points (e.g., all nuclei in the regions of interest) other than the landmarks in the two images, the correspondence of each point between the two images, i.e., to which nucleus in one image a certain nucleus in another image corresponds, is quantitatively explored. Furthermore, 3D rotation is applied to one of the two images, resulting in reconstruction of 3D rotated images. We demonstrated that this tool successfully achieved 3D registration and reconstruction of images in mouse pre- and post-implantation embryos, where one image was obtained during live imaging and another image was obtained from fixed embryos after live imaging. This approach provides a versatile tool applicable for various tissues and species.

Keywords: ImageJ; image registration; mouse early embryo; three-dimensional image rotation.


Conflict of interest statement

The authors declare no competing financial interests.

Figures

FIGURE 1
FIGURE 1
Illustration of rotation and distortion of a specimen during preparation. (a) A tissue is illustrated with inner objects. In this case, the tissue and the inner objects are depicted as spheres. (b) An example of image acquisition of a tissue. The acquired image can be shrunk or elongated along the z‐axis. (c) A rotated tissue. During experimental procedures including fixation, the tissue may be rotated (“a tissue axis” between (b) and (c))
FIGURE 2
FIGURE 2
Rotated image of a mouse blastocyst. The first and second images are acquired from a live or fixed embryo. A z‐slice, maximum intensity projection (MIP), and three‐dimensional (3D) view of the images are shown. The regions of the inner cell mass (ICM) are illustrated for each image. The labeling of landmarks and objects is described in Appendix A. Scale bars = 20 μm
FIGURE 3
FIGURE 3
Procedures of three‐dimensional (3D) registration and reconstruction. (a) The procedures of our method are illustrated. At step 0, microscopic images are shown where the second image is rotated compared with the first image. At the “Optional” step, the shrinkage or elongation of the two images is corrected (arrows). At step 1, four landmarks are shown (#1–4). At step 2, objects of interest are labeled by non‐overlapped numbers between the two images (#5–8 vs. #9–12). At step 3, shrinkage or elongation of the xyz‐coordinates of the landmarks and the objects of interest is corrected. If shrinkage or elongation of the images has already been corrected at the “Optional” step, step 3 is not required. At step 4, the landmarks in the second image are optimally rotated. At step 5, the paired objects are identified (e.g., 5–12, 6–11). At step 6, the second image is rotated to be aligned with the first image, and the rotated image is reconstructed. (b) Definition of 3D rotation. In the case of two‐dimensional (2D) rotation, the rotation matrix contains one angle (θ in Appendix A). In the case of 3D rotation, the rotation matrix contains three angles (ϕ, θ, and ψ in Appendix A)
FIGURE 4
FIGURE 4
Registration of landmarks and objects of interest. (a) Landmarks in the first and second images are depicted as particles in three‐dimensional (3D) images. Images before and after the rotation of the second image are shown. The 3D images were generated by using Fiji > Plugins > 3D Viewer; all 3D images in this article were generated by the 3D Viewer. (b) Objects of interest in the first and second images are depicted as particles in 3D images. The landmarks are also depicted. Yellow circles, some examples of paired objects; light blue circles with dashed lines, a few examples of unsuccessfully paired objects. (c) Quantitative evaluation of pairing. For each object of interest in the first image, three objects as candidates for pairing are shown in the second image according to the distances between the objects. Four objects in the first image are shown. (d) Paired objects between the first and second image are depicted as particles in the same color. Arrows, three examples of paired objects. Landmarks are also depicted. The original images were 8‐bit images where the intensities of each particle correspond to the IDs of the objects, and the color was provided by setting lookup tables (ImageJ > Image > Lookup Tables > 3‐3‐2‐RGB)
FIGURE 5
FIGURE 5
Three‐dimensional (3D) reconstruction of a rotated image. (a) 3D images of the first and the rotated second image are shown for two blastocysts (#1 and #2). The second images before rotation are shown in Figure 2 for #1 or in the bottom panel for #2. Note that before the rotation, the intensities of the second images were normalized along the z‐axis (ImageJ > Process > Enhance Contrast… > Normalize), and thus, the intensities were not conserved. (b) Two z‐slices of the merged image of blastocyst #1 are shown. Yellow, examples of paired nuclei between the first and the rotated second image. (c) A merged image is shown where images of nuclei can be the first or the rotated second image, and particle images constructed in Figure 4 can be the first or the rotated second image. In other words, four (2 × 2) combinations of merged images can be generated. The merged image was generated by ImageJ > Image > Color > Merge Channels… (d) Embryos at 5.5 days after fertilization (E5.5). The first to third images are before 3D registration, and the fourth and fifth images are after 3D registration. Arrows and arrowheads; examples of landmarks. The number of landmarks = 7. Around the regions indicated by gray bars in the fourth and fifth images, the phalloidin signal was well detected. Scale bars = 20 μm
FIGURE 6
FIGURE 6
Performance and accuracy of 3D registration. (a) The performance of the minimization process was evaluated. The probability of successful minimization among 27 trials is shown for each blastocyst (#1–#4); probability = 1.0 means that the global minimum was successfully reached in all 27 trials. For number of landmarks = 9, N = 1. For number of landmarks = 3, 5, or 7, landmarks were randomly chosen from the nine landmarks, and four sets of different landmarks were generated; N = 4. (b) Accuracy of pairing of objects was evaluated for the outcomes of the successful minimization in (a). Similar to (a), the four blastocysts were tested with different numbers of landmarks for each blastocyst
FIGURE 7
FIGURE 7
Accuracy of three‐dimensional (3D) registration in artificially generated data. (a) The second images were generated through elongation/shrinkage along the z‐axis. In the first images, the objects and landmarks were randomly distributed in a space with x = 0–200, y = 0–150, z = 0–100. Four independent first images were generated (N = 4) with subsequent generation of second images. The accuracy was calculated in a similar manner to Figure 6(b). (b) The second images were generated through non‐uniform expansion/contraction of xy‐planes in a manner dependent on the z‐position. The first images were identical to those in (a). The top xy‐plane was expanded (light blue); the bottom xy‐plane was contracted (magenta); the exact mid of the xy‐plane was not deformed (light green). (c) The second images were generated through addition of positional noise for each object and landmark. Similarly, positional noise was also added to the first images, which was different from the noise for the second images. The positional noise was randomly provided with uniform distributions (from –ξ to +ξ) along the three directions (x, y, z), and their magnitudes (ξ) are shown as relative values to the z‐length of the system (i.e., z = 0–100)

Similar articles

References

    1. Azuma, Y. , & Onami, S. (2017). Biologically constrained optimization based cell membrane segmentation in C. elegans embryos. BMC Bioinformatics, 18, 307. - PMC - PubMed
    1. Bao, Z. , Murray, J. I. , Boyle, T. , Ooi, S. L. , Sandel, M. J. , & Waterston, R. H. (2006). Automated cell lineage tracing in Caenorhabditis elegans . Proceedings of the National Academy of Sciences of the United States of America, 103, 2707–2712. - PMC - PubMed
    1. Fernandez, R. , & Moisy, C. (2021). Fijiyama: A registration tool for 3D multimodal time‐lapse imaging. Bioinformatics, 37, 1482–1484. - PubMed
    1. Heller, D. , Hoppe, A. , Restrepo, S. , Gatti, L. , Tournier, A. L. , Tapon, N. , Basler, K. , & Mao, Y. (2016). EpiTools: An open‐source image analysis toolkit for quantifying epithelial growth dynamics. Developmental Cell, 36, 103–116. - PMC - PubMed
    1. Koyama, H. , Okumura, H. , Ito, A. M. , Otani, T. , Nakamura, K. , Kato, K. , & Fujimori, T. (2022). Effective mechanical potential of cell–cell interaction explains basic structures of three‐dimensional morphogenesis. BioRxiv. 10.1101/812198 - DOI - PMC - PubMed