. 2023 Mar 1;13(3):766-795.
doi: 10.1158/2159-8290.CD-22-1230.

A Ubiquitination Cascade Regulating the Integrated Stress Response and Survival in Carcinomas

Affiliations

A Ubiquitination Cascade Regulating the Integrated Stress Response and Survival in Carcinomas

Lisa D Cervia et al. Cancer Discov. .

Abstract

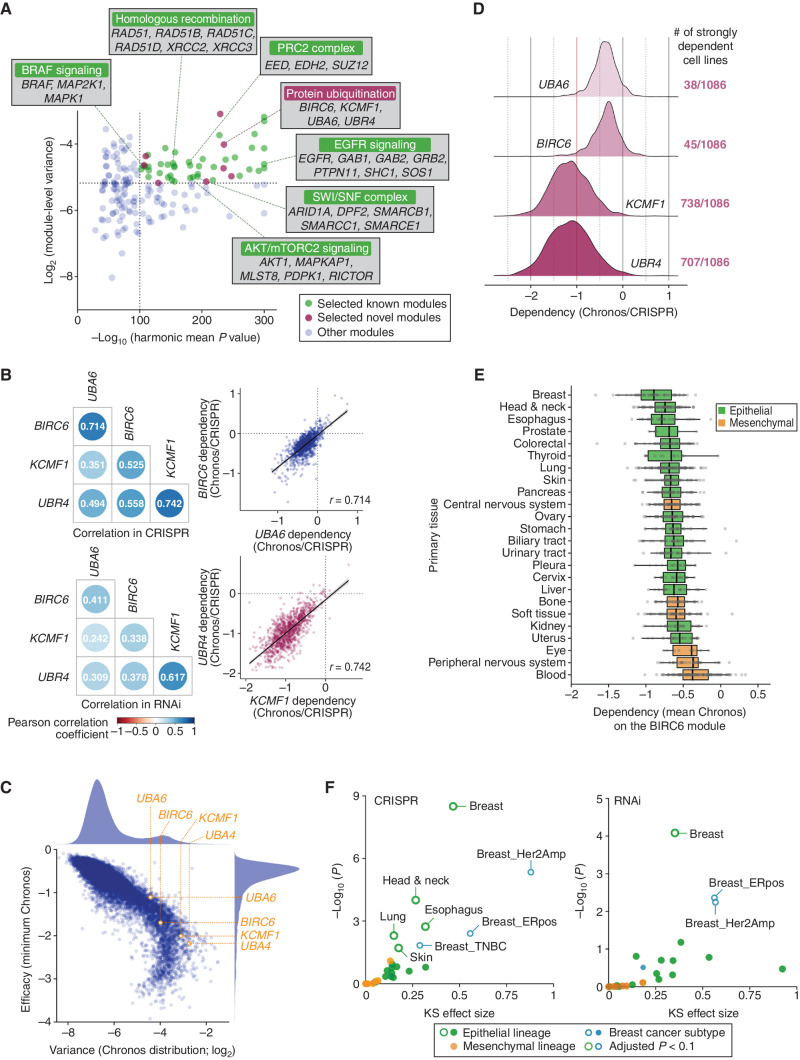
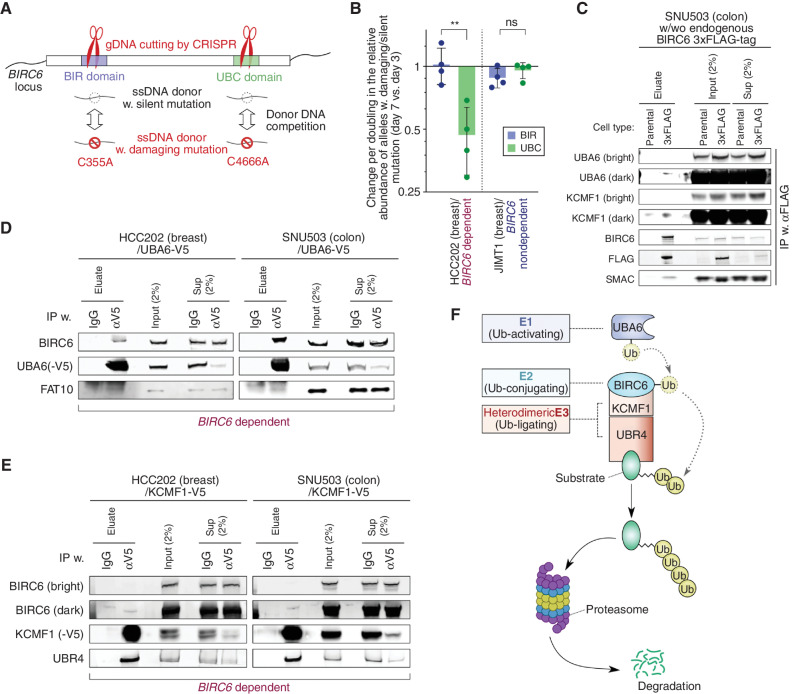
Systematic identification of signaling pathways required for the fitness of cancer cells will facilitate the development of new cancer therapies. We used gene essentiality measurements in 1,086 cancer cell lines to identify selective coessentiality modules and found that a ubiquitin ligase complex composed of UBA6, BIRC6, KCMF1, and UBR4 is required for the survival of a subset of epithelial tumors that exhibit a high degree of aneuploidy. Suppressing BIRC6 in cell lines that are dependent on this complex led to a substantial reduction in cell fitness in vitro and potent tumor regression in vivo. Mechanistically, BIRC6 suppression resulted in selective activation of the integrated stress response (ISR) by stabilization of the heme-regulated inhibitor, a direct ubiquitination target of the UBA6/BIRC6/KCMF1/UBR4 complex. These observations uncover a novel ubiquitination cascade that regulates ISR and highlight the potential of ISR activation as a new therapeutic strategy.

Significance: We describe the identification of a heretofore unrecognized ubiquitin ligase complex that prevents the aberrant activation of the ISR in a subset of cancer cells. This provides a novel insight on the regulation of ISR and exposes a therapeutic opportunity to selectively eliminate these cancer cells. See related commentary Leli and Koumenis, p. 535. This article is highlighted in the In This Issue feature, p. 517.


Figures

Figure 1. Cell type-specific role of the UBA6/BIRC6/KCMF1/UBR4 module revealed by the coessentiality analysis. A, Based on the significance of correlation and the variance of essentiality, we selected 50 top coessential gene modules, which included 42 modules for which the functional interactions of the constituent genes have already been reported (green dots) and eight modules that contain previously unassociated gene pair(s) (pink dots). B, Correlation of the essentiality of the four genes that comprise the BIRC6 module (UBA6, BIRC6, KCMF1 and UBR4). The Pearson correlation coefficients between the dependency profiles of the indicated gene pairs in both CRISPR (top) and RNAi (bottom) datasets (left) are shown. The correlations between UBA6 and BIRC6 (r = 0.714) as well as KCMF1 and UBR4 (r = 0.742) in the CRISPR dataset are also shown individually in the scatter plots (right). C, All these genes exhibited dependency profiles with both high variance (> 89th percentile among all genes) and strong efficacy (> 83rd percentile of all genes), the latter being defined by the minimum dependency score (Chronos) across all cell lines. D, The dependency profiles of the four genes constituting the BIRC6 module. UBA6 and BIRC6 were strongly essential (> 90% probability of dependency) in a small subset of cell lines, while KCMF1 and UBR4 were strongly essential in the majority (> 65%) of cell line models. E, Dependency on the BIRC6 module per tissue type. The mean Chronos (mChronos) scores of the four genes comprising the BIRC6 module were plotted per tissue type. The dependency on this module is enriched in epithelial tissue–derived cancer cells. F, Significance of the lineage/subtype enrichment of the BIRC6 module gene dependencies in the CRISPR and RNAi screens. The distribution of mChronos or mean DEMETER2 scores in the individual lineages/subtypes was compared with the corresponding distribution in all the other cell lines within the dataset. The effect size and significance, determined by the two-sample Kolmogorov–Smirnov test, were plotted.
Figure 1.
Cell type–specific role of the UBA6/BIRC6/KCMF1/UBR4 module revealed by the coessentiality analysis. A, Based on the significance of correlation and the variance of essentiality, we selected 50 top coessential gene modules, which included 42 modules for which the functional interactions of the constituent genes have already been reported (green dots) and eight modules that contain previously unassociated gene pair(s) (pink dots). B, Correlation of the essentiality of the four genes that comprise the BIRC6 module (UBA6, BIRC6, KCMF1, and UBR4). The Pearson correlation coefficients between the dependency profiles of the indicated gene pairs in both CRISPR (top) and RNAi (bottom) datasets (left) are shown. The correlations between UBA6 and BIRC6 (r = 0.714) as well as KCMF1 and UBR4 (r = 0.742) in the CRISPR dataset are also shown individually in the scatter plots (right). C, All these genes exhibited dependency profiles with both high variance (>89th percentile among all genes) and strong efficacy (>83rd percentile of all genes), the latter being defined by the minimum dependency score (Chronos) across all cell lines. D, The dependency profiles of the four genes constituting the BIRC6 module. UBA6 and BIRC6 were strongly essential (>90% probability of dependency) in a small subset of cell lines, while KCMF1 and UBR4 were strongly essential in the majority (>65%) of cell line models. E, Dependency on the BIRC6 module per tissue type. The mean Chronos (mChronos) scores of the four genes comprising the BIRC6 module were plotted per tissue type. The dependency on this module is enriched in epithelial tissue–derived cancer cells. F, Significance of the lineage/subtype enrichment of the BIRC6 module gene dependencies in the CRISPR and RNAi screens. The distribution of mChronos or mean DEMETER2 scores in the individual lineages/subtypes was compared with the corresponding distribution in all the other cell lines within the dataset. The effect size and significance, determined by the two-sample Kolmogorov–Smirnov test (KS), were plotted. ERpos, estrogen receptor positive; Her2Amp, Her2 amplified; TNBC, triple-negative breast cancer.
Figure 2. Validation of BIRC6 dependency in vitro and in vivo. A, Consequences of CRISPR-mediated BIRC6 knockout on cell viability. Five putatively dependent cells and six putatively nondependent cells [as defined by Chronos score (see Methods)], all of which constitutively express Cas9, were analyzed using an ATP-based assay seven days after transducing a sgRNA against BIRC6 (three different sgRNA sequences were tested). Viability scores relative to the average viability of cells transduced with cutting control sgRNAs and the average viability of cells with knockout of common essential genes are shown. Values = means ± SD (n = 9). ****, P < 0.0001 (dependent vs. nondependent; for each guide). B, Consequences of CRISPRi-mediated BIRC6 knockdown on long-term cell fitness. Clonogenic growth of the cells was evaluated 14 days after the transduction of an all-in-one CRISPRi construct targeting the indicated gene. Two sgRNA sequences against BIRC6 were tested. Presented are the representative images of cells with crystal-violet staining (left) and the mean staining intensities per sample (n = 3, right). *, P < 0.05; ****, P < 0.0001 (sgCiCh2–2 vs. sgCiBIRC6). C and D, Cell cycle (C) and cell death (D) analysis following BIRC6 knockout. Cas9-expressing derivatives of indicated cells were transduced with a cutting control sgRNA (sgCh2–2) or an sgRNA targeting BIRC6 (sgBIRC6–1, sgBIRC6–4). Cells were harvested four (C) or seven days (D) later, stained and analyzed by flow cytometry. In C, the proportion of cells in the S phase was reduced upon BIRC6 knockout in the three dependent models, but not in the three nondependent models. In D, the proportion of dead cells (Late Apoptosis + Nonapoptotic Death + Early Apoptosis) was increased following the knockout of BIRC6 in all of the three dependent cell lines, but only in one of the three nondependent cell lines. Ns, P ≥ 0.05; *, P < 0.05; **, P < 0.01; ***, P < 0.001; ****, P < 0.0001 (n = 3). E–G, In vivo validation of the BIRC6 dependency. In E, ZR751 breast cancer cells expressing a doxycycline (DOX)-inducible shRNA against BIRC6 (shBIRC6–2) were implanted into the mammary fat pads of NRG (NOD-Rag1−/− IL12rg−/−) mice. Following tumor formation, some of these mice were treated with doxycycline, while others were left untreated. In F and G, KYSE450 esophagus cancer cells (F) and HCC95 lung cancer cells (G), both of which were engineered to express an sgRNA against BIRC6 in a tamoxifen (TAM)-inducible fashion, were implanted subcutaneously into the NSG (NOD-scid Il2rg−/−) mice. Following tumor formation, some mice were injected with TAM, while others were treated with a vehicle control. In both cases, the tumor growth is plotted to compare the two different groups of mice. Data are represented as means ± SEM [n = 8 (Keep w/o TAM group, G), 9 (Keep w/o TAM and TAM(-) groups, F; TAM hereafter group, G), 10 (Keep w/o DOX and DOX(-) groups, E; TAM hereafter and TAM (+) groups, F; TAM(-) and TAM(+) groups, G), 12 (DOX hereafter and DOX (+) groups, E)]. ns, P ≥ 0.05; **, P < 0.01; ***, P < 0.001; ****, P < 0.0001 (for each of the last five time points for the tumor growth curves). All the experiments were performed twice, except for E—G, which were conducted once.
Figure 2.
Validation of BIRC6 dependency in vitro and in vivo.A, Consequences of CRISPR-mediated BIRC6 knockout on cell viability. Five putatively dependent cells and six putatively nondependent cells [as defined by Chronos score (see Methods)], all of which constitutively express Cas9, were analyzed using an ATP-based assay 7 days after transducing an sgRNA against BIRC6 (three different sgRNA sequences were tested). Viability scores relative to the average viability of cells transduced with cutting control sgRNAs and the average viability of cells with knockout (KO) of common essential genes are shown. Values = means ± SD (n = 9). ****, P < 0.0001 (dependent vs. nondependent; for each guide). B, Consequences of CRISPR interference (CRISPRi)–mediated BIRC6 knockdown on long-term cell fitness. Clonogenic growth of the cells was evaluated 14 days after the transduction of an all-in-one CRISPRi construct targeting the indicated gene. Two sgRNA sequences against BIRC6 were tested. Presented are the representative images of cells with crystal violet staining (left) and the mean staining intensities per sample (n = 3, right). *, P < 0.05; ****, P < 0.0001 (sgCiCh2-2 vs. sgCiBIRC6). C and D, Cell cycle (C) and cell death (D) analysis following BIRC6 knockout. Cas9-expressing derivatives of indicated cells were transduced with a cutting control sgRNA (sgCh2-2) or an sgRNA targeting BIRC6 (sgBIRC6-1, sgBIRC6-4). Cells were harvested 4 (C) or 7 (D) days later, stained, and analyzed by flow cytometry. In C, the proportion of cells in the S-phase was reduced upon BIRC6 knockout in the three dependent models, but not in the three nondependent models. In D, the proportion of dead cells (late apoptosis + nonapoptotic death + early apoptosis) was increased following the knockout of BIRC6 in all of the three dependent cell lines, but only one of the three nondependent cell lines. ns, P ≥ 0.05; *, P < 0.05; **, P < 0.01; ***, P < 0.001; ****, P < 0.0001 (n = 3). E–G,In vivo validation of the BIRC6 dependency. In E, ZR751 breast cancer cells expressing a doxycycline (DOX)-inducible shRNA against BIRC6 (shBIRC6–2) were implanted into the mammary fat pads of NRG mice. Following tumor formation, some of these mice were treated with DOX, while others were left untreated. In F and G, KYSE450 esophagus cancer cells (F) and HCC95 lung cancer cells (G), both of which were engineered to express an sgRNA against BIRC6 in a tamoxifen (TAM)-inducible fashion, were implanted subcutaneously via intraperitoneal injection (IP) into the NSG (NOD-scid Il2rg−/−) mice. Following tumor formation, some mice were injected with TAM, while others were treated with vehicle control. In both cases, the tumor growth is plotted to compare the two different groups of mice. Data are represented as means ± SEM [n = 8 (Keep w/o TAM group, G), 9 (Keep w/o TAM and TAM(-) groups, F; TAM hereafter group, G), 10 (Keep w/o DOX and DOX(-) groups, E; TAM hereafter and TAM (+) groups, F; TAM(-) and TAM(+) groups, G), 12 (DOX hereafter and DOX (+) groups, E)]. ns, P ≥ 0.05; ****, P < 0.0001 (for each of the last five time points for the tumor growth curves). All the experiments were performed twice except for A, which was conducted three times, and EG, which were conducted once.
Figure 3. Biochemical demonstration of the BIRC6 complex assembly. A, Competition assay to evaluate the essentiality of each of the two functional domains of BIRC6 using a strategy to repair a CRISPR-mediated cleavage of the genomic locus corresponding to each of these domains (BIR and UBC) via homologous recombination. We show the two different donor DNAs that were introduced, one harboring a damaging mutation and the other containing a silent mutation. This assay scores the relative abundance of alleles with damaging versus silent mutations. B, Relative abundance of the damaging versus silent mutations in each of the two functional domains of BIRC6. Plotted are the change in the ratio of damaging over silent mutations at day seven after the transduction of the Cas9/crRNA ribonucleoprotein complex relative to the corresponding ratio at day three, normalized against the doubling time of the cells. Values = means ± SD (n = 4). ns, P ≥ 0.05; **, P < 0.01. C–E, Protein–protein interactions between the components of the BIRC6 module. In C, endogenously expressed BIRC6 was immunoprecipitated from the lysate of SNU503 cells that were engineered to have the 3xFLAG-tag-encoding sequence inserted at the N-terminus of BIRC6-encoding sequence. In D and E, exogenously-expressed, V5-tagged UBA6 (D) and V5-tagged KCMF1 (E) were immunoprecipitated from the lysates of HCC202 and SNU503 cells. In all these cases, eluate, crude (input) and cleared (sup) lysates were analyzed by immunoblotting. F, The BIRC6 module is composed of an E1 enzyme (UBA6), an E2 enzyme (BIRC6), and two E3 enzymes that have been shown to work cooperatively (KCMF1 and UBR4). All the experiments were performed twice, except for B, which shows the summary of four independent experiments.
Figure 3.
Biochemical demonstration of the BIRC6 complex assembly. A, Competition assay to evaluate the essentiality of each of the two functional domains of BIRC6 using a strategy to repair a CRISPR-mediated cleavage of the genomic locus corresponding to each of these domains (BIR and UBC) via homologous recombination. We show the two different donor DNAs that were introduced: one harboring a damaging mutation and the other containing a silent mutation. This assay scores the relative abundance of alleles with damaging versus silent mutations. ssDNA, single-strand DNA. B, Relative abundance of the damaging versus silent mutations in each of the two functional domains of BIRC6. Plotted is the change in the ratio of damaging over silent mutations at day 7 after the transduction of the Cas9/crRNA ribonucleoprotein complex relative to the corresponding ratio at day 3, normalized against the doubling time of the cells. Values = means ± SD (n = 4). ns, P ≥ 0.05; **, P < 0.01. C–E, Protein–protein interactions between the components of the BIRC6 module. In C, endogenously expressed BIRC6 was immunoprecipitated (IP) from the lysate of SNU503 cells that were engineered to have the 3xFLAG tag–encoding sequence inserted at the N-terminus of the BIRC6-encoding sequence. In D and E, exogenously expressed, V5-tagged UBA6 (D) and V5-tagged KCMF1 (E) were immunoprecipitated from the lysates of HCC202 and SNU503 cells. In all these cases, eluates, crude (input) lysates, and cleared (sup) lysates were analyzed by immunoblotting. F, The BIRC6 module is composed of an E1 enzyme (UBA6), an E2 enzyme (BIRC6), and two E3 enzymes that have been shown to work cooperatively (KCMF1 and UBR4). All the experiments were performed twice except for B, which shows the summary of four independent experiments.
Figure 4. Selective activation of the integrated stress response (ISR) following BIRC6 depletion. A, Effects of BIRC6 depletion on gene expression. RNA samples were harvested 4 days after the transduction of either a control sgRNA (sgCh2–2) or an sgRNA targeting BIRC6 (sgBIRC6). The gene-level expression change [LFC (sgBIRC6/sgCh2–2)] and the significance of the observed change [−log10 (P)] were plotted separately for the three dependent models and the three nondependent models. Green dots represent significant changes (adjusted P value < 0.01). B, Gene-set enrichment analysis for the differentially expressed genes. The positions of the circles indicate the enrichment score for the individual hallmark gene sets, while the sizes of the circles reflect the significance of enrichment. These analyses were performed in HCC202 breast cancer cells and SNU503 colon cancer cells. C, Activation of p-eIF2ɑ/ATF4 signaling following BIRC6 depletion in the dependent cell lines. The Cas9-expressing derivatives of the indicated cells were transduced with the indicated sgRNA and their lysates were harvested 4 and 7 days later. The cell lysates were treated with arsenite (300 μmol/L, 3 hours), thapsigargin (1 μmol/L, 6 hours), or a vehicle control (DMSO). These lysates were subjected to immunoblotting for markers of the ISR, including p-eIF2S1, ATF4, and ATF3. Values represent the intensity of the p-eIF2α band relative to that of corresponding t-eIF2α band. D, Differential expression of the target genes for three different signaling arms of the UPR response, PERK-p-eIF2ɑ/ATF4 pathway, ATF6 pathway, and IRE1/XBP1 pathway. The log fold changes (LFC) in the expression levels of the individual transcriptional targets of these three signaling arms, observed in the RNA-seq experiment shown in A, are indicated. ns, P ≥ 0.05; ***, P < 0.001; ****, P < 0.0001 (dependent vs. nondependent; LFCs of the target genes that are specific only to the PERK-p-eIF2ɑ/ATF4, ATF6, or IRE1/XBP1 pathway were compared between these two groups of cell lines). E, Schematic of ISR. The four members of the EIF2AK family kinases (GCN2, PKR, HRI, and PERK) are activated by discrete types of stress stimuli. However, their activation converges on the phosphorylation of eIF2ɑ, resulting in the global shutdown of protein synthesis and selective induction of a subset of proteins including ATF4. The RNA sequencing experiment (A, B, D) was conducted once, while the experiment shown in C was conducted twice.
Figure 4.
Selective activation of the ISR following BIRC6 depletion. A, Effects of BIRC6 depletion on gene expression. RNA samples were harvested 4 days after the transduction of either a control sgRNA (sgCh2-2) or an sgRNA targeting BIRC6 (sgBIRC6). The gene-level expression change [log-fold changes, or LogFC (sgBIRC6/sgCh2-2)] and the significance of the observed change [−log10 (P)] were plotted separately for the three dependent models and the three nondependent models. Green dots represent significant changes (adjusted P value < 0.01). B, Gene set enrichment analysis for the differentially expressed genes. The positions of the circles indicate the enrichment score for the individual hallmark gene sets, while the sizes of the circles reflect the significance of enrichment. These analyses were performed in HCC202 breast cancer cells and SNU503 colon cancer cells. C, Activation of p-eIF2a/ATF4 signaling following BIRC6 depletion in the dependent cell lines. The Cas9-expressing derivatives of the indicated cells were transduced with the indicated sgRNA, and their lysates were harvested 4 and 7 days later. The cell lysates were treated with arsenite (300 μmol/L, 3 hours), thapsigargin (1 μmol/L, 6 hours), or a vehicle control (DMSO). These lysates were subjected to immunoblotting for markers of the ISR, including p-eIF2S1, ATF4, and ATF3. Values represent the intensity of the p-eIF2α band relative to that of corresponding t-eIF2α band. D, Differential expression of the target genes for three different signaling arms of the UPR response, PERK–p-eIF2a/ATF4 pathway, ATF6 pathway, and IRE1/XBP1 pathway. The LogFCs in the expression levels of the individual transcriptional targets of these three signaling arms, observed in the RNA sequencing experiment shown in A, are indicated. ns, P ≥ 0.05; ***, P < 0.001; ****, P < 0.0001 (dependent vs. nondependent; LogFCs of the target genes that are specific only to the PERK–p-eIF2a/ATF4, ATF6, or IRE1/XBP1 pathway were compared between these two groups of cell lines). E, Schematic of the ISR. The four members of the EIF2AK family of kinases (GCN2, PKR, HRI, and PERK) are activated by discrete types of stress stimuli. However, their activation converges on the phosphorylation of eIF2a, resulting in the global shutdown of protein synthesis and selective induction of a subset of proteins including ATF4. The RNA sequencing experiment (A, B, D) was conducted once, while the experiment shown in C was conducted twice.
Figure 5. HRI is a critical mediator of ISR induced by the inactivation of the BIRC6 complex. A and B, Blockade of BIRC6-depletion-induced ISR activation and loss of viability by ISRIB, an ISR inhibitor. HCC202-Cas9 and SNU503-Cas9 cells were transduced with the indicated sgRNA and maintained in either vehicle- or ISRIB-containing medium. In A, lysates were harvested four days later and subjected to immunoblotting. In B, cell viability was scored with an ATP-based viability assay seven days later. Positive controls include sgRNAs targeting two common essential genes (POLR2D, SF3B1). ns, P ≥ 0.05; *, P < 0.05; **, P < 0.01; ****, P < 0.0001 (vs. corresponding ISRIB [-] sample). C, Schematic of the genome-scale screen to identify enhancers and suppressors of BIRC6 dependency. HCC202-Cas9 and SNU503-Cas9 cells were engineered to express an shRNA targeting BIRC6 in a doxycycline (DOX)-inducible manner. These cells were subsequently transduced with a genome-scale sgRNA library (Brunello) and subjected to doxycycline treatment starting seven days after the library transduction. Cells were harvested after seven days of doxycycline treatment and the relative abundance of individual sgRNAs in the genome of these cells was analyzed. D and E, Identification of genes whose knockout rescue or enhance the viability effect of BIRC6 knockdown. The significance of the change in sgRNA abundance between the genomic DNA (gDNA) of DOX-treated cells and the plasmid DNA (pDNA) of the library was scored using the hypergeometric distribution method and aggregated to the gene level and plotted together with the average log fold change [LFC (post-DOX sgDNA/pDNA)] of the sgRNAs against the respective gene. HRI was among the strongest hits in both cell lines screened (HCC202 and SNU503; D). Correlation of the screen results between the two dependent cell lines is also plotted (E). The four genes that comprise the EIF2AK family of kinases are indicated by orange dots, while the genes with statistically significant (adjusted P value < 0.01) depletion/enrichment of corresponding sgRNAs were indicated by the green dots (In E, only genes with significant depletion/enrichment in both cells lines were indicated by the green dots). F, Blockade of BIRC6 depletion–induced ISR activation by the concomitant knockout of HRI. HCC202-Cas9 and SNU503-Cas9 cells were engineered to express either an sgRNA against HRI or PERK or a control sgRNA (sgCh2–2). These cells were subsequently transduced with a control sgRNA (sgAAVS1) or an sgRNA targeting BIRC6 and 4 days later, their lysates were harvested and analyzed. G, Rescue of the viability effect of BIRC6 knockout by the concomitant knockout of HRI. The cells expressing sgCh2–2, sgHRI or sgPERK, used in F, were transduced with sgAAVS1 (negative control gene), an sgRNA against positive control genes, or an sgRNA against BIRC6, and their viability was scored seven days later. ns, P ≥ 0.05; *, P < 0.05; **, P < 0.01; ****, P < 0.0001 (vs. corresponding sgCh2–2 sample). In A and F, values represent the intensity of the p-eIF2α band relative to that of the corresponding t-eIF2α band. In B and G, values = means ± SD [n = 3 (sgCh2–2 (B), sgAAVS1 (G)), 6 (positive ctrl, sgBIRC6)]. All the experiments were performed twice, except for the genome-scale modifier screen (D and E), which was conducted once.
Figure 5.
HRI is a critical mediator of ISR induced by the inactivation of the BIRC6 complex. A and B, Blockade of BIRC6 depletion–induced ISR activation and loss of viability by ISRIB, an ISR inhibitor. HCC202-Cas9 and SNU503-Cas9 cells were transduced with the indicated sgRNA and maintained in either vehicle- or ISRIB-containing medium. In A, lysates were harvested 4 days later and subjected to immunoblotting. In B, cell viability was scored with an ATP-based viability assay 7 days later. Positive controls include sgRNAs targeting two common essential genes (POLR2D, SF3B1). ns, P ≥ 0.05; *, P < 0.05; **, P < 0.01; ****, P < 0.0001 (vs. corresponding ISRIB [-] sample). C, Schematic of the genome-scale screen to identify enhancers and suppressors of BIRC6 dependency. HCC202-Cas9 and SNU503-Cas9 cells were engineered to express a shRNA targeting BIRC6 in a doxycycline (DOX)-inducible manner. These cells were subsequently transduced with a genome-scale sgRNA library (Brunello) and subjected to DOX treatment 7 days after the library transduction. Cells were harvested after 7 days of DOX treatment and the relative abundance of individual sgRNAs in the genome of these cells was analyzed. D and E, Identification of genes whose knockout rescue or enhance the viability effect of BIRC6 knockdown. The significance of the change in sgRNA abundance between the genomic DNA (gDNA) of DOX-treated cells and the plasmid DNA (pDNA) of the library was scored using the hypergeometric distribution method and aggregated to the gene level and plotted together with the average LogFC (post-DOX sgDNA/pDNA) of the sgRNAs against the respective gene. HRI was among the strongest hits in both cell lines screened (HCC202 and SNU503; D). Correlation of the screen results between the two dependent cell lines is also plotted (E). The four genes that comprise the EIF2AK family of kinases are indicated by orange dots, while the genes with statistically significant (adjusted P value < 0.01) depletion/enrichment of corresponding sgRNAs are indicated by the green dots (in E, only genes with significant depletion/enrichment in both cells lines are indicated by the green dots). F, Blockade of BIRC6 depletion–induced ISR activation by the concomitant knockout of HRI. HCC202-Cas9 and SNU503-Cas9 cells were engineered to express either an sgRNA against HRI or PERK or a control sgRNA (sgCh2-2). These cells were subsequently transduced with a control sgRNA (sgAAVS1) or an sgRNA targeting BIRC6, and 4 days later, their lysates were harvested and analyzed. G, Rescue of the viability effect of BIRC6 knockout by the concomitant knockout of HRI. The cells expressing sgCh2-2, sgHRI, or sgPERK, used in F, were transduced with sgAAVS1 (negative control gene), an sgRNA against positive control genes, or an sgRNA against BIRC6, and their viability was scored 7 days later. ns, P ≥ 0.05; *, P < 0.05; **, P < 0.01; ****, P < 0.0001 (vs. corresponding sgCh2-2 sample). In A and F, values represent the intensity of the p-eIF2α band relative to that of the corresponding t-eIF2α band. In B and G, values = means ± SD [n = 3 (sgCh2-2 (B), sgAAVS1 (G)), 6 (positive ctrl, sgBIRC6)]. All the experiments were performed twice except for the genome-scale modifier screen (D and E), which was conducted once.
Figure 6. Ubiquitination and stability of HRI are governed by the BIRC6 complex. A, Proteomic changes following BIRC6 depletion in the presence and absence of ISRIB. HCC202-Cas9 cells were transduced with either a control sgRNA (sgCh2–2) or an sgRNA targeting BIRC6 (sgBIRC6–4). Four days later, cells were harvested and subjected to LC/MS-MS. The magnitude [LFC (sgBIRC6/sgCh2–2)] and significance [−log10 (P)] of the difference in protein expression between the control and BIRC6 knockout samples were plotted. Here and in B, the products of the genes that are transcriptionally regulated by ISR are indicated by the orange dots, while HRI is indicated by the green dot. B, Comparison of the BIRC6-depletion-induced proteomic changes in the presence and absence of ISRIB treatment. C, Elevated expression of HRI protein after depleting individual components of the BIRC6 complex. HCC202-Cas9 and SNU503-Cas9 cells were transduced with the indicated sgRNA, and their lysates were harvested 4 days later. Lysates of the cells treated with MG-132 (10 μmol/L) or a vehicle control for 6 hours were also analyzed by immunoblotting. D, Stabilization of HRI following BIRC6 depletion. HCC202-Cas9 cells, transduced with either sgCh2–2 or sgBIRC6–4, were transiently transfected with a plasmid expressing V5-tagged HRI (HRI-V5). These cells were subsequently treated with cycloheximide (CHX, 50 μg/mL) and harvested at the indicated time points. Changes in the relative intensity between V5 and β-actin signals were plotted (right). Values = means ± SEM (n = 4). ****,P < 0.0001. E, Reduced HRI ubiquitination following BIRC6 depletion. HCC202-Cas9 cells that constitutively express HA-tagged ubiquitin (HA-ubiquitin) were further engineered to express HRI-V5 in a doxycycline-inducible manner and then transduced with sgCh2–2 or sgBIRC6–4. These cells were subsequently treated with doxycycline (1 μg/mL, 48 hours), ISRIB (1 μmol/L, 48 hours), and/or MG-132 (10 μmol/L, 6 hours) and their lysates were immunoprecipitated with anti-V5 followed by immunoblotting. The ubiquitin chains attached to HRI-V5 were clearly detected in the control (sgCh2–2) sample treated with all the three reagents (DOX, ISRIB, MG-132), but was less clear in the BIRC6 KO (sgBIRC6–4) sample. The relative intensity between HA(-ubiquitin) and (HRI-)V5 signals for the samples cotreated with doxycycline, ISRIB, and MG-132 was plotted (right). Values = means ± SD (n = 5). F, A physical interaction between UBR4 and HRI. HCC202-Cas9 cells were engineered to express HRI-V5 in a doxycycline-inducible manner. Following treatment with doxycycline (1 μg/mL, 48 hours), ISRIB (1 μmol/L, 48 hours), and/or MG-132 (10 μmol/L, 6 hours), cells were harvested, and the lysates were subjected to anti-V5 immunoprecipitation and analysis by immunoblotting. G, Analysis of HRI phosphorylation status using a Phos-tag gel. HCC202-Cas9 cells, transduced with either sgCh2–2 or sgBIRC6–4, were transiently transfected with a plasmid expressing HRI-V5. HCC202-Cas9 cells without sgRNA transduction were also transfected with an HRI-V5—expressing plasmid and subsequently treated with either arsenite (300 μmol/L, 3 hours) or vehicle control (mock). Lysates of these cells were either treated with lambda phosphatase (+λPP) or left untreated (+λPP) and analyzed by immunoblotting using a Phos-tag gel and a standard protein (regular) gel. The knockout of BIRC6 resulted in the upregulation of phosphorylated and nonphosphorylated forms of HRI. H, Changes in expression of ISR markers upon HRI depletion. The Cas9-expressing derivatives of the indicated cells were transduced with either an sgRNA against HRI or a control sgRNA (sgCh2–2). Four days later, their lysates were harvested and analyzed for the expression levels of various ISR marker proteins. Relative intensity of the ATF3 and SESN2 bands, both of which were normalized to the intensity of the corresponding β-actin band, between sgCh2–2 and sgHRI samples were plotted. Values = means ± SD (n = 3). ****,P < 0.0001 (dependent vs. nondependent). All the experiments were performed twice, except for the proteomics experiment (A and B; conducted once), cycloheximide-chase assay (D; summary of four independent experiments is presented), and HRI ubiquitination assay (E; summary of five independent experiments is presented).
Figure 6.
Ubiquitination and stability of HRI are governed by the BIRC6 complex. A, Proteomic changes following BIRC6 depletion in the presence and absence of ISRIB. HCC202-Cas9 cells were transduced with either a control sgRNA (sgCh2-2) or an sgRNA targeting BIRC6 (sgBIRC6-4). Four days later, cells were harvested and subjected to LC/MS-MS. The magnitude [LogFC (sgBIRC6/sgCh2-2)] and significance [−log10 (P)] of the difference in protein expression between the control and BIRC6 knockout samples were plotted. Here and in B, the products of the genes that are transcriptionally regulated by ISR are indicated by the orange dots, while HRI is indicated by the green dot. B, Comparison of the BIRC6 depletion–induced proteomic changes in the presence and absence of ISRIB treatment. C, Elevated expression of HRI protein after depleting individual components of the BIRC6 complex. HCC202-Cas9 and SNU503-Cas9 cells were transduced with the indicated sgRNA, and their lysates were harvested 4 days later. Lysates of the cells treated with MG132 (10 μmol/L) or a vehicle control for 6 hours were also analyzed by immunoblotting. D, Stabilization of HRI following BIRC6 depletion. HCC202-Cas9 cells, transduced with either sgCh2-2 or sgBIRC6-4, were transiently transfected with a plasmid expressing HRI-V5. These cells were subsequently treated with cycloheximide (CHX; 50 μg/mL) and harvested at the indicated time points. Changes in the relative intensity between V5 and β-actin signals were plotted (right). Values = means ± SEM (n = 4). ****, P < 0.0001. E, Reduced HRI ubiquitination following BIRC6 depletion. HCC202-Cas9 cells that constitutively express HA-tagged Ubiquitin (HA-Ubiquitin) were further engineered to express HRI-V5 in a doxycycline (DOX)-inducible manner and then transduced with sgCh2-2 or sgBIRC6-4. These cells were subsequently treated with DOX (1 μg/mL, 48 hours), ISRIB (1 μmol/L, 48 hours), and/or MG132 (10 μmol/L, 6 hours), and their lysates were immunoprecipitated (IP) with anti-V5 followed by immunoblotting. The ubiquitin chains attached to HRI-V5 were clearly detected in the control (sgCh2-2) sample treated with all the three reagents (DOX, ISRIB, MG132) but was less clear in the BIRC6 knockout (sgBIRC6-4) sample. The relative intensity between HA(-ubiquitin) and (HRI-)V5 signals for the samples cotreated with DOX, ISRIB, and MG132 was plotted (right). Values = means ± SD (n = 5). F, A physical interaction between UBR4 and HRI. HCC202-Cas9 cells were engineered to express HRI-V5 in a DOX-inducible manner. Following treatment with DOX (1 μg/mL, 48 hours), ISRIB (1 μmol/L, 48 hours), and/or MG132 (10 μmol/L, 6 hours), cells were harvested, and the lysates were subjected to anti-V5 IP and analysis by immunoblotting. G, Analysis of HRI phosphorylation status using a Phos-tag gel. HCC202-Cas9 cells, transduced with either sgCh2-2 or sgBIRC6-4, were transiently transfected with a plasmid expressing HRI-V5. HCC202-Cas9 cells without sgRNA transduction were also transfected with an HRI-V5–expressing plasmid and subsequently treated with either arsenite (300 μmol/L, 3 hours) or vehicle control (mock). Lysates of these cells were either treated with lambda phosphatase (+λPP) or left untreated (+λPP) and analyzed by immunoblotting using a Phos-tag gel and a standard protein (regular) gel. The knockout of BIRC6 resulted in the upregulation of phosphorylated and nonphosphorylated forms of HRI. H, Changes in expression of ISR markers upon HRI depletion. The Cas9-expressing derivatives of the indicated cells were transduced with either an sgRNA against HRI or a control sgRNA (sgCh2-2). Four days later, their lysates were harvested and analyzed for the expression levels of various ISR marker proteins. Relative intensity of the ATF3 and SESN2 bands, both of which were normalized to the intensity of the corresponding β-actin band, between sgCh2-2 and sgHRI samples were plotted. Values = means ± SD (n = 3). ****,P < 0.0001 (dependent vs. nondependent). The experiment shown in A and B was conducted once, the experiments shown in C and F were conducted twice, the experiments shown in G and H were conducted three times, the experiment shown in D was conducted four times, and the experiment shown in E was conducted five times.
Figure 7. Enrichment of BIRC6 dependency in aneuploidy-high cancer cells. A, Random Forest modeling of BIRC6 dependency using aggregated scores for cancer-specific genetic changes (“cancer driver” feature set). The top ten most important predictive features and the relative importance of each feature are indicated (left). For all the genetic dependencies profiled in the DepMap CRISPR screen (n = 17,386), the prediction accuracy of the random forest modeling with the “cancer driver” feature set was plotted (right). B, Correlation between BIRC6 dependency and aneuploidy score across different cell line models. C, Genetic dependencies correlated with the aneuploidy score. The correlation between the aneuploidy score and genetic dependency [-(Pearson r)] and the significance of correlation were plotted. D, Comparison of BIRC6 dependency between the group of cell lines with high aneuploidy scores (aneuploidy score ≥ 25, n = 107) and the group of cell lines with low aneuploidy scores (aneuploidy score ≤ 6; n = 118). ****, P < 0.0001. E, Comparison of aneuploidy score between the group of cell lines that are most strongly dependent on BIRC6 [bottom 100 in BIRC6 Chronos score (<−0.55)] and the group of cell lines that are least dependent on BIRC6 [top 100 in BIRC6 Chronos score (>−0.091)]. ****, P < 0.0001. F, A model for the antitumor effect of inhibiting the BIRC6 complex. HRI, whose mRNA expression is elevated in the tumor cells compared with normal cells of the same tissue across many different lineages (see Supplementary Fig. S8A and S8B), is activated under a variety of cancer-associated stress conditions, including, but not limited to, the stress arising from a high degree of aneuploidy. A subset of the tumor cells that exhibit a high level of steady-state HRI kinase activity appear to exploit HRI degradation by the BIRC6 ubiquitin ligase complex as a strategy to prevent aberrant ISR activation and thus to survive. This highlights the potential of the BIRC6 complex as a therapeutic target to selectively eliminate these tumor cells.
Figure 7.
Enrichment of BIRC6 dependency in aneuploidy-high cancer cells. A, Random forest modeling of BIRC6 dependency using aggregated scores for cancer-specific genetic changes (“cancer driver” feature set). The top 10 most important predictive features and the relative importance of each feature are indicated (left). For all the genetic dependencies profiled in the DepMap CRISPR screen (n = 17,386), the prediction accuracy of the random forest modeling with the “cancer driver” feature set was plotted (right). B, Correlation between BIRC6 dependency and aneuploidy score across different cell line models.C, Genetic dependencies correlated with the aneuploidy score. The correlation between the aneuploidy score and genetic dependency [−(Pearson r)] and the significance of correlation were plotted. D, Comparison of BIRC6 dependency between the group of cell lines with high aneuploidy scores (aneuploidy score ≥ 25, n = 107) and the group of cell lines with low aneuploidy scores (aneuploidy score ≤ 6, n = 118). ****, P < 0.0001. E, Comparison of aneuploidy score between the group of cell lines that is most strongly dependent on BIRC6 [bottom 100 in BIRC6 Chronos score (< −0.55)] and the group of cell lines that is least dependent on BIRC6 [top 100 in BIRC6 Chronos score (> −0.091)]. ****, P < 0.0001. F, A model for the antitumor effect of inhibiting the BIRC6 complex. HRI, whose mRNA expression is elevated in the tumor cells compared with normal cells of the same tissue across many different lineages (see Supplementary Fig. S8A and S8B), is activated under a variety of cancer-associated stress conditions, including, but not limited to, the stress arising from a high degree of aneuploidy. A subset of the tumor cells that exhibit a high level of steady-state HRI kinase activity appear to exploit HRI degradation by the BIRC6 ubiquitin ligase complex as a strategy to prevent aberrant ISR activation and thus to survive. This highlights the potential of the BIRC6 complex as a therapeutic target to selectively eliminate these tumor cells.

Comment in

References

    1. Tsherniak A, Vazquez F, Montgomery PG, Weir BA, Kryukov G, Cowley GS, et al. . Defining a cancer dependency map. Cell 2017;170:564–76. - PMC - PubMed
    1. Cowley GS, Weir BA, Vazquez F, Tamayo P, Scott JA, Rusin S, et al. . Parallel genome-scale loss of function screens in 216 cancer cell lines for the identification of context-specific genetic dependencies. Sci Data 2014;1:140035. - PMC - PubMed
    1. Luo B, Cheung HW, Subramanian A, Sharifnia T, Okamoto M, Yang X, et al. . Highly parallel identification of essential genes in cancer cells. Proc Natl Acad Sci U S A 2008;105:20380–5. - PMC - PubMed
    1. Ngo VN, Davis RE, Lamy L, Yu X, Zhao H, Lenz G, et al. . A loss-of-function RNA interference screen for molecular targets in cancer. Nature 2006;441:106–10. - PubMed
    1. McDonald ER 3rd, de Weck A, Schlabach MR, Billy E, Mavrakis KJ, Hoffman GR, et al. . Project DRIVE: a compendium of cancer dependencies and synthetic lethal relationships uncovered by large-scale, deep RNAi screening. Cell 2017;170:577–92. - PubMed

Publication types