. 2023 Jan 1;98(1):88-97.
doi: 10.1097/ACM.0000000000004918. Epub 2022 Aug 9.

Modeling Diagnostic Expertise in Cases of Irreducible Uncertainty: The Decision-Aligned Response Model

Affiliations

Modeling Diagnostic Expertise in Cases of Irreducible Uncertainty: The Decision-Aligned Response Model

Martin V Pusic et al. Acad Med. .

Abstract

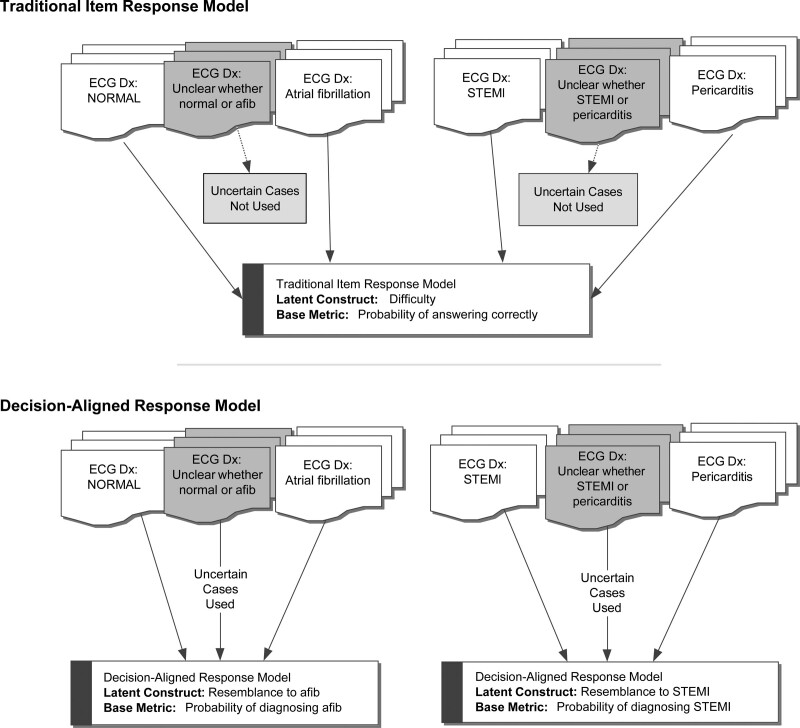
Purpose: Assessing expertise using psychometric models usually yields a measure of ability that is difficult to generalize to the complexity of diagnoses in clinical practice. However, using an item response modeling framework, it is possible to create a decision-aligned response model that captures a clinician's decision-making behavior on a continuous scale that fully represents competing diagnostic possibilities. In this proof-of-concept study, the authors demonstrate the necessary statistical conceptualization of this model using a specific electrocardiogram (ECG) example.

Method: The authors collected a range of ECGs with elevated ST segments due to either ST-elevation myocardial infarction (STEMI) or pericarditis. Based on pilot data, 20 ECGs were chosen to represent a continuum from "definitely STEMI" to "definitely pericarditis," including intermediate cases in which the diagnosis was intentionally unclear. Emergency medicine and cardiology physicians rated these ECGs on a 5-point scale ("definitely STEMI" to "definitely pericarditis"). The authors analyzed these ratings using a graded response model showing the degree to which each participant could separate the ECGs along the diagnostic continuum. The authors compared these metrics with the discharge diagnoses noted on chart review.

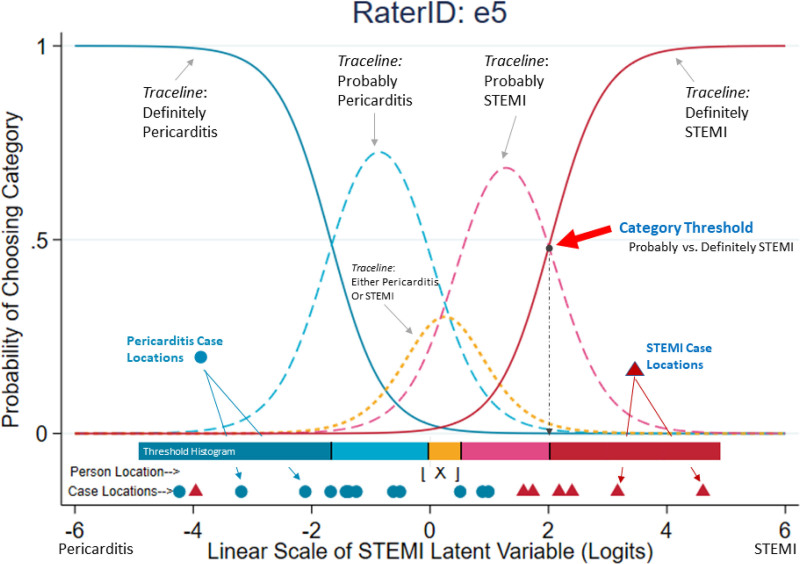
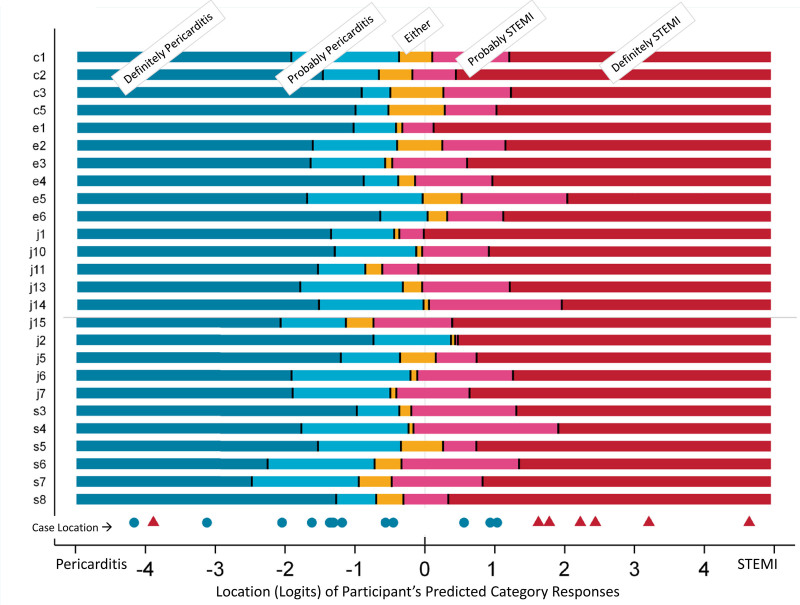
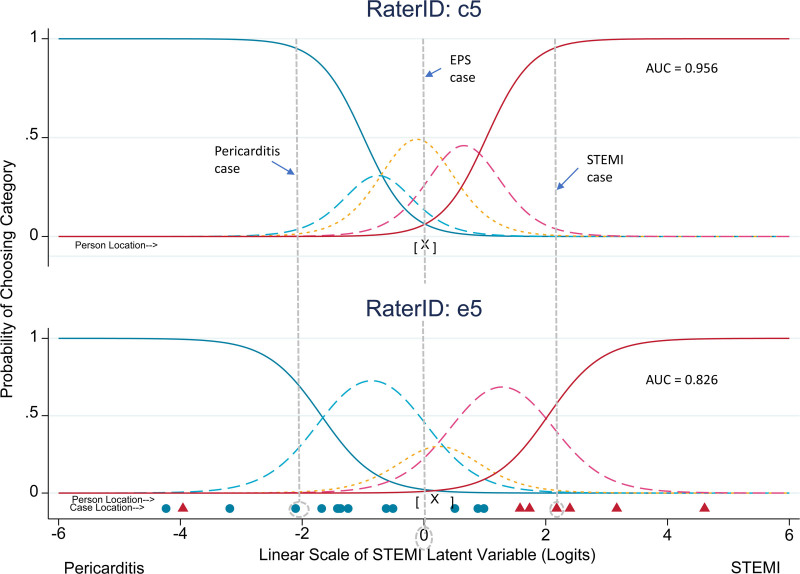
Results: Thirty-seven participants rated the ECGs. As desired, the ECGs represented a range of phenotypes, including cases where participants were uncertain in their diagnosis. The response model showed that participants varied both in their propensity to diagnose one condition over another and in where they placed the thresholds between the 5 diagnostic categories. The most capable participants were able to meaningfully use all categories, with precise thresholds between categories.

Conclusions: The authors present a decision-aligned response model that demonstrates the confusability of a particular ECG and the skill with which a clinician can distinguish 2 diagnoses along a continuum of confusability. These results have broad implications for testing and for learning to manage uncertainty in diagnosis.


Conflict of interest statement

Other disclosures: Martin V. Pusic had full access to all data in this study, takes responsibility for the integrity of the data and the accuracy of the data analysis, and had authority over manuscript preparation and submission. He conducted the data analyses. All authors contributed to obtaining funding, study design, and data collection; reviewed data analyses; revised the manuscript for important intellectual content; and approved the final manuscript.

Figures

Figure 1
Figure 1
Conceptual framework for traditional item response modeling (IRM) vs decision-aligned response modeling (DA-RM). In traditional IRM (upper panel), items are chosen to represent a latent scale of difficulty ranging from easy to hard, based on the probability of an individual responding to the item correctly. Items are ranked as difficult if they have a low probability of being answered correctly. Uncertain items are systematically excluded. The diagnosis (e.g., pericarditis vs STEMI) influences the scale only indirectly through its degree of difficulty. In DA-RM (lower panel), items are chosen to represent a latent continuous scale between 2 diagnostic poles (e.g., pericarditis or STEMI); items range from prototypical cases at either end of the scale to ones in the middle where an expert clinician might think the item is equally likely to be one diagnosis or the other. Items are ranked by the probability of endorsement of one diagnosis over the other. Thus, the actual diagnosis influences the scale directly. See Table 1 for more about the conceptual differences between these models. Abbreviations: ECG, electrocardiogram; Dx, diagnosis; STEMI, ST-elevation myocardial infarction.
Figure 2
Figure 2
Tracelines for one participant completing 20 ECG cases twice (40 total) in a decision-aligned response model study. Here, we describe each figure element from top to bottom. Subsequent figures use these same definitions. The 5 tracelines represent modeled predictions of which category this participant would prefer when confronted with a case at that point on the logit (x-axis) scale. The category threshold location is the point on the logit (x-axis) scale where the tracelines for 2 adjacent categories cross, meaning that this participant would be predicted to be equally likely to endorse the categories above or below that threshold for an ECG case at that exact point on the scale. The 5-point scale shown includes 4 category thresholds; we labeled only the “probably STEMI” vs “definitely STEMI” threshold. The person location is the tendency or bias of this participant to diagnose cases toward one end of the scale compared with the other; similar to a sensitivity/specificity tradeoff, it is mathematically defined as the point where the top and bottom categories (tracelines) intersect. A person location of zero (as shown here delineated by the “X”) indicates a lack of bias in either direction. The ECG case locations (blue circles = pericarditis, red triangles = STEMI) are the markers that show the estimated degree to which each of the 20 cases resembles pericarditis (left side) or STEMI (right side), as derived from the responses of all participants. A case at 0 logits would be maximally confusable according to the latent construct, predicted to have equal resemblance to pericarditis and STEMI. The threshold bar-histogram is the horizontal 5 color bar that shows which category this participant is most likely to choose for a case at that location on the logit scale. Adjoining changes in color correspond to this participant’s category thresholds. In Figure 3, these individual-level bar-histograms are compared for many of the participants in the study. The x-axis (logit scale) is the linear psychometric scale whose units correspond to the natural log of the odds of declaring a case STEMI. Positive numbers indicate a higher probability of diagnosing STEMI on that ECG; negative numbers indicate a higher probability of diagnosing pericarditis. Item response modeling generates a participant’s category tracelines by conditioning their particular responses with those of all other participants, according to the theoretical response distribution (see text). In the example above, an ECG along the confusability continuum whose logit value is 2.0 would be equally likely to be classified by this participant as “definitely STEMI” vs “probably STEMI” (or lower category). It is possible to calculate the 95% confidence interval (not shown in the figure) for that threshold (1.4, 2.7) indicating the precision of the estimate. Abbreviations: ECG, electrocardiogram; STEMI, ST-elevation myocardial infarction.
Figure 3
Figure 3
Response thresholds for participants in a decision-aligned response model study. The x-axis scale represents the degree (in logits) to which each participant would be likely to assign the determination of either STEMI (right side) or pericarditis (left side). Each horizontal bar represents a participant, limited to those who used all 5 categories in their responses (“definitely pericarditis” to “definitely STEMI”). The colors show the predicted category that each participant would most likely select for a case at that point on the scale. The colored markers just above the x-axis are the ECG cases placed on the same logit scale, with the color indicating the discharge diagnosis (blue circles = pericarditis, red triangles = STEMI). The STEMI case at the left end (−3.96 logits) of the scale (Case 18: IR) is an exception and is discussed in the text. Certain patterns are apparent from this graph. Use of the categories varies between participants, such that some individuals build in a larger safety margin (assigning borderline pericarditis cases to the STEMI categories [e.g., j15]), and some use the “definitely” category more liberally than others (e.g., j11). The degree to which the middle (yellow) category (“either pericarditis or STEMI”) lines up with the zero line indicates the calibration of the participant with respect to a case that is modeled to have a 50% likelihood of either diagnosis. Abbreviations: ECG, electrocardiogram; STEMI, ST-elevation myocardial infarction.
Figure 4
Figure 4
Comparison of decision-aligned response model tracelines for 2 participants. See the Figure 2 legend for an explanation of the figure elements. Rater c5 (upper panel) is much more certain than rater e5 (lower panel) of their diagnoses for the labeled pericarditis and STEMI cases (vertical lines). More specifically, for the pericarditis case at −2.0 logits, rater c5 would almost always use the “definitely pericarditis” category, whereas rater e5 would be predicted to use the “probably” qualifier approximately a third of the time. A similar pattern is seen for the STEMI case at +2.3 logits. The raters also differ in their consideration of a maximally confusable case at 0 logits (“EPS case”), where rater c5 would preferentially choose “either pericarditis or STEMI” in the majority of cases (50% contrasted with 25% for higher and lower categories). For the same case, rater e5 would be predicted to use any of the 3 adjacent categories with equal frequency. Abbreviations: STEMI, ST-elevation myocardial infarction; AUC, area under the receiver operating characteristic curve.

Similar articles

References

    1. Tamblyn R, Abrahamowicz M, Dauphinee WD, et al. . Association between licensure examination scores and practice in primary care. JAMA. 2002;288:3019–3026. - PubMed
    1. Ilgen JS, Eva KW, de Bruin A, Cook DA, Regehr G. Comfort with uncertainty: Reframing our conceptions of how clinicians navigate complex clinical situations. Adv Health Sci Educ Theory Pract. 2019;24:797–809. - PubMed
    1. Zhang S, Petersen JH. Quantifying rater variation for ordinal data using a rating scale model. Stat Med. 2018;37:2223–2237. - PubMed
    1. Schwarz RD. Trace lines for classification decisions. Appl Meas Edu. 1998;4:311–330.
    1. Baldwin P, Bernstein J, Wainer H. Hip psychometrics. Stat Med. 2009;28:2277–2292. - PubMed