. 2023 Feb 9;223(2):iyac185.
doi: 10.1093/genetics/iyac185.

Imaginal disk growth factors are Drosophila chitinase-like proteins with roles in morphogenesis and CO2 response

Affiliations

Imaginal disk growth factors are Drosophila chitinase-like proteins with roles in morphogenesis and CO2 response

Anne E Sustar et al. Genetics. .

Abstract

Chitinase-like proteins (CLPs) are members of the family 18 glycosyl hydrolases, which include chitinases and the enzymatically inactive CLPs. A mutation in the enzyme's catalytic site, conserved in vertebrates and invertebrates, allowed CLPs to evolve independently with functions that do not require chitinase activity. CLPs normally function during inflammatory responses, wound healing, and host defense, but when they persist at excessive levels at sites of chronic inflammation and in tissue-remodeling disorders, they correlate positively with disease progression and poor prognosis. Little is known, however, about their physiological function. Drosophila melanogaster has 6 CLPs, termed Imaginal disk growth factors (Idgfs), encoded by Idgf1, Idgf2, Idgf3, Idgf4, Idgf5, and Idgf6. In this study, we developed tools to facilitate characterization of the physiological roles of the Idgfs by deleting each of the Idgf genes using the CRISPR/Cas9 system and assessing loss-of-function phenotypes. Using null lines, we showed that loss of function for all 6 Idgf proteins significantly lowers viability and fertility. We also showed that Idgfs play roles in epithelial morphogenesis, maintaining proper epithelial architecture and cell shape, regulating E-cadherin and cortical actin, and remarkably, protecting these tissues against CO2 exposure. Defining the normal molecular mechanisms of CLPs is a key to understanding how deviations tip the balance from a physiological to a pathological state.

Keywords: Drosophila; CO2 exposure; cell migration; chitinase-like proteins; fertility; hypercapnia; imaginal disk growth factors; morphogenesis.


Conflict of interest statement

Conflicts of interest statement: The authors declare no conflict of interest.

Figures
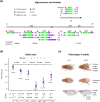
Fig. 1.
Fig. 1.
Idgf complete knockouts are not entirely lethal. a) Diagram shows cytological locations of Idgf genes and structure of transcript isoforms, including 5′ and 3′ untranslated regions, coding sequences, and introns. Black arrows on transcripts indicate the orientation of transcription in the plus (right-pointing) or minus (left-pointing) direction. Arrowheads indicate approximate cut sites for deleting each Idgf gene. In the sxtΔ mutant, the deletion of Idgf2 and Idgf3 spans the entire sequence from the Idgf2 5′ upstream cut site to the Idgf3 3′ downstream cut site, deleting both genes and the 400 base pairs between them. b) Homozygous and heterozygous sxtΔ mutants have low hatch rates relative to control (w1118). Dots represent egg-laying assays sampled from 3 independent biological replicates with 350–852 eggs analyzed per replicate. Error bars indicate 95% confidence intervals. Significance is based on pairwise t-tests with P-values adjusted for multiple comparisons (Benjamini–Hochberg). ** P ≤ 0.01, **** P ≤ 0.0001. c) Phenotypes exhibited by adult offspring of homozygous sxtΔ parents (i.e. F2 adults). Top row, dorsal view: 40% of males (n = 48) and 71% of females (n = 31) had etched tergites (arrow). Of the same flies, 60% of males and 48% of females exhibited abnormal wing postures: wings were held out and down (“droopy” wings) or held out and up. Middle row, ventral view: rarely (<5% of flies), sxtΔ mutants displayed dark cuticle patches (arrow) reminiscent of melanotic clots. Bottom row: 5% of male wings (n = 78 wings) and 74% of female wings (n = 43 wings) displayed ectopic wing veins (arrow). w1118 flies displayed none of these phenotypes (n = 20 males and 20 females). Anterior is up, distal is to the right.
Fig. 2.
Fig. 2.
Idgf mutants exhibit defects in DA tube formation. a) DA formation. Roof cells (blue) and floor cells (red) change shape and reorganize to make 2 DA tubes. Stretch cells, cut away to show nurse cells, guide tube elongation. DAs (arrowheads) of the laid egg bring air to the embryo that is developing inside the eggshell. b) Representative examples of DA morphology categorized into normal, moderate, and severe phenotypes. Scale bar = 100 µm. c) Moderate and severe DA phenotypes are significantly increased in eggs laid by Idgf6Δ/Df and sxtΔ females relative to the w1118 control, indicating defects in tubulogenesis during oogenesis. Idgf1Δ/Df, Idgf2Δ/Df, Idgf3Δ/Df, Idgf4Δ/Df, and Idgf5Δ/Df single mutants do not significantly affect DA morphology [C(i)]. Expression of a wild-type Idgf6 transgene in sxtΔ mutant females partially rescues DA morphology [C(ii)]. Deficiency chromosomes specific to each mutant are listed in Supplementary Table 3. ***P < 0.001. Fisher's exact test, adjusted for multiple comparisons. Schematic diagrams in (a) are adapted with permission from Dorman et al. (2004).
Fig. 3.
Fig. 3.
Idgfs protect against CO2 exposure. a) Effect of hypoxia on DA phenotype. Air is replaced with 100% N2 for 5 min to induce hypoxia. DA phenotype is not significantly affected by hypoxia. b) Expressing a single copy of a wild-type Idgf6 transgene rescues the DA Idgf phenotype induced by a single, 1-min pulse of 100% CO2. The sxtΔ phenotype is partially but not significantly rescued (P = 0.23, Fisher's exact test). Proportions of defects peak at 8–10 h after the CO2 pulse. The Idgf deletion is transheterozygous with a deficiency chromosome to cover potential background mutations. ****significance (P ≤ 0.0001, Fisher's exact test), NS = not significant. c) Hourly assessment of DA phenotype following a 1-min pulse of 100% CO2. DA defects in eggs laid by sxtΔ females peak at 7–10 h after CO2 exposure.
Fig. 4.
Fig. 4.
sxtΔ mutants exhibit defects in cell morphology but not patterning of DA-forming cells. Images are projections of Z-stacks. a–c′) Stage 10B egg chambers. Top row (a–c): High expression of Broad marks the roof cells in the DA primordium, DAPI indicates the nuclei. Patterning is normal in sxtΔ mutant exposed to CO2. Lower row (a′–c′): E-cadherin delineates the apico-lateral cell junctions in follicle cells. Epithelial morphology and E-cadherin localization are disrupted in sxtΔ mutant DA-forming patches after a single pulse of 100% CO2 exposure. Insets show magnified views outlined by the white rectangles. d–g) Stage 12 egg chambers. Filamentous actin is visualized with rhodamine-phalloidin. DA roof cells (white rectangles) form a wider appendage and are less constricted in the sxtΔ mutant (e) compared with control (w1118) (d) egg chambers. f) As shown in w1118 egg chambers, basal cell membranes normally exhibit bright spots of actin localization (arrow). g) In sxtΔ mutants, filamentous actin is reduced in cell membranes after CO2 exposure. Arrowheads in the sxtΔ + CO2 image indicate chorion autofluorescence. Images are representative of 68 egg chambers: w1118 no CO2 (not shown) (n = 7 Stage 10B and 6 Stage 12 egg chambers), w1118 plus CO2 (n = 11 Stage 10B and 9 Stage 12), sxtΔ no CO2 (n = 10 Stage 10B and 7 Stage 12), sxtΔ plus CO2 (n = 10 Stage 10B and 12 Stage 12). Scale bars = 50 µm.
Fig. 5.
Fig. 5.
Cortical actin and E-cadherin respond differently to CO2 in sxtΔ egg chambers. a) Fluorescent intensity in Stage 10B roof cells (square) and Stage 12 floor cells (square). Measurements were made apically in w1118 and sxtΔ egg chambers in both E-cadherin and actin channels. Shown are examples of E-cadherin in w1118 egg chambers. Scale bar = 50 µm. b) Comparison of w1118 and sxtΔ fluorescence intensity plot profiles averaged across 3 cell membranes, from the center of 1 cell to the center of the neighboring cell, averaged over at least 6 egg chambers for each genotype and each exposure regime as indicated. Plots show mean (inner thicker plot line) and 95% confidence limits (outer thinner plot lines). c) Integrated area under the curves in (b) and (b′) averaged over all measurements. Error bars show 95% confidence limits. *P ≤ 0.05, Student's t-test, Benjamini–Hochberg adjusted P-values.
Fig. 6.
Fig. 6.
Quantification of cortical actin and E-cadherin intensity in Stage 8–12 embryos. a, b) Representative embryo images showing E-cadherin (a) and actin (rhodamine phalloidin) (b) comparing genotypes and CO2 regime as indicated. Scale bar = 50 µm. (a′, b′) Comparison of w1118 and sxtΔ fluorescence intensity measured across 6 cell membranes per embryo, from the center of 1 cell to the center of the neighboring cell. The colors represent different biological replicates. Each point in the graphs represents the average of the areas under the 6 plot profiles per embryo. The notches on the box plots represent the 95% confidence interval of the medians (horizontal lines), ± 1.57*IQR/sqrt(n). IQR = interquartile range. + signs = means. Non-overlapping notches are strong evidence that their medians significantly differ. sxtΔ embryos are offspring of homozygous mutant parents.
Fig. 7.
Fig. 7.
Quantification of cortical actin intensity in Stage 3–5 embryos. a) Actin in early embryos comparing genotypes and CO2 regime as indicated. b) Comparison of w1118 and sxtΔ fluorescence intensity plot profiles averaged across 6 cell membranes, from the center of 1 cell to the center of the neighboring cell, averaged over at least 10 Stage 3–5 embryos for each genotype and each exposure regime as indicated. Plots show mean (inner thicker plot line) and 95% confidence limits (outer thinner plot lines). c) Integrated area under the curves in (b) averaged over all measurements. sxtΔ embryos are offspring of homozygous mutant parents. Error bars show 95% confidence limits. **P ≤ 0.01, Student's t-test, Benjamini–Hochberg adjusted P-values.

Similar articles

Cited by

References

    1. Areshkov PO, Avdieiev SS, Balynska OV, Leroith D, Kavsan VM. Two closely related human members of chitinase-like family, CHI3L1 and CHI3L2, activate ERK1/2 in 293 and U373 cells but have the different influence on cell proliferation. Int J Biol Sci. 2012;8(1):39–48. doi:10.7150/ijbs.8.39. - DOI - PMC - PubMed
    1. Arias EB, Verhage HG, Jaffe RC. Complementary deoxyribonucleic acid cloning and molecular characterization of an estrogen-dependent human oviductal glycoprotein. Biol Reprod. 1994;51(4):685–694. doi:10.1095/biolreprod51.4.685. - DOI - PubMed
    1. Athilingam T, Tiwari P, Toyama Y, Saunders TE. Mechanics of epidermal morphogenesis in the Drosophila pupa. Semin Cell Dev Biol. 2021;120:171–180. doi:10.1016/j.semcdb.2021.06.008. - DOI - PubMed
    1. Bartholomew NR, Burdett JM, VandenBrooks JM, Quinlan MC, Call GB. Impaired climbing and flight behaviour in Drosophila melanogaster following carbon dioxide anaesthesia. Sci Rep. 2015;5(1):15298. doi:10.1038/srep15298. - DOI - PMC - PubMed
    1. Bejsovec A, Martinez Arias A. Roles of wingless in patterning the larval epidermis of Drosophila. Development. 1991;113(2):471–485. doi:10.1242/dev.113.2.471. - DOI - PubMed

Publication types

MeSH terms

LinkOut - more resources