. 2022 Dec 28;17(12):e0270731.
doi: 10.1371/journal.pone.0270731. eCollection 2022.

A model for understanding the causes and consequences of walking impairments

Affiliations

A model for understanding the causes and consequences of walking impairments

Michael H Schwartz et al. PLoS One. .

Abstract

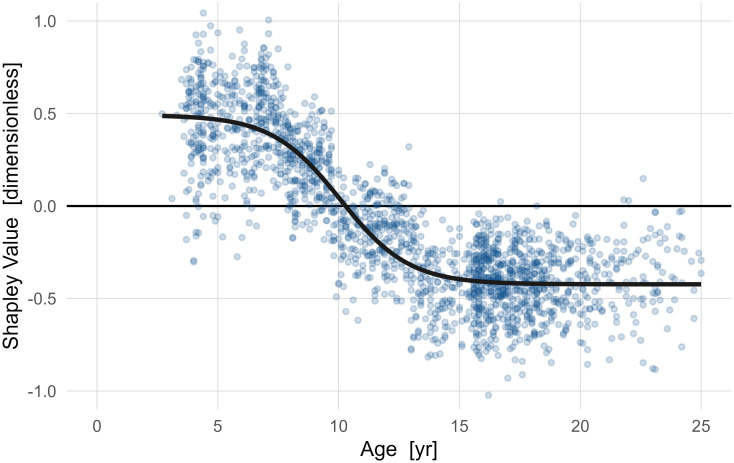
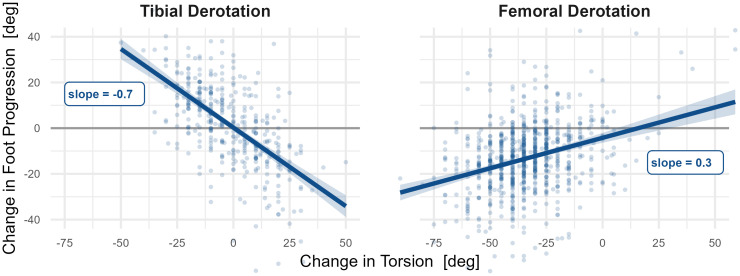
Walking is an important skill with positive impacts on health, function, and well-being. Many disorders impair walking and its positive impacts through a variety of complex and interrelated mechanisms. Any attempt to understand walking impairments, or the effects of interventions intended to treat these impairments, must respect this complexity. Therefore, our main objectives in conducting this study were to (1) propose a comprehensive model for quantifying the causes and consequences of walking impairments and (2) demonstrate the potential utility of the model for supporting clinical care and addressing basic scientific questions related to walking. To achieve these goals, we introduced a model, described by a directed acyclic graph, consisting of 10 nodes and 23 primary causal paths. We gave detailed descriptions of each node and path based on domain knowledge. We then demonstrated the model's utility using a large sample of gait data (N = 9504) acquired as part of routine care at a regional referral center. We analyzed five relevant examples that involved many of the model's nodes and paths. We computed causal effect magnitudes as Shapley values and displayed the overall importance of variables (mean absolute Shapley value), the variation of Shapley values with respect to underlying variables, and Shapley values for individual observations (case studies). We showed that the model was plausible, captured some well-known cause-effect relationships, provided new insights into others, and generated novel hypotheses requiring further testing through simulation or experiment. To aid in transparency, reproducibility, and future enhancements we have included an extensively commented Rmarkdown file and a deidentified data set.


Conflict of interest statement

The authors have declared that no competing interests exist.

Figures

Fig 1
Fig 1. The proposed causal model in schematic form.
The proposed model nodes include Condition (latent), Diagnosis, History, Age, Sex, Structure and Function, Gait Mechanics, Mobility, Energy, and Quality-of-Life. Extensive details of proposed nodes are found in the text. Descriptions of the paths are found in S1 Appendix. A full implementation of the model (Rmarkdown file) and a de-identified dataset can be found in the S1 File.
Fig 2
Fig 2. Importance of Structure and Function on mean stance foot progression.
The nine variables with the largest absolute Shapley values for mean stance foot progression are shown. Unsurprisingly, torsions of the tibia and femur are the two largest contributors to mean stance foot progression. Foot deformities comprise the next three largest causes.
Fig 3
Fig 3. Dependence plots for Structure and Function variables with large effects on mean stance foot progression.
The three most important causal variables are shown. The effects of long bone torsions (femur and tibia) are nearly linear. Note that for many years measurements were only recorded at five-degree increments, leading to vertical striations in the left and middle panels.
Fig 4
Fig 4. Case studies of Structure and Function effects on mean stance foot progression.
The top row shows patients with significant in-toeing. On the top-left, the primary cause is excess femoral anteversion, with additional contributions from hindfoot varus and forefoot adduction. On the top-right femoral anteversion and tibial torsion both contribute. The bottom row shows patients with significant out-toeing. On the bottom left, external tibial torsion and forefoot deformity cause the out-toeing. On the bottom right, both femoral retroversion and external tibial torsion contribute meaningfully, along with forefoot abduction.
Fig 5
Fig 5. Importance of Structure and Function on FAQt.
Strength and motor control (static and dynamic) are the main contributors to mobility as measured by the FAQt. These neurological variables have effects around two- to four-times larger than any other variable.
Fig 6
Fig 6. Dependence plots for Structure and Function variables with large effects on FAQt.
Strength and motor control (static and dynamic) constitute the top causal contributors to mobility as measured by the FAQt. The positive effect of dynamic motor control plateaus at around 90, which is 1 SD below typical.
Fig 7
Fig 7. Case studies of Structure and Function effects on the FAQt.
Good mobility (high FAQt) is caused by good strength and good motor control, poor mobility is caused by weakness and poor motor control. Strength and motor control are related, but that fact has been accounted for in the chosen adjustment set.
Fig 8
Fig 8. Importance of Gait Mechanics on net energy consumption.
Knee flexion at initial contact has a causal impact twice as large as the next largest contributors, which are comprised of stance phase kinematic features of the knee and ankle.
Fig 9
Fig 9. Dependence plots for Gait Mechanics variables with large effects on net energy consumption.
Being flexed at initial contact imparts a substantial net energy consumption penalty. Knee hyperextension is costly, but maintaining a flexed position is not. This counterintuitive finding is discussed further in text. A large pelvis range-of-motion and stance phase ankle plantarflexion were also substantial causes of high net energy consumption–though with much smaller effects than knee kinematics.
Fig 10
Fig 10. The effect of stance-phase knee flexion on net energy consumption, stratified by initial contact knee flexion.
The energy benefit of stance-phase crouch scales with the amount of initial contact knee flexion. Only individuals who land in a severely crouched position exhibit a large energy benefit from a large minimum stance-phase knee flexion. Not all individuals who land in severe crouch derive the benefit, suggesting a role for additional causal factors.
Fig 11
Fig 11. Case studies of Gait Mechanics effects on net energy consumption.
The two individuals depicted have net energy consumption between 6 and 7 SD above speed-matched typically developing controls. For the individual on the left, initial contact knee flexion (59°) is an important cause. The individual is in severe crouch (minimum stance knee flexion = 33°)–yet this crouch lowers the net energy consumption. The hypothesized mechanism for this is described in the text. For the patient on the right, knee hyperextension and excessive ankle plantarflexion both contribute meaningfully to the elevated net energy consumption.
Fig 12
Fig 12. The direct effect of age on net energy consumption.
Meaningful maturation effects accounting for around 1 SD of net energy consumption reduction can be clearly seen. The period of rapid reduction occurs from around 7.5–12.5 years. Evaluating the effect of treatment on energy consumption during this epoch must account for the direct effects of age to avoid conflating age-related reductions with treatment effects.
Fig 13
Fig 13. Importance of Structure and Function effects on Activities of Daily Living and Independence, Importance of Gait Mechanics effects on Body Image and Self-Esteem.
Strength and motor control dominate causes of Activities of Daly Living and Independence. These factors are difficult to change using currently available treatments. Some of the important causal variables can be addressed with well-established treatments. For example, ankle plantarflexion (Activities of Daily Living and Independence) or mean stance foot progression (Body Image and Self-Esteem).
Fig 14
Fig 14. The impact of in- and out-toeing on Body Image and Self Esteem.
Raw, non-causal (left) and causal (right) impacts of in- and out-toeing (mean stance foot progression) are shown. The raw data is widely dispersed but is suggestive of detrimental effects when deviating from typical foot alignment (around -10°). These effects are much clearer in the causal dependence plot. Deviations in either direction from typical result in lower Body Image and Self-Esteem, but the impact of in-toeing (positive) is about twice as large as that of out-toeing. There is a precipitous drop in Body Image and Self Esteem starting at around 0°, which is probably where in-toeing becomes easily discernable.
Fig 15
Fig 15. Clinical estimates for the causal effects of tibial torsion and femoral anteversion on in- and out-toeing.
The effects are approximately linear, with slopes of -0.7 and 0.3 for tibial and femoral torsion, respectively. This is similar to the predicted causal effect slopes of -0.6 and 0.3 degrees.

References

    1. Ethgen O, Bruyère O, Richy F, Dardennes C, Reginster J-Y. Health-related quality of life in total hip and total knee arthroplasty. A qualitative and systematic review of the literature. J Bone Joint Surg Am. 2004;86: 963–974. doi: 10.2106/00004623-200405000-00012 - DOI - PubMed
    1. Rozumalski A, Galarraga O, Schwartz M, Desailly E. Experience in a multinational collaboration to predict kinematic outcomes after SEMLS in children with cerebral palsy. 2019. doi: 10.1016/j.gaitpost.2019.07.119 - DOI
    1. Hill J, Stuart EA. Causal Inference: Overview. In: Wright JD, editor. International Encyclopedia of the Social & Behavioral Sciences (Second Edition). Oxford: Elsevier; 2015. pp. 255–260.
    1. app.dimensions.ai. 10 May 2022 [cited 10 May 2022]. https://app.dimensions.ai/discover/publication?search_mode=content&searc...
    1. Pearl J. Causal diagrams for empirical research. Biometrika. 1995;82: 669–688. doi: 10.1093/biomet/82.4.669 - DOI

LinkOut - more resources