. 2023 Jan 3;120(1):e2209990120.
doi: 10.1073/pnas.2209990120. Epub 2022 Dec 28.

Staged suppression of microglial autophagy facilitates regeneration in CNS demyelination by enhancing the production of linoleic acid

Affiliations

Staged suppression of microglial autophagy facilitates regeneration in CNS demyelination by enhancing the production of linoleic acid

Luo-Qi Zhou et al. Proc Natl Acad Sci U S A. .

Abstract

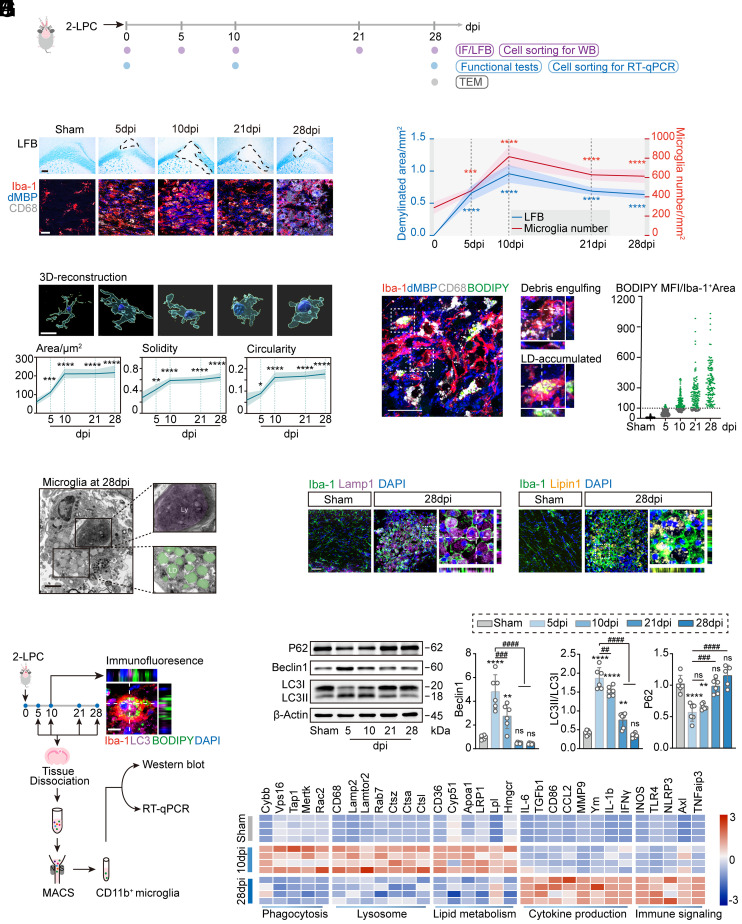
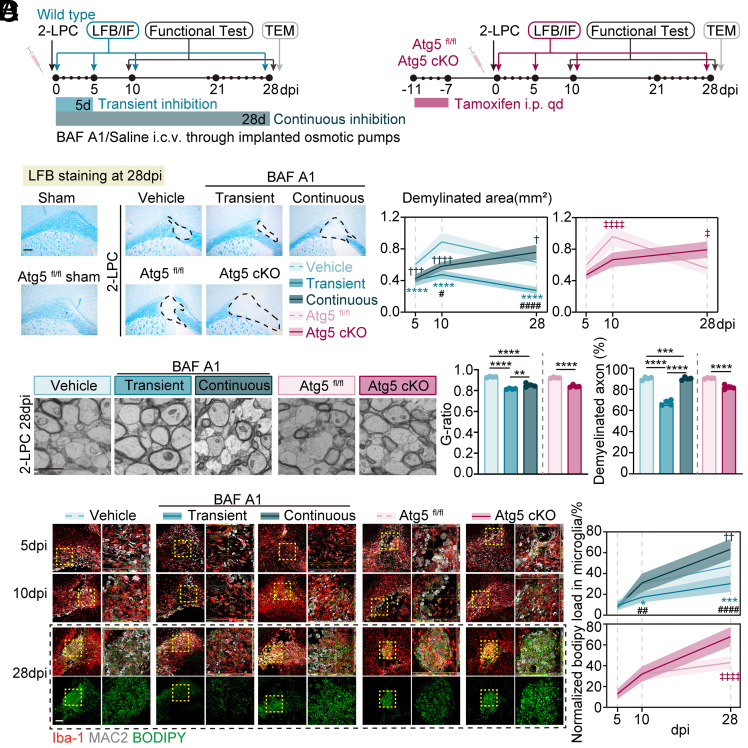
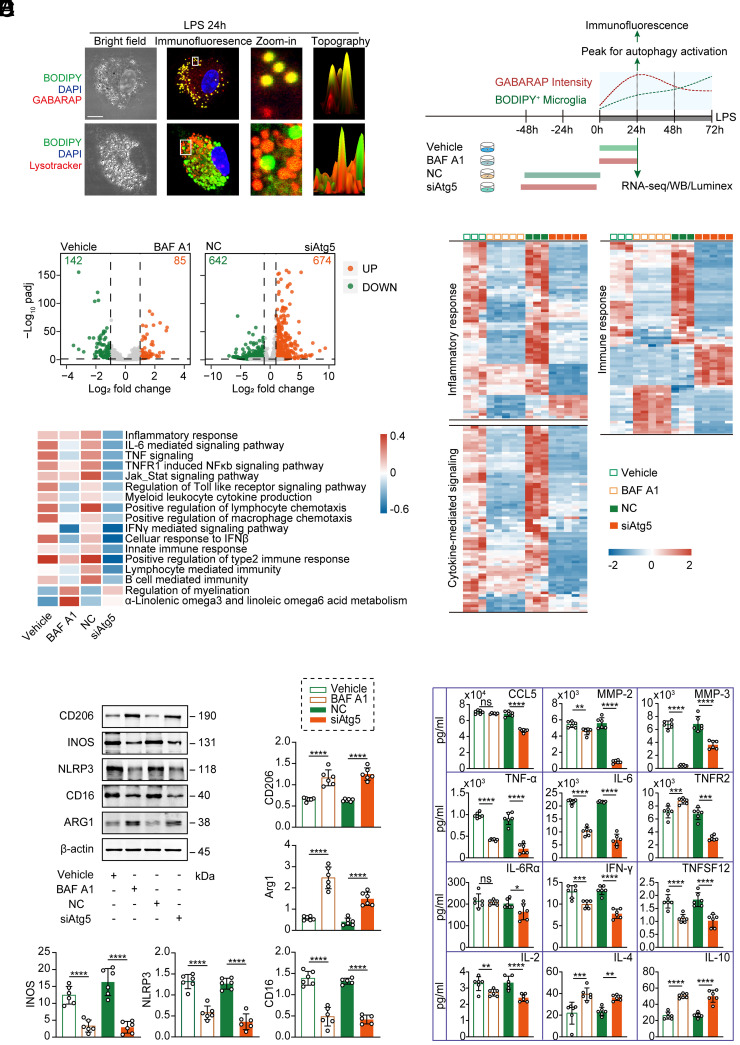
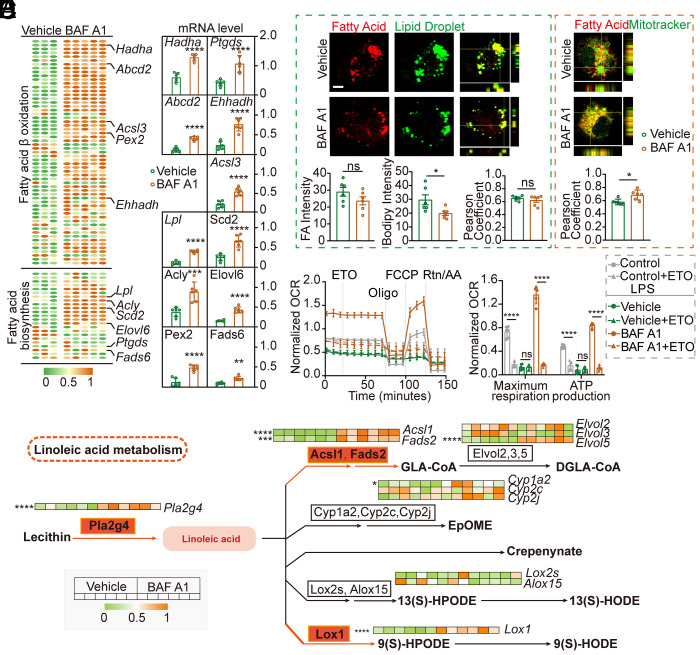
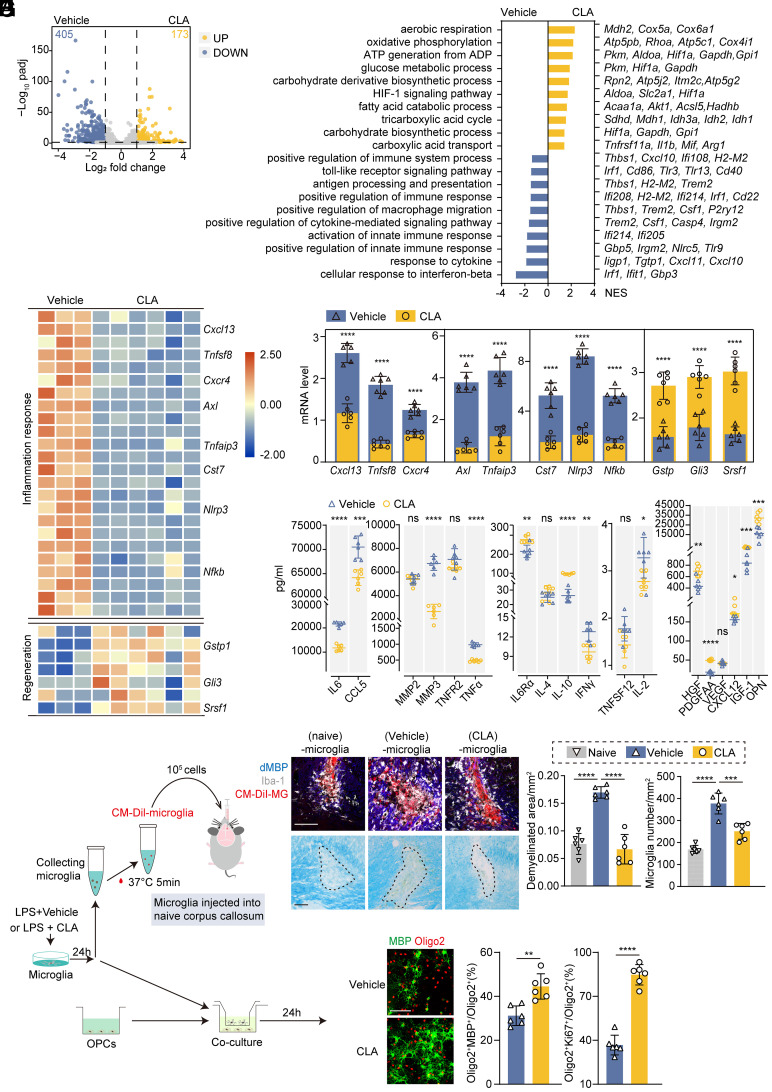
Microglia play a critical role in the clearance of myelin debris, thereby ensuring functional recovery from neural injury. Here, using mouse model of demyelination following two-point LPC injection, we show that the microglial autophagic-lysosomal pathway becomes overactivated in response to severe demyelination, leading to lipid droplet accumulation and a dysfunctional and pro-inflammatory microglial state, and finally failed myelin debris clearance and spatial learning deficits. Data from genetic approaches and pharmacological modulations, via microglial Atg5 deficient mice and intraventricular BAF A1 administration, respectively, demonstrate that staged suppression of excessive autophagic-lysosomal activation in microglia, but not sustained inhibition, results in better myelin debris degradation and exerts protective effects against demyelination. Combined multi-omics results in vitro further showed that enhanced lipid metabolism, especially the activation of the linoleic acid pathway, underlies this protective effect. Supplementation with conjugated linoleic acid (CLA), both in vivo and in vitro, could mimic these effects, including attenuating inflammation and restoring microglial pro-regenerative properties, finally resulting in better recovery from demyelination injuries and improved spatial learning function, by activating the peroxisome proliferator-activated receptor (PPAR-γ) pathway. Therefore, we propose that pharmacological inhibition targeting microglial autophagic-lysosomal overactivation or supplementation with CLA could represent a potential therapeutic strategy in demyelinated disorders.

Keywords: autophagic–lysosomal pathway; conjugated linoleic acid; demyelination; lipid metabolism; microglia.


Conflict of interest statement

The authors declare no competing interest.

Figures

Fig. 1.
Fig. 1.
Microglia experienced autophagic-lysosomal activation and LD accumulation as demyelination progressed. (A) Experimental schematic of the two-point LPC injection model. (B) Representative images of LFB staining and corpus callosum staining for Iba-1 (microglia), dMBP (myelin debris), and CD68 (lysosome). (Scale bar, 200 μm for LFB staining and 20 μm for immunofluorescent images.) (C) Quantification of the demyelinated area and the number of Iba-1+ microglia. n = 6 mice per group, n = 20 to 30 cells per mouse. Data are expressed as mean ± SD, ***P < 0.001, and ****P < 0.0001 vs. the sham group, one-way ANOVA with Bonferroni’s post hoc test. (D) 3D reconstructions of Iba-1+ microglia and average surface area, solidity, and circularity of cells. n = 6 mice per group. Data are expressed as mean ± SD, *P < 0.05, **P < 0.01, ***P < 0.001, and ****P < 0.0001 vs. the sham group, one-way ANOVA with Bonferroni’s post hoc test. (Scale bar, 10 μm.) (E) Representative images of the corpus callosum stained for Iba-1 (microglia), dMBP (myelin debris), CD68 (lysosomes), and BODIPY (LD). The Right panels show z-sections of debris-engulfing and lipid droplet-accumulated microglia. Quantification of BODIPY+ lipid droplet mean fluorescence intensity (MFI) in Iba-1+ microglia. n = 6 mice per group, n = 60 to 70 cells per mouse. (Scale bar, 5 μm.) (F) Electron microscopic images of microglia from the corpus callosum at 28 dpi. (Scale bar, 2 μm.) Ly, lysosome; LD, lipid droplet. (G) Representative images of the corpus callosum stained with Iba-1, Lamp1, and Lipin1 at 28 dpi. (Scale bar, 50 μm.) (H) Experimental design for cell sorting of microglia from lesions. Representative images of the corpus callosum stained for Iba-1, LC3, and BODIPY. (Scale bar, 5 μm.) (I) Representative immunoblots and quantification of P62, Beclin-1, and LC3II/I ratio in sorted microglia from demyelinated lesions. n = 6 mice per group. Data are expressed as mean ± SD, one-way ANOVA with Bonferroni’s post hoc test; ns not significant, **P < 0.01, ***P < 0.001, ****P < 0.0001 vs. the sham group; #P < 0.05, ##P < 0.01, ####P < 0.0001. (J) Quantitative RT-PCR analysis of sorted microglia from demyelinated lesions induced by two-point LPC injection. Each square represents data obtained from one mouse. n = 4 mice per group. Numerical data with statistics are shown in SI Appendix, Table S1.
Fig. 2.
Fig. 2.
Staged inhibition of autophagy activation led to less lipid droplet accumulation and smaller demyelinated lesions. (A) Schematic representing the experimental strategy in microglia-specific Atg5 deficient mice and wild-type mice receiving BAF A1. For transient and continuous inhibition of autophagy, micro-osmotic pumps were applied for the intracerebroventricular administration of BAF A1 (4 nmol/kg/d) for 5 d and 28 d, respectively. (B) Representative images of LFB staining and quantification of demyelinated area. n = 6 mice per group. (Scale bar, 200 μm.) Data are expressed as mean ± SD, two-way ANOVA with Bonferroni’s post hoc test; ****P < 0.0001 represented transient inhibition group vs. vehicle group, ††††P < 0.0001 represented continuous inhibition group vs. vehicle group; #P < 0.05 and ####P < 0.0001 represented continuous inhibition group vs. transient inhibition group. ‡P < 0.05 and ‡‡‡‡P < 0.0001 for Atg5 fl/fl vs. Atg5 cKO group. (C) Electron microscope images of corpus callosum at 28 dpi and quantification of g-ratios, demyelinated axon numbers. n = 4 mice per group. Data are expressed as mean ± SD, one-way ANOVA with Bonferroni’s post hoc test; **P < 0.01, ***P < 0.001, ****P < 0.0001. (Scale bar, 1 μm.) (D) Representative images of corpus callosum stained for Iba-1+ microglia, BODIPY+ LD, Mac2+ phagocytosis, quantification of BODIPY+ lipid droplet area normalized to lesion area. n = 6 mice per group. Data are expressed as mean ± SD, two-way ANOVA with Bonferroni’s post hoc test; *P < 0.05, and ****P < 0.0001 represented vehicle vs. BAF A1 group; ###P < 0.001 and ####P < 0.0001 represented Atg5 fl/fl vs. Atg5 cKO group. (Scale bar, 100 μm (Left) and 20 μm (Right).)
Fig. 3.
Fig. 3.
Inhibition of microglial autophagy attenuated inflammation and exhibited pro-regenerative properties in vitro. (A) Time course of autophagy activation and lipid droplet accumulation in LPS-stimulated primary microglia with different treatment paradigms. Representative images of primary microglia (treated with LPS for 24 h) staining for BODIPY (green), GABARAP/Lysotracker (red), and DAPI (blue) (Left). Schematic paradigm (Right). (Scale bar, 10 μm.) (B) Volcano plot of LPS-stimulated microglia with or without BAF A1 treatment/Atg5 siRNA transfection (|log2FC| > 1, FDR < 0.05). (C) Heatmaps depicting transcriptional profiles of selected BPs (“inflammatory responses,” “cytokine-mediated signaling,” and “immune response”). Numerical data with statistics are shown in SI Appendix, Table S2. (D) Heatmap showing the differences in biological processes by GSVA enrichment scores across the different groups. (E) Representative immunoblots and quantification of the classic microglial markers CD206, iNOS, NLRP3, CD16, Arg-1, and β-actin. n = 6 independent replicates. Data are expressed as the mean ± SD, one-way ANOVA with Bonferroni’s post hoc test; ****P < 0.0001. (F) Quantification of pro-inflammatory and anti-inflammatory cytokines and chemokines using the Luminex assay. n = 6 independent replicates. Data are expressed as the mean ± SD, one-way ANOVA with Bonferroni’s post hoc test; ns, not significant; *P < 0.05, **P < 0.01, ***P < 0.001, ****P < 0.0001.
Fig. 4.
Fig. 4.
BAF A1 administration enhanced anabolic and catabolic metabolism of fatty acid in LPS-stimulated microglia. (A) Heatmap depicting the transcriptional profiles of fatty acid biosynthesis and β-oxidation pathways. Numerical data with statistics are shown in SI Appendix, Table S3. (B) Quantification of selective genes by qPCR analysis. n = 6 independent replicates. Data are expressed as mean ± SD, one-way ANOVA with Bonferroni’s post hoc test; **P < 0.01, ****P < 0.0001 vs. vehicle group. (C) Representative images of LD or mitochondria co-stained with fatty acids (FA) in LPS-stimulated microglia with or without BAF A1 treatment. Quantification of the intensity of LD and FA per cell and the colocalization of LD with FA and mitochondria with FA are shown as Pearson coefficients. n = 6 independent replicates. Data are expressed as mean ± SD, one-way ANOVA with Bonferroni’s post hoc test; ns not significant, *P < 0.05, vs. vehicle group. (Scale bar, 10 μm.) (D) OCR per well measured over time using a Seahorse XFe24 analyzer, n = 5 to 6 independent replicates. Data are expressed as the mean ± SD. (E) Summary data displaying maximal respiration and adenosine triphosphate (ATP) production per well with pre-injection of ETO relative to vehicle controls in LPS-stimulated microglia with or without BAF A1 treatment. Maximal respiration = (maximum rate measurement after carbonyl cyanide-p-trifluoromethox- yphenyl-hydrazon (FCCP) injection) – (minimum rate measurement after rotenone/antimycin A injection); ATP production = (last rate measurement before oligomycin injection) – (minimum rate measurement after oligomycin injection). n = 5 to 6 independent replicates. Data are expressed as the mean ± SD, unpaired t test; ****P < 0.0001. (F) Network analysis combining mass spectrometry and RNA-seq data highlights the differences between LPS-stimulated microglia with or without BAF A1 treatment. Enzyme-encoding mRNAs and metabolites down-regulated or up-regulated in BAF A1-treated cells are indicated by green or red nodes and connectors, respectively. Heatmap depicting transcriptional changes in genes related to selective enzymes. n = 6 independent replicates, one-way ANOVA with Bonferroni’s post hoc test; *P < 0.05, ***P < 0.001, ****P < 0.0001. Numerical data with statistics are shown in SI Appendix, Table S5.
Fig. 5.
Fig. 5.
CLA administration ameliorated LPS-stimulated microglial inflammation and facilitated OPCs regeneration. (A) Volcano plot of LPS-stimulated microglia with or without CLA treatment showing 173 down-regulated (blue) and 405 up-regulated (yellow) DEGs (|log2FC| > 1, FDR < 0.05). (B) Top up-regulated and down-regulated pathways with featured genes in LPS-stimulated microglia with (Right) and without (Left) CLA. (C and D) Heatmap showing genes linked to inflammation and pro-regenerative properties under LPS stimulation with or without CLA treatment (C) and individual dot plots of selected genes measured by qPCR (D). n = 6 independent replicates. Data are expressed as mean ± SD, one-way ANOVA with Bonferroni’s post hoc test; ****P < 0.0001 vs. the vehicle group. Numerical data with statistics are shown in SI Appendix, Table S7. (E) Quantification of secretory cytokines and chemokines as measured using Luminex. n = 6 independent replicates. Data are expressed as mean ± SD, one-way ANOVA with Bonferroni’s post hoc test; ns not significant, *P < 0.05, **P < 0.01, ***P < 0.001, ****P < 0.0001 vs. the vehicle group. (F) Schematic depicting LPS-stimulated microglia with or without CLA treatment injected into the naïve corpus callosum and co-cultured with OPCs. (G) Representative images of the corpus callosum stained with dMBP, Iba-1, CM-Dil-microglia, and LFB. Quantification of the demyelinated areas. n = 6 mice per group. One-way ANOVA with Bonferroni’s post hoc test; ***P < 0.001, ****P < 0.0001. (Scale bar, 100 μm.) (H) Representative images of MBP (mature oligodendrocytes) and Olig2 (oligodendrocytes). MBP+ Olig2+ and Ki67+ Olig2+ cells were quantified as percentages of the total Oligo2+ cells. n = 6 independent replicates. Data are expressed as the mean ± SD, one-way ANOVA with Bonferroni’s post hoc test; **P < 0.01, ****P < 0.0001. (Scale bar, 100 μm.)
Fig. 6.
Fig. 6.
CLA supplementation alleviated LPC induced demyelination and neurological deficits. (A) Schematic depicting the experimental strategy for CLA supplementation in mice with a two-point LPC injection. (B) Cognitive function was evaluated using the Morris water maze. Representative images represent the swim paths. n = 8 mice per group. Data are expressed as mean ± SD, two-way repeated measure ANOVA for acquisition trial analysis, and unpaired t test for probe trial analysis; P = 0.0014, ***P < 0.001, ns, not significant vs. the vehicle group. (C) Representative images and quantification of LFB staining. n = 6 mice per group. Data are expressed as mean ± SD, unpaired t test; ****P < 0.0001 vs. the vehicle group. (Scale bar, 200 μm.) (D) Electron microscopy images of the corpus callosum with or without CLA supplementation at 28 dpi. Asterisks mark demyelinated axons. Quantification of g-ratios. n = 6 mice per group, n = 40 axons per mouse. Data are expressed as mean ± SD, unpaired t test; ****P < 0.0001 vs. the vehicle group. (Scale bar, 2 μm.) (E) Representative images and quantification of the corpus callosum stained for Olig2 (total oligodendrocytes), APC (mature oligodendrocytes), and BrdU (proliferative marker). n = 6 mice per group. Data are expressed as mean ± SD, One-way ANOVA with Bonferroni’s post hoc test; *P < 0.05, **P < 0.01. (Scale bar, 50 μm.) (F) Representative images of the corpus callosum stained for Iba-1 (microglia), Mac2 (phagocytosis), BODIPY (LD), and dMBP (myelin debris). Quantification of the BODIPY+ and dMBP+ areas. n = 6 mice per group. Data are expressed as mean ± SD, unpaired t test; ***P < 0.001 vs. the vehicle group. (Scale bars, 100 μm (Left) and 20 μm (Right).)
Fig. 7.
Fig. 7.
CLA supplementation promoted microglial pro-remyelination properties via the PPAR-γ pathway. (A) Heatmap representing genes related to the PPAR-γ pathway under LPS stimulation with or without CLA treatment and individual dot plots of mRNA levels of selected genes. n = 6 independent replicates. Data are expressed as the mean ± SD, one-way ANOVA with Bonferroni’s post hoc test; ****P < 0.0001. Numerical data with statistics are shown in SI Appendix, Table S8. (B) Schematic depicting LPS-stimulated CLA-treated microglia treated with vehicle, T0070907 (PPAR-γ inhibitor), NC or Atg5 siRNA. Microglia with different treatments were co-cultured with OPCs for an additional 3 d. (C) Representative immunoblots and quantification of CD206, iNOS, NLRP3, CD16, and Arg-1 in the microglia. n = 6 independent replicates. Data are expressed as the mean ± SD, one-way ANOVA with Bonferroni’s post hoc test; **P < 0.01, ****P < 0.0001. (D) Representative images of MBP (mature oligodendrocytes) and Oligo2 (oligodendrocytes). MBP+ Oligo2+ and Ki67+ Oligo2+ cells were quantified as percentages of the total Olig2+ cells. n = 6 independent replicates. Data are expressed as the mean ± SD, one-way ANOVA with Bonferroni’s post hoc test; ***P < 0.001, ****P < 0.0001. (Scale bar, 100 μm.) (E) Schematic depicting the experimental design for CLA treatment in microglia-specific PPAR-γ-deficient mice (Cx3cr1CreER+/−PPAR-γfl/fl, PPAR-γ cKO) or their littermate controls (PPAR-γfl/fl) and sample collection. (F and G) Representative images of LFB staining and quantification of demyelinated areas by LFB staining. Representative images and quantification of corpus callosum stained for Iba-1 (microglia), dMBP (myelin debris), and CD68 (lysosomes). n = 6 mice per group. Data are expressed as the mean ± SD, unpaired t test; ***P < 0.001, ****P < 0.0001. (Scale bars, 200 μm (F) and 20 μm (G).)

Similar articles

Cited by

References

    1. Bogie J. F. J., et al. , Stearoyl-CoA desaturase-1 impairs the reparative properties of macrophages and microglia in the brain. J. Exp. Med. 217, e20191660 (2020). - PMC - PubMed
    1. Zrzavy T., et al. , Loss of “homeostatic” microglia and patterns of their activation in active multiple sclerosis. Brain 140, 1900–1913 (2017). - PMC - PubMed
    1. Ballabio A., Bonifacino J. S., Lysosomes as dynamic regulators of cell and organismal homeostasis. Nat. Rev. Mol. Cell Biol. 21, 101–118 (2019). - PubMed
    1. Berglund R., et al. , Microglial autophagy-associated phagocytosis is essential for recovery from neuroinflammation. Sci. Immunol. 5, eabb5077 (2020). - PubMed
    1. van Eijk M., Aerts J., The unique phenotype of lipid-laden macrophages. Int. J. Mol. Sci. 22, 4039 (2021). - PMC - PubMed

Publication types