. 2023 Jan 3;120(1):e2203779120.
doi: 10.1073/pnas.2203779120. Epub 2022 Dec 28.

Bone marrow-derived IGF-1 orchestrates maintenance and regeneration of the adult skeleton

Affiliations

Bone marrow-derived IGF-1 orchestrates maintenance and regeneration of the adult skeleton

Jianfang Wang et al. Proc Natl Acad Sci U S A. .

Abstract

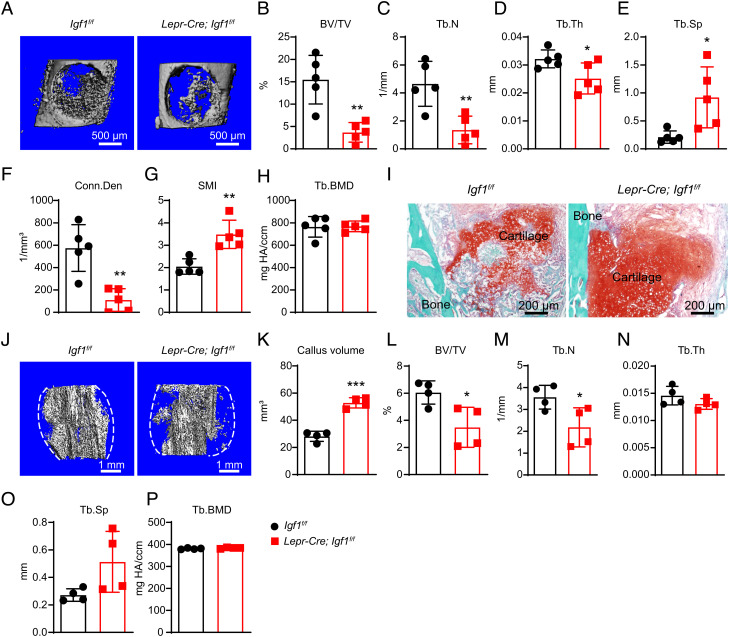
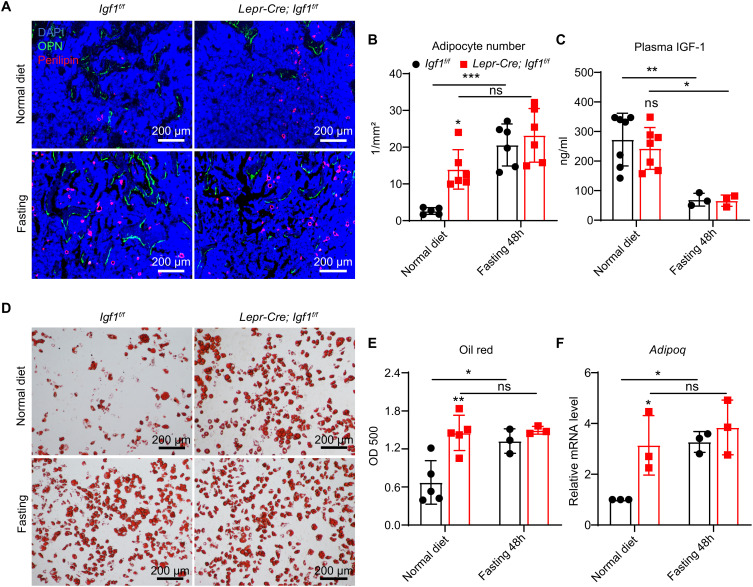
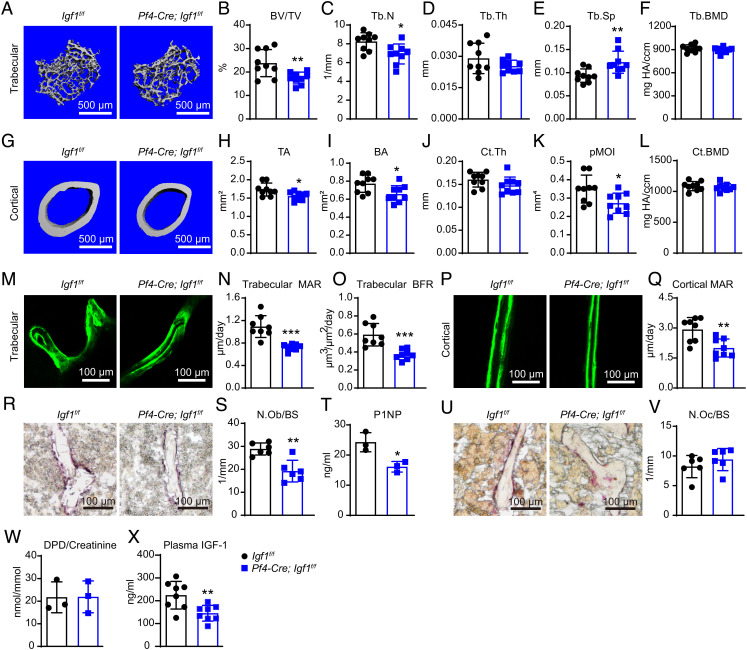
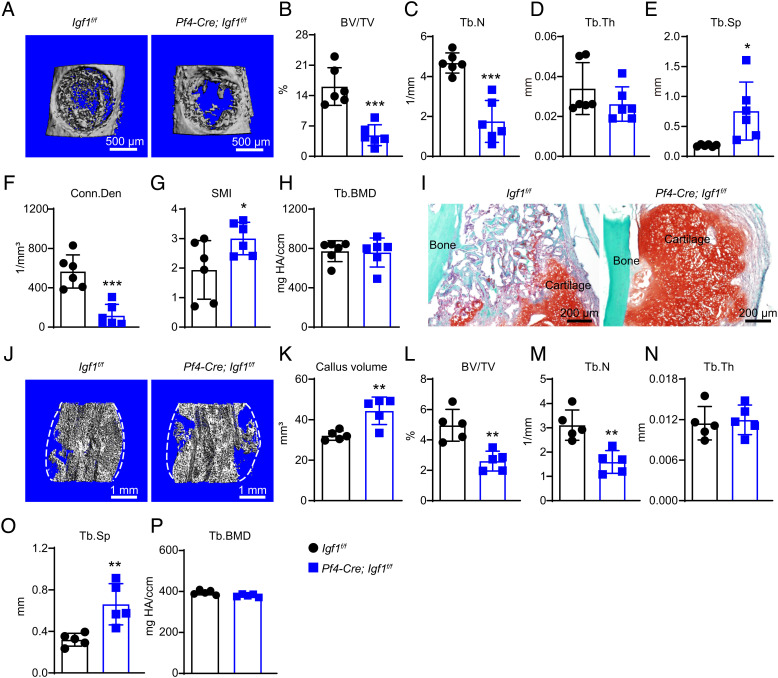
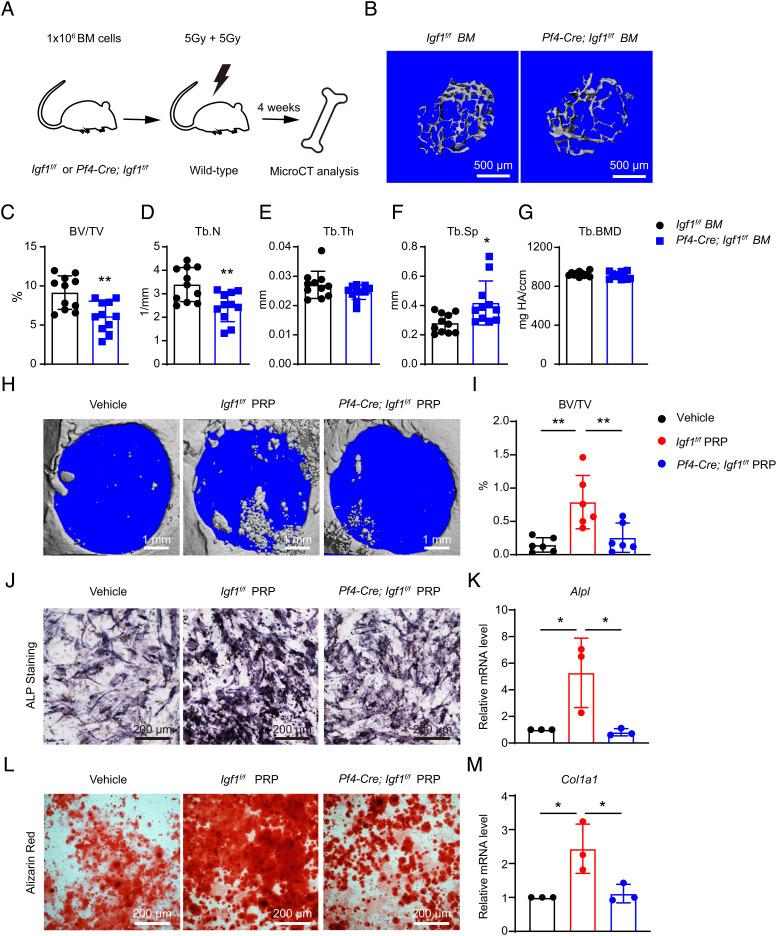
Insulin-like growth factor I (IGF-1) is a key regulator of tissue growth and development in response to growth hormone stimulation. In the skeletal system, IGF-1 derived from osteoblasts and chondrocytes are essential for normal bone development; however, whether bone marrow (BM)-resident cells provide distinct sources of IGF-1 in the adult skeleton remains elusive. Here, we show that BM stromal cells (BMSCs) and megakaryocytes/platelets (MKs/PLTs) express the highest levels of IGF-1 in adult long bones. Deletion of Igf1 from BMSCs by Lepr-Cre leads to decreased bone formation, impaired bone regeneration, and increased BM adipogenesis. Importantly, reduction of BMSC-derived IGF-1 contributes to fasting-induced marrow fat accumulation. In contrast, deletion of Igf1 from MKs/PLTs by Pf4-Cre leads to reduced bone formation and regeneration without affecting BM adipogenesis. To our surprise, MKs/PLTs are also an important source of systemic IGF-1. Platelet-rich plasma (PRP) from Pf4-Cre; Igf1f/fmice showed compromised osteogenic potential both in vivo and in vitro, suggesting that MK/PLT-derived IGF-1 underlies the therapeutic effects of PRP. Taken together, this study identifies BMSCs and MKs/PLTs as two important sources of IGF-1 that coordinate to maintain and regenerate the adult skeleton, highlighting reciprocal regulation between the hematopoietic and skeletal systems.

Keywords: IGF-1; adipogenesis; bone marrow; hematopoiesis; osteogenesis.


Conflict of interest statement

The authors declare no competing interest.

Figures

Fig. 1.
Fig. 1.
IGF-1 is highly expressed in BMSCs and MKs/PLTs. (A and B) Microarray (A) and qPCR (B) analyses of Igf1 expression in 8-wk-old long bones. WBM (Whole BM cells); BMSCs (CD45-Ter119CD31Scf-GFP+/LepR+); MKs/PLTs (CD41+); osteoblasts (OBs, CD45-Ter119CD31Col2.3-GFP+); endothelial cells (ECs, CD144+); myeloid (CD11b+Gr-1+); erythroid (Ter119+CD71+); B cells (B220+); T cells (CD3+) (n = 3 mice from three independent experiments). The statistical significance was assessed using one-way ANOVA with Dunnett's multiple comparisons test. Data represent mean ± SD (***P < 0.001). (C) Violin plots showing genes related to GH/IGF-1 axis in different cell clusters. Integrated analysis of Prrx-1-Cre- and Lepr-Cre-traced cells in 8-wk-old long bones was shown. (D) Heatmap showing genes related to GH/IGF-1 axis in Lepr-Cre-traced BMSCs under homeostatic and stress conditions. Young adult: 8-wk-old mice; Aging: 12-mo-old mice; Rosiglitazone diet: 10-wk-old mice on 20 g/kg rosiglitazone-containing chow for 5 wk; Irradiation: 8-wk-old sub-lethally irradiated (5 Gy) mice; Fracture: 8-wk-old fractured mice. (E) Pseudotime analysis within Lepr-Cre-traced osteogenic lineage cells under homeostatic and stress conditions. (F) Dynamic expression of genes related to GH/IGF-1 axis in osteogenic lineage cells along the differentiation trajectory.
Fig. 2.
Fig. 2.
Deletion of Igf1 from BMSCs impairs bone maintenance by reducing bone formation. (A) Representative microCT images of trabecular bone in the distal femur metaphysis of 12-wk-old male Lepr-Cre; Igf1f/f mice and littermate controls. (BF) MicroCT analysis of trabecular bone volume ratio (B), trabecular number (C), trabecular thickness (D), trabecular spacing (E), and trabecular bone mineral density (F) (n = 11 mice per genotype from at least three independent experiments). (G) Representative microCT images of cortical bone in the middle femur diaphysis of 12-wk-old male Lepr-Cre; Igf1f/f mice and littermate controls. (HL) MicroCT analysis of cortical total area (H), bone area (I), cortical thickness (J), pMOI (K), and cortical bone mineral density (L) (n = 11 mice per genotype from at least three independent experiments). (MQ) Calcein double labeling in trabecular and cortical bones. Representative trabecular (M) and cortical (O) images were shown, with quantifications of MAR (N and Q), BFR (O) (n = 8 mice per genotype from three independent experiments). (R and S) Alkaline phosphatase (ALP) staining of femur section and quantification of osteoblast number /bone surface from 12-wk-old male Lepr-Cre; Igf1f/f mice and littermate controls (n = 6 mice per genotype from three independent experiments). (T) ELISA measurement of plasma P1NP level (n = 7 mice per genotype from two independent experiments). (U and V) Tartrate-resistant acid phosphatase (TRAP) staining of femur section and quantification of osteoclast number /bone surface from 12-wk-old male Lepr-Cre; Igf1f/f mice and littermate controls (n = 6 mice per genotype from three independent experiments). (W) ELISA measurement of plasma urinary DPD levels. DPD level was normalized to urinary creatinine (n = 7 mice per genotype from two independent experiments). (X and Y) In vitro differentiation of BMSCs. Primary BMSCs were cultured from Lepr-Cre; Igf1f/f mice and littermate controls and subjected to osteogenic differentiation for 14 d. Alizarin red staining (S) and qPCR analysis of Col1a1 (T) were shown (n = 3 mice per genotype from three independent experiments). The statistical significance was assessed using two-tailed unpaired Student’s t test. Data represent mean ± SD (*P < 0.05, **P < 0.01).
Fig. 3.
Fig. 3.
Deletion of Igf1 from BMSCs impairs bone regeneration after injuries. (A) Representative microCT images of the middle femur diaphysis of 12-wk-old male Lepr-Cre; Igf1f/f mice and littermate controls 7 d after bone drilling. (BH) MicroCT analysis of trabecular bone volume ratio (B), trabecular number (C), trabecular thickness (D), trabecular spacing (E), connectivity density (F), SMI (G), and trabecular bone mineral density (H) in drilled bones (n = 5 mice per genotype from three independent experiments). (I) Representative safranin O/Fast Green images of the bone callus 14 d after mid-diaphyseal femur fracture. (JP) MicroCT analysis of the bone callus 14 d after mid-diaphyseal femur fracture. Representative images (J), callus volume (K), trabecular bone volume ratio (L), trabecular number (M), trabecular thickness (N), trabecular spacing (O), and trabecular bone mineral density (P) were shown (n = 5 mice per genotype from three independent experiments). The statistical significance was assessed using two-tailed unpaired Student’s t test. Data represent mean ± SD (*P < 0.05, **P < 0.01).
Fig. 4.
Fig. 4.
Deletion of Igf1 from BMSCs promotes BM adipogenesis that mimics fasting-induced marrow fat accumulation. (A) Representative immunofluorescent images of femur sections in 12-wk-old Lepr-Cre; Igf1f/f and control mice with or without 48-h fasting. Perilipin (red, adipocyte), osteopontin (green, bone), and DAPI (blue, nucleus) staining were shown. (B) Quantification of the number of BM adipocytes. The average number of adipocytes per image area at 4× magnification were quantified (n = 5 to 6 mice per group from two independent experiments). (C) ELISA measurement of plasma IGF-1 level in 12-wk-old Lepr-Cre; Igf1f/f and control mice with or without 48-h fasting (n = 3 to 7 mice per group from three independent experiments). (D and E) In vitro adipogenic differentiation. Primary BMSCs were cultured from mice treated as in (A), and subjected to in vitro adipogenic differentiation. Oil red O staining (D) was performed 7 d after differentiation, and quantified by optical density (OD) measurement at 500 nm (E) (n = 3 to 5 mice per group from two independent experiments). (F) qPCR of Adipoq in primary BMSCs treated as in (D) (n = 3 mice per group from two independent experiments). The statistical significance was assessed using two-way ANOVA with Tukey's multiple comparisons test. Data represent mean ± SD (*P < 0.05, **P < 0.01, ***P < 0.001).
Fig. 5.
Fig. 5.
Deletion of Igf1 from MKs/PLTs impairs bone maintenance by reducing bone formation. (A) Representative microCT images of trabecular bone in the distal femur metaphysis of 12-wk-old male Pf4-Cre; Igf1f/f mice and littermate controls. (BF) MicroCT analysis of trabecular bone volume ratio (B), trabecular number (C), trabecular thickness (D), trabecular spacing (E), and trabecular bone mineral density (F) (n = 9 mice per genotype from at least three independent experiments). (G) Representative microCT images of cortical bone in the middle femur diaphysis of 12-wk-old male Pf4-Cre; Igf1f/f mice and littermate controls. (HL) MicroCT analysis of cortical total area (H), bone area (I), cortical thickness (J), pMOI (K), and cortical bone mineral density (L) (n = 9 mice per genotype from at least three independent experiments). (MQ) Calcein double labeling in trabecular and cortical bones. Representative trabecular (M) and cortical (P) images were shown, with quantifications of MAR (N and Q) and BFR (O) (n = 8 mice per genotype from three independent experiments). (R and S) ALP staining of femur section and quantification of osteoblast number /bone surface from 12-wk-old male Pf4-Cre; Igf1f/f mice and littermate controls (n = 6 mice per genotype from three independent experiments). (T) ELISA measurement of plasma P1NP levels (n = 3 mice per genotype). (U and V) TRAP staining of femur section and quantification of osteoclast number /bone surface from 12-wk-old male Pf4-Cre; Igf1f/f mice and littermate controls (n = 6 mice per genotype from three independent experiments). (W) ELISA measurement of plasma urinary DPD levels. DPD level was normalized to urinary creatinine (n = 3 mice per genotype). (X) ELISA measurement of plasma IGF-1 level (n = 8 mice per genotype). The statistical significance was assessed using two-tailed unpaired Student’s t test. Data represent mean ± SD (*< 0.05, **P < 0.01).
Fig. 6.
Fig. 6.
Deletion of Igf1 from MKs/PLTs impairs bone regeneration after injuries. (A) Representative microCT images of the middle femur diaphysis of 12-wk-old male Pf4-Cre; Igf1f/f mice and littermate controls 7 d after bone drilling. (BH) MicroCT analysis of trabecular bone volume ratio (B), trabecular number (C), trabecular thickness (D), trabecular spacing (E), connectivity density (F), SMI (G), and trabecular bone mineral density (H) in drilled bones (n = 6 mice per genotype from three independent experiments). (I) Representative safranin O/Fast Green images of the bone callus 14 d after mid-diaphyseal femur fracture. (JP) MicroCT analysis of the bone callus 14 d after mid-diaphyseal femur fracture. Representative images (J), callus volume (K), trabecular bone volume ratio (L), trabecular number (M), trabecular thickness (N), trabecular spacing (O), and trabecular bone mineral density (P) were shown (n = 5 mice per genotype from three independent experiments). The statistical significance was assessed using two-tailed unpaired Student’s t test. Data represent mean ± SD (*P < 0.05, **P < 0.01, ***P < 0.001).
Fig. 7.
Fig. 7.
Deletion of Igf1 from MKs/PLTs reduces trabecular bones after BM transplantation and compromises the therapeutic effects of PRP. (A) Schematic illustration of the BM transplantation experiment. One million whole BM cells from Pf4-Cre; Igf1f/f mice or littermate controls were transplanted into lethally irradiated wild-type recipients. The bone phenotypes were analyzed 4 wk after transplantation by microCT. (B) Representative microCT images of the trabecular bone in the distal femur metaphysis. (CG) MicroCT analysis of trabecular bone volume ratio (C), trabecular number (D), trabecular thickness (E), trabecular spacing (F), and trabecular bone mineral density (G) in recipient mice (n = 11 mice per genotype from two independent experiments). (H and I) In vivo treatment of the calvarial defects by PRP or vehicle control. Critical-size calvarial defects were treated with PRPs from Igf1f/f or Pf4-Cre; Igf1f/fmice, or vehicle control (saline), and analyzed 4 wk after treatment by microCT. Representative microCT images (H) and quantification of trabecular bone volume ratio (I) were shown (n = 6 mice per genotype from two independent experiments). (JM) In vitro osteogenic differentiation of wild-type BMSCs after PRP or vehicle treatment. PRPs from Igf1f/f or Pf4-Cre; Igf1f/fmice, or vehicle control (PBS), were added to the osteogenic medium (1:50). Alkaline phosphatase (ALP) staining was performed 7 d after differentiation (J), and quantified by qPCR of Alpl (K). Alizarin red staining was performed 14 d after differentiation (L), and quantified by qPCR of Col1a1 (M) (n = 3 independent experiments). The statistical significance was assessed using two-tailed unpaired Student’s t test (C–G), or one-way ANOVA with Tukey's multiple comparisons test (I, K, M). Data represent mean ± SD (*P < 0.05, **< 0.01).

References

    1. Yakar S., Werner H., Rosen C. J., Insulin-like growth factors: Actions on the skeleton. J. Mol. Endocrinol. 61, T115–T137 (2018). - PMC - PubMed
    1. Junnila R. K., et al. , The GH/IGF-1 axis in ageing and longevity. Nat. Rev. Endocrinol. 9, 366–376 (2013). - PMC - PubMed
    1. Powell-Braxton L., et al. , IGF-I is required for normal embryonic growth in mice. Genes Dev. 7, 2609–2617 (1993). - PubMed
    1. Liu J. P., et al. , Mice carrying null mutations of the genes encoding insulin-like growth factor I (Igf-1) and type 1 IGF receptor (Igf1r). Cell 75, 59–72 (1993). - PubMed
    1. Ohlsson C., et al. , The role of liver-derived insulin-like growth factor-I. Endocr. Rev. 30, 494–535 (2009). - PMC - PubMed

Publication types

Substances

LinkOut - more resources