. 2023 Apr 6;141(14):1737-1754.
doi: 10.1182/blood.2022016528.

HOXA9 forms a repressive complex with nuclear matrix-associated protein SAFB to maintain acute myeloid leukemia

Affiliations

HOXA9 forms a repressive complex with nuclear matrix-associated protein SAFB to maintain acute myeloid leukemia

Shuchi Agrawal-Singh et al. Blood. .

Abstract

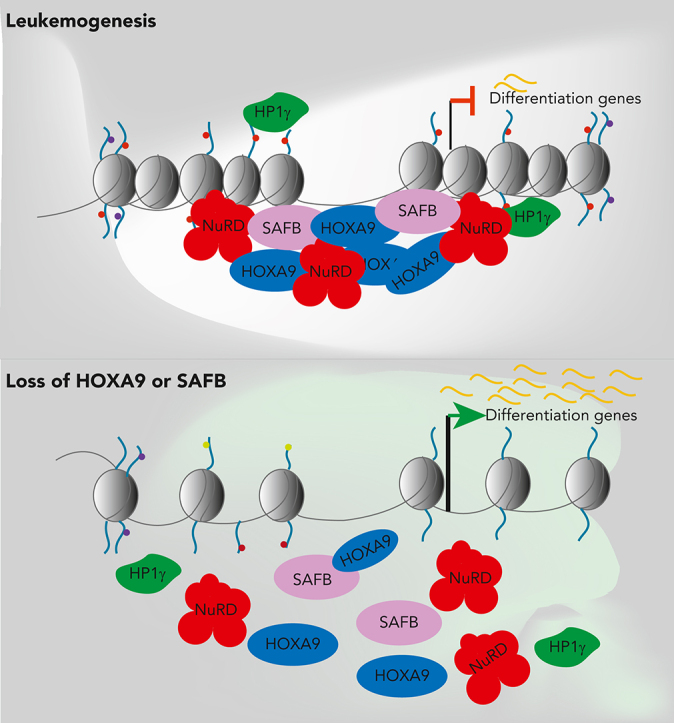
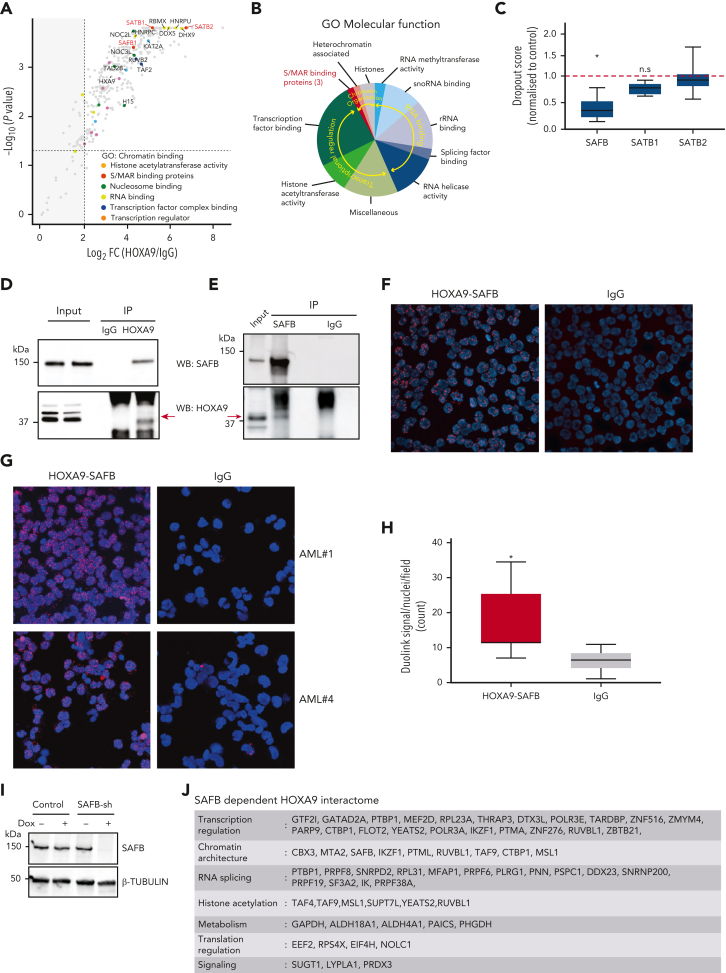
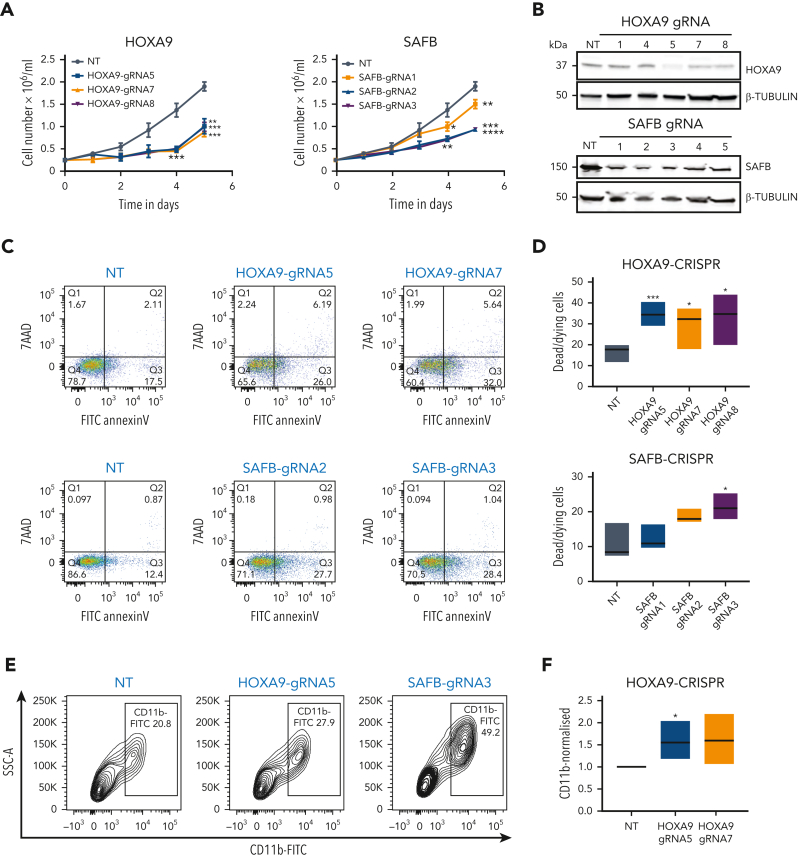
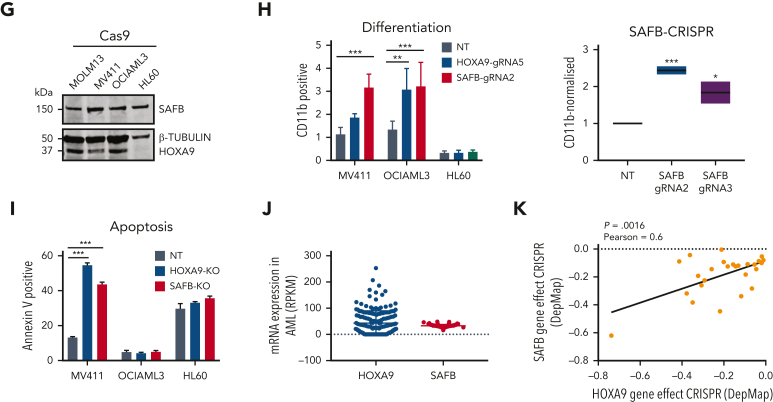
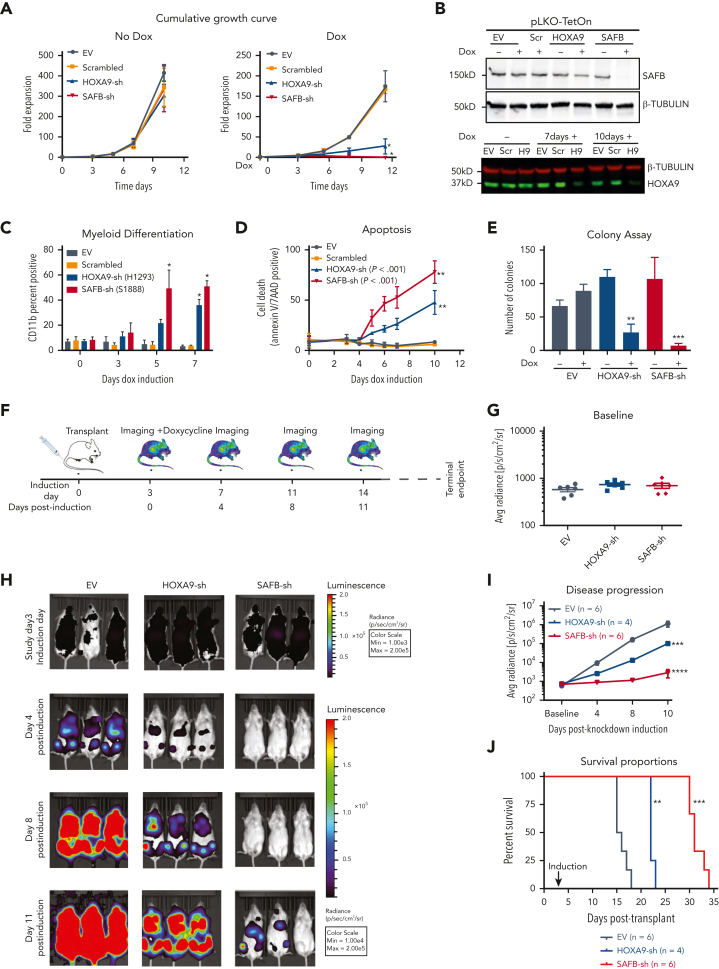
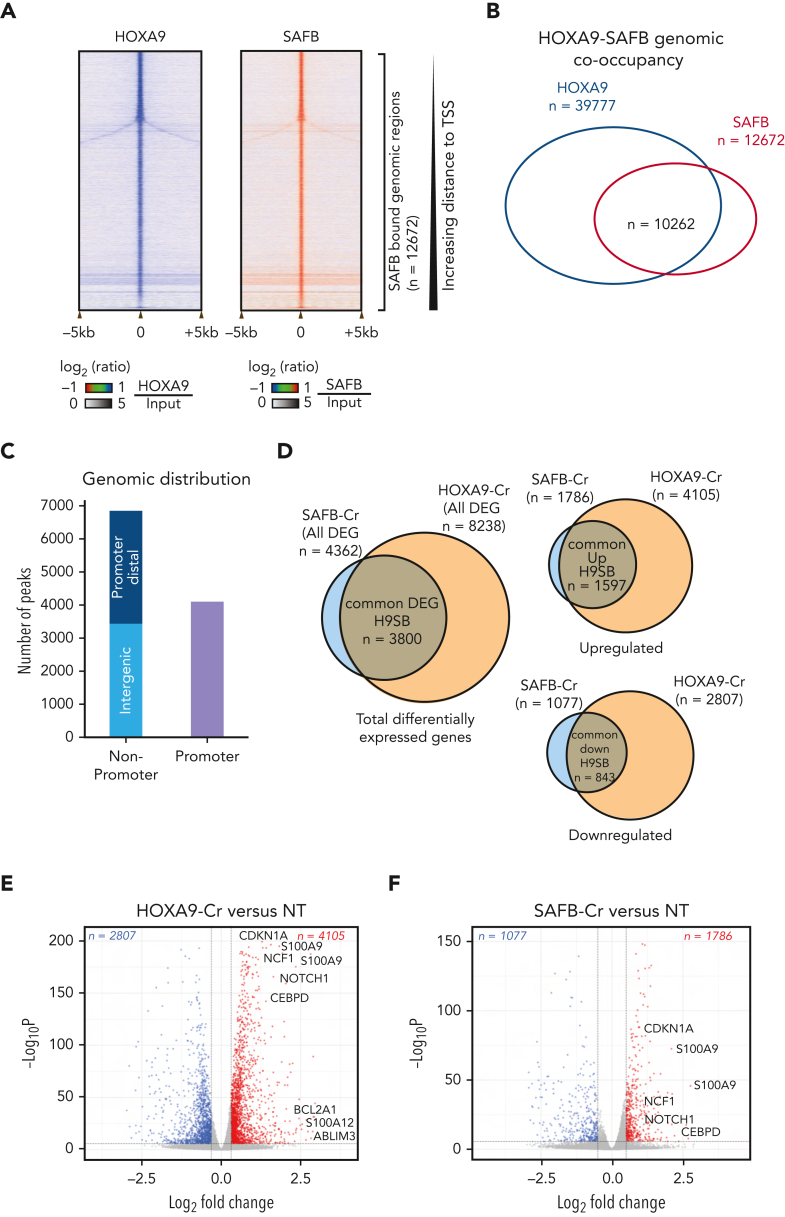
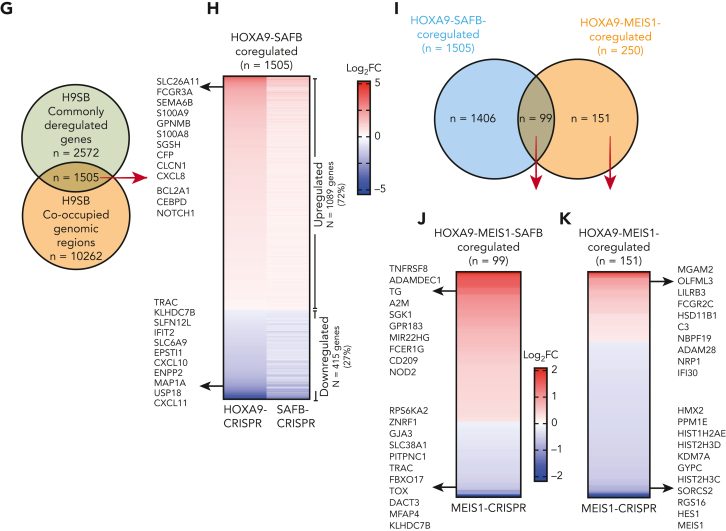
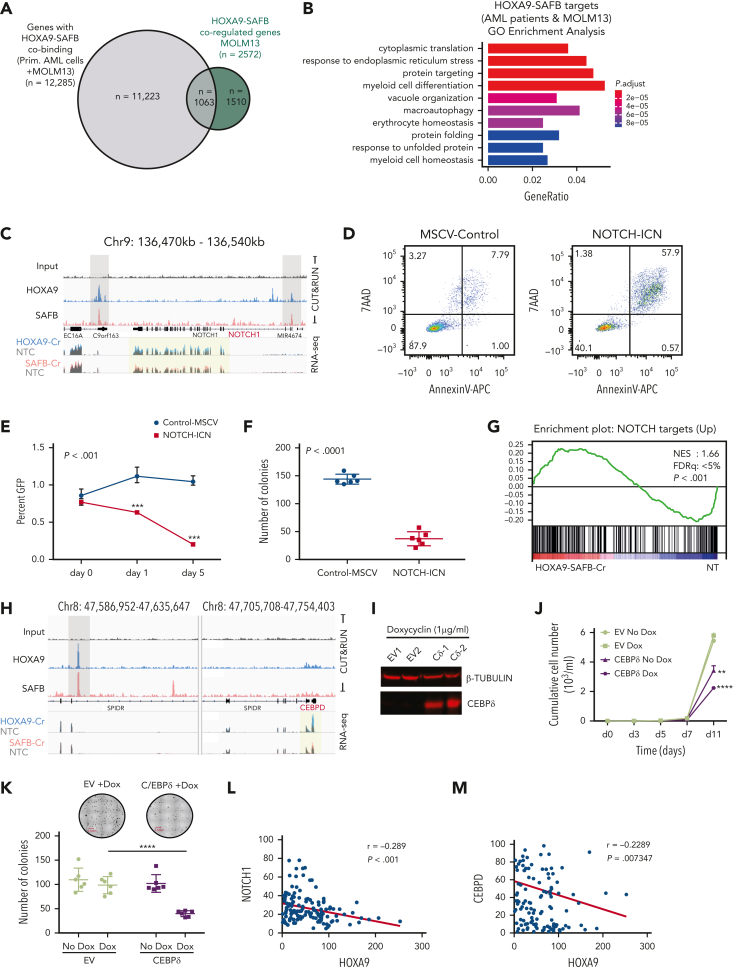
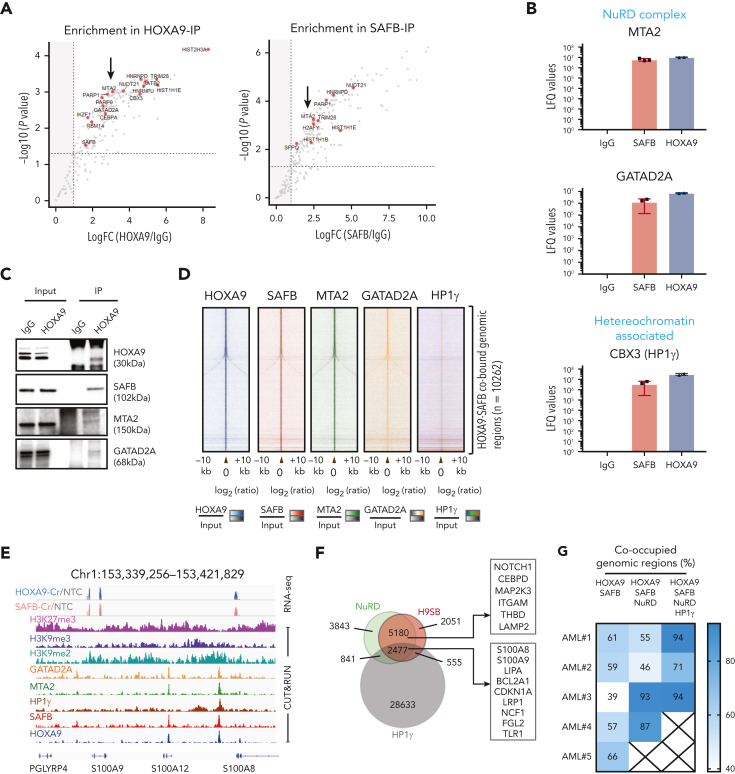
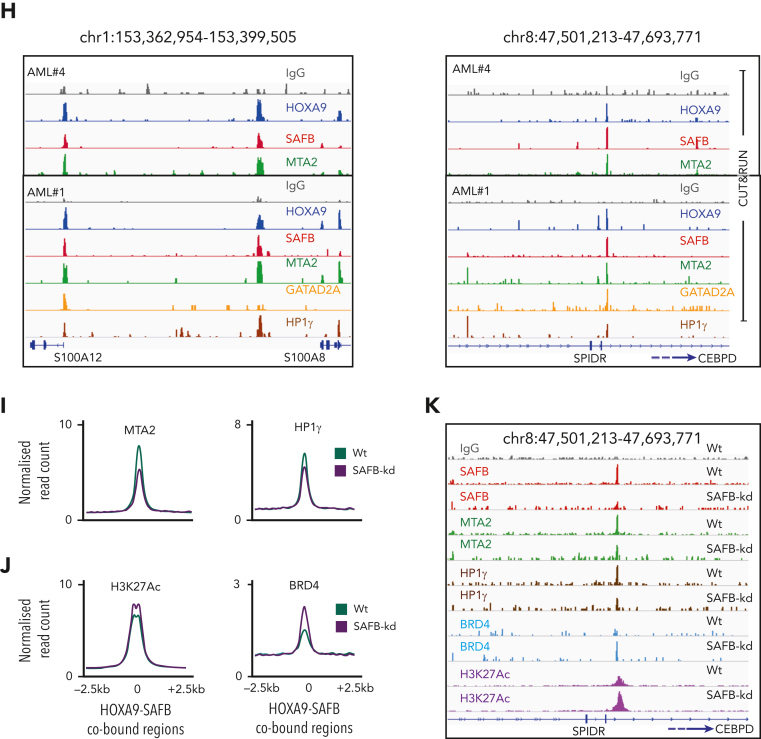
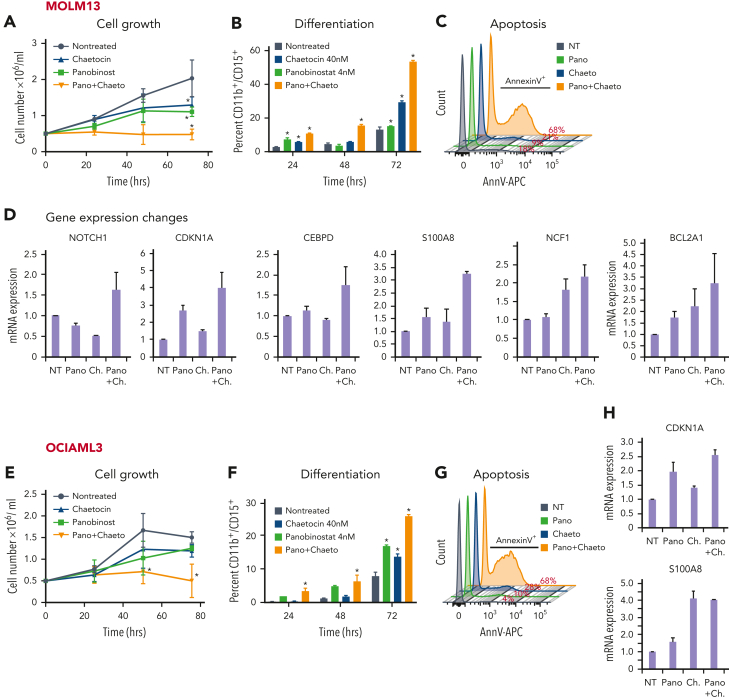
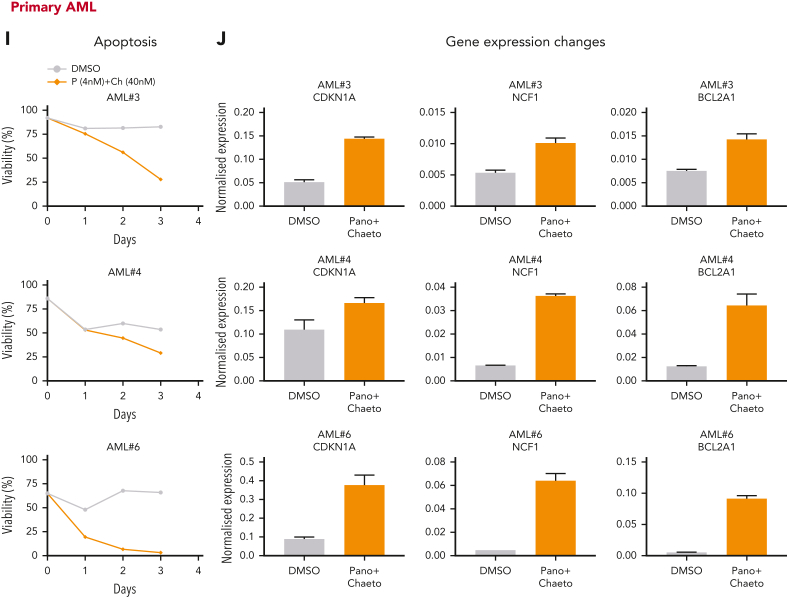
HOXA9 is commonly upregulated in acute myeloid leukemia (AML), in which it confers a poor prognosis. Characterizing the protein interactome of endogenous HOXA9 in human AML, we identified a chromatin complex of HOXA9 with the nuclear matrix attachment protein SAFB. SAFB perturbation phenocopied HOXA9 knockout to decrease AML proliferation, increase differentiation and apoptosis in vitro, and prolong survival in vivo. Integrated genomic, transcriptomic, and proteomic analyses further demonstrated that the HOXA9-SAFB (H9SB)-chromatin complex associates with nucleosome remodeling and histone deacetylase (NuRD) and HP1γ to repress the expression of factors associated with differentiation and apoptosis, including NOTCH1, CEBPδ, S100A8, and CDKN1A. Chemical or genetic perturbation of NuRD and HP1γ-associated catalytic activity also triggered differentiation, apoptosis, and the induction of these tumor-suppressive genes. Importantly, this mechanism is operative in other HOXA9-dependent AML genotypes. This mechanistic insight demonstrates the active HOXA9-dependent differentiation block as a potent mechanism of disease maintenance in AML that may be amenable to therapeutic intervention by targeting the H9SB interface and/or NuRD and HP1γ activity.


Conflict of interest statement

Conflict-of-interest disclosure: G.S.V. is a consultant to STRM.BIO and holds a research grant from AstraZeneca. The remaining authors declare no competing financial interests.

Figures

None
Supplementary figure 17: Schematic Model summarising our findings. HOXA9 nucleates a repressive complex with SAFB, which is required for the maintenance of the leukaemia state predominantly through the active repression of myeloid differentiation.
Figure 1.
Figure 1.
HOXA9 interacts with matrix binding (S/MAR) protein SAFB. (A) Volcano plot displaying the label-free mass spectrometry (MS) quantification of HOXA9 pulldown in MOLM13 cells. The plot shows log2 ratios of averaged peptide MS intensities between HOXA9-immunoprecipitation (IP) and control-IP (IgG) eluate samples (x-axis) plotted against the negative log10 P values (y-axis) calculated across the replicate data sets (1-tailed Student t test, n = 2 replicates). Maximum upper values were set for the x- and y-axis to accommodate all detected proteins in the plot. A dashed horizontal line marks P = .05. Vertical dashed line marks enrichment >2 log2 fold. Chromatin-binding proteins, pulled down by HOXA9 are colored as indicated, and selected protein names are shown. The full data set is given in supplemental Table 1. (B) Summary of proteins pulled down by HOXA9-IP, categorized based on the information of the molecular functions obtained from GO analyses; false discovery rate < 0.000001. (C) Box plot represents depletion of SAFB, SATB1, and SATB2 by CRISPR in 5 AML cell lines. Dropout score was calculated by normalizing to control cells (non-AML). (D) Western blot analyses validating the HOXA9 and SAFB interaction in MOLM13 cells via coimmunoprecipitation. HOXA9 is immunoprecipitated from MOLM13 cells and blotted for SAFB (top) and HOXA9 (bottom). (E) As in panel D, SAFB is immunoprecipitated from MOLM13 cells and blotted for HOXA9 (bottom) and SAFB (top). (F) Images showing PLA using Duolink in MOLM13 cells confirming the interaction between HOXA9 and SAFB in situ. Antibodies against HOXA9 (rabbit polyclonal antibodies) and SAFB (mouse monoclonal antibodies) were used. Rabbit and mouse IgGs were used as negative controls. (G) Images show PLA, using Duolink in primary AML cells from 2 individual patient samples. (H) Box and whisker plot shows cumulative differential signal (analyzed by Arivis software) as the number of Duolink-positive dots per nuclei across multiple patients (n = 7). Dots observed in IgG were also counted and plotted as a negative control. Statistical significance was calculated against IgG control using the paired t test (2-tailed, P < .05), ∗P < .05. (I) Representative western blot showing SAFB knockdown via doxycycline-inducible shRNAs in MOLM13 cells at 48 hours postinduction. β-Tubulin was used as a loading control. (J) Summary table of SAFB-dependent HOXA9 interacting proteins (n = 60); false discovery rate < 0.05. Full details are provided in supplemental Table 1. log2 FC, log2 fold change; ns., not significant; rRNA, ribosomal RNA; snoRNA, small nucleolar RNA.
Figure 2.
Figure 2.
SAFB phenocopies HOXA9 in leukemic cells. (A) Growth kinetics of MOLM13-Cas9 cells transduced with guide RNA (gRNA) (n = 3) targeting HOXA9 or SAFB. The data are shown as the average of biological replicates (n = 3) ± standard deviation (SD). Statistical significance was calculated against nontargeting control gRNA (nontreated [NT]) at time point days 4 and 5, using t test (2-tailed, P < .05), ∗P < .05, ∗∗P < .01, ∗∗∗P < .001, ∗∗∗∗P < .0001. (B) Western blot analyses showing the knockdown efficiency of HOXA9 and SAFB gRNAs in MOLM13 cells. β-tubulin is used as a loading control. (C) Apoptosis in MOLM13-Cas9 cells transduced with gRNA targeting HOXA9 (g5 and g7) or SAFB (g2 and g3) 5 days after transduction, as measured using annexin V and 7AAD staining. Plots are representative of 3 independent biological experiments. (D) Floating bar graphs summarizing results from the 3 independent experiments from apoptosis measurements using 3 gRNAs targeting HOXA9 (g5, g7, and g8) and SAFB (g1, g2, and g3) are shown. Statistical significance was calculated against NT using t test (2-tailed, P < .05), ∗P < .05, ∗∗P < .01, ∗∗∗P < .001. (E) Flow cytometric analyses of CD11b surface expression in MOLM13-Cas9 cells transduced with gRNA targeting HOXA9 (g5) or SAFB (g3). Contour plots shown here are representative of 3 independent biological replicates. (F) Floating bar graphs summarizing results from the 3 independent experiments from flow cytometric analyses of CD11b surface expression using 2 gRNAs targeting HOXA9 (g5 and g7) and SAFB (g2 and g3) are shown. Statistical significance was calculated against NT using t test (2-tailed, P < .05), ∗P < .05, ∗∗∗P < .001. (G) Western blot analyses showing expression of SAFB and HOXA9 in AML cell lines. β-Tubulin is used as a loading control. (H) CD11b surface expression in AML cell lines, 3 days after transduction, with gRNA targeting HOXA9 or SAFB (mean ± SD, n = 3). Statistical significance calculated using the 2-way analysis of variance (ANOVA) test, ∗∗P < .01. (I) Apoptosis measured via annexin V positivity in AML cell lines, 3 days after transduction, with gRNA targeting HOXA9 or SAFB (mean ± SD, n = 3). Statistical significance was calculated using the 2-way ANOVA test, ∗∗P < .01, ∗∗∗P < .001. (J) The mRNA expression of HOXA9 and SAFB in human AML primary samples (n = 179), AML The Cancer Genome Atlas (TCGA) data set. (K) Codependency between CRISPR knockout effects of HOXA9 and SAFB in AML cell lines (n = 26) from DepMap data set. Statistical significance was analyzed by linear regression at a 95% confidence interval (CI), P = .0016. The plot was generated using Prism. FITC, fluorescein isothiocyanate; KO, knockout.
Figure 2.
Figure 2.
SAFB phenocopies HOXA9 in leukemic cells. (A) Growth kinetics of MOLM13-Cas9 cells transduced with guide RNA (gRNA) (n = 3) targeting HOXA9 or SAFB. The data are shown as the average of biological replicates (n = 3) ± standard deviation (SD). Statistical significance was calculated against nontargeting control gRNA (nontreated [NT]) at time point days 4 and 5, using t test (2-tailed, P < .05), ∗P < .05, ∗∗P < .01, ∗∗∗P < .001, ∗∗∗∗P < .0001. (B) Western blot analyses showing the knockdown efficiency of HOXA9 and SAFB gRNAs in MOLM13 cells. β-tubulin is used as a loading control. (C) Apoptosis in MOLM13-Cas9 cells transduced with gRNA targeting HOXA9 (g5 and g7) or SAFB (g2 and g3) 5 days after transduction, as measured using annexin V and 7AAD staining. Plots are representative of 3 independent biological experiments. (D) Floating bar graphs summarizing results from the 3 independent experiments from apoptosis measurements using 3 gRNAs targeting HOXA9 (g5, g7, and g8) and SAFB (g1, g2, and g3) are shown. Statistical significance was calculated against NT using t test (2-tailed, P < .05), ∗P < .05, ∗∗P < .01, ∗∗∗P < .001. (E) Flow cytometric analyses of CD11b surface expression in MOLM13-Cas9 cells transduced with gRNA targeting HOXA9 (g5) or SAFB (g3). Contour plots shown here are representative of 3 independent biological replicates. (F) Floating bar graphs summarizing results from the 3 independent experiments from flow cytometric analyses of CD11b surface expression using 2 gRNAs targeting HOXA9 (g5 and g7) and SAFB (g2 and g3) are shown. Statistical significance was calculated against NT using t test (2-tailed, P < .05), ∗P < .05, ∗∗∗P < .001. (G) Western blot analyses showing expression of SAFB and HOXA9 in AML cell lines. β-Tubulin is used as a loading control. (H) CD11b surface expression in AML cell lines, 3 days after transduction, with gRNA targeting HOXA9 or SAFB (mean ± SD, n = 3). Statistical significance calculated using the 2-way analysis of variance (ANOVA) test, ∗∗P < .01. (I) Apoptosis measured via annexin V positivity in AML cell lines, 3 days after transduction, with gRNA targeting HOXA9 or SAFB (mean ± SD, n = 3). Statistical significance was calculated using the 2-way ANOVA test, ∗∗P < .01, ∗∗∗P < .001. (J) The mRNA expression of HOXA9 and SAFB in human AML primary samples (n = 179), AML The Cancer Genome Atlas (TCGA) data set. (K) Codependency between CRISPR knockout effects of HOXA9 and SAFB in AML cell lines (n = 26) from DepMap data set. Statistical significance was analyzed by linear regression at a 95% confidence interval (CI), P = .0016. The plot was generated using Prism. FITC, fluorescein isothiocyanate; KO, knockout.
Figure 3.
Figure 3.
HOXA9 and SAFB drive leukemic growth in vivo. (A) Cumulative growth of MOLM13 cells, lentivirally expressing shRNA against HOXA9 (blue), SAFB (red), scrambled sequence (orange), and empty vector (EV, gray). The data shown are the averages of biological replicates (n = 3) ± SD. Two-way ANOVA test, ∗P < .01 (B) Western blot analyses showing the knockdown efficiency of SAFB shRNAs after 48 hours after induction with doxycycline (Dox) in MOLM13 cells (top). β-Tubulin was used as a loading control. The HOXA9 knockdown after 7 and 10 days of doxycycline induction in MOLM13 cells is shown (bottom). (C) Myeloid differentiation accessed by CD11b surface expression via flow cytometry 5 days after induction with doxycycline. Data shown are the averages of biological replicates (n = 4) ± SD. Statistical significance calculated using the 2-way ANOVA test, ∗P < .01. (D) Percentage of annexin V– and 7AAD-positive MOLM13 cells 5 days after doxycycline treatment (1.5 μg/mL). Mean ± SD, n = 4. Two-way ANOVA test, ∗∗P < .001. (E) Colony-forming assay of MOLM13 cells expressing HOXA9- or SAFB-shRNA in the presence or absence of doxycycline (1.5 μg/mL). The bar graph shows the average value of 3 independent experiments ± SD, 2-way ANOVA test ∗∗P < .001, ∗∗∗P = .0001. (F) Schematic of xenotransplant experimental design. (G) Bioluminescent radiance 3 days after injection and before shRNA induction (baseline) in all 3 cohorts in all animals. (H) Serial bioluminescence imaging of mice that underwent transplantation with luciferase-labeled shRNA-expressing MOLM13 cells at indicated time points. (I) Bioluminescence at indicated time points shows disease progression over time. Statistical significance was calculated using the 2-way ANOVA with multiple comparisons (95% CI) against shEV, (shEV-HOXA9-sh at day 11, ∗∗∗P = .0004; shEV-SAFB-sh at day 11, ∗∗∗∗P < .0001). (J) Kaplan-Meier plot showing the survival of mice that received transplantations with MOLM13 cells expressing indicated shRNA. A log rank test was performed (∗∗P < .01, ∗∗∗P < .001). H9, HOXA9sh; Max, maximum; Min, minimum; Scr, scrambled.
Figure 4.
Figure 4.
H9SB together repress the transcription of myeloid differentiation genes. (A) Heat maps of HOXA9 or SAFB signal (relative to the input) from CUT&RUN experiments in MOLM13 cells. The y-axis represents individual regions centered at SAFB-bound genomic peaks (± 5 kilobases). Regions were sorted based on the increasing distance to TSS. The relationship between coloring and signal intensity is shown at the (bottom). (B) Schematic representation of overlapping regions occupied by HOXA9 and SAFB. (C) A bar graph showing the genomic distribution of H9SB cobound regions. (D) Venn diagram shows an overlap between total differentially regulated genes in HOXA9- and SAFB-CRISPR knockout cells. Data analyzed using 3 independent replicates at P < .001; for upregulated or downregulated genes, the threshold was set to 1 ± 0.2. In the hypergeometric test, P < .00001 for all overlaps. (E) RNA sequencing (RNA-seq) volcano plot showing genes downregulated (left, blue) and genes upregulated (right, red) in HOXA9-CRISPR compared with nontargeting control MOLM13 cells (n = 3 in both conditions). (F) Volcano plot representing RNA-seq in SAFB-CRISPR MOLM13 cells, as described in panel E. (G) The Venn diagram shows the overlap between genes commonly dysregulated on HOXA9 and SAFB perturbation in MOLM13 cells (green) and genes that are linked to H9SB co-occupied genomic regions (orange). List of these genes provided in supplemental Table 4. Hypergeometric test P = 2.438e-13. (H) Heat map showing expression log2 fold change in (HOXA9-Cr vs NT) or (SAFB-Cr vs NT) MOLM13 cells of those 1505 target genes. (I) Venn diagram shows the overlap between genes commonly regulated by H9SB in MOLM13 cells (blue) and genes that are regulated by HOXA9-MEIS1 in MOLM13 cells (orange). The overlap showed 99 genes shared by HOXA9/SAFB/MEIS1. A list of these genes is provided in supplemental Table 4. Hypergeometric test P < 3.782e-50. (J) Heat map showing expression log2 fold change in (MEIS1-Cr vs NT) MOLM13 cells of those 99 target genes (HOXA9/MEIS1/SAFB). (K) Heat map showing expression log2 fold change in (MEIS1-Cr vs NT) MOLM13 cells of those 151 target genes (HOXA9/MEIS1). (H,J,K) The relationship between the coloring and expression values is shown in the bar (right). The top 10 genes from up- or downregulated gene lists are shown in the plot. DEG, differentially expressed genes.
Figure 4.
Figure 4.
H9SB together repress the transcription of myeloid differentiation genes. (A) Heat maps of HOXA9 or SAFB signal (relative to the input) from CUT&RUN experiments in MOLM13 cells. The y-axis represents individual regions centered at SAFB-bound genomic peaks (± 5 kilobases). Regions were sorted based on the increasing distance to TSS. The relationship between coloring and signal intensity is shown at the (bottom). (B) Schematic representation of overlapping regions occupied by HOXA9 and SAFB. (C) A bar graph showing the genomic distribution of H9SB cobound regions. (D) Venn diagram shows an overlap between total differentially regulated genes in HOXA9- and SAFB-CRISPR knockout cells. Data analyzed using 3 independent replicates at P < .001; for upregulated or downregulated genes, the threshold was set to 1 ± 0.2. In the hypergeometric test, P < .00001 for all overlaps. (E) RNA sequencing (RNA-seq) volcano plot showing genes downregulated (left, blue) and genes upregulated (right, red) in HOXA9-CRISPR compared with nontargeting control MOLM13 cells (n = 3 in both conditions). (F) Volcano plot representing RNA-seq in SAFB-CRISPR MOLM13 cells, as described in panel E. (G) The Venn diagram shows the overlap between genes commonly dysregulated on HOXA9 and SAFB perturbation in MOLM13 cells (green) and genes that are linked to H9SB co-occupied genomic regions (orange). List of these genes provided in supplemental Table 4. Hypergeometric test P = 2.438e-13. (H) Heat map showing expression log2 fold change in (HOXA9-Cr vs NT) or (SAFB-Cr vs NT) MOLM13 cells of those 1505 target genes. (I) Venn diagram shows the overlap between genes commonly regulated by H9SB in MOLM13 cells (blue) and genes that are regulated by HOXA9-MEIS1 in MOLM13 cells (orange). The overlap showed 99 genes shared by HOXA9/SAFB/MEIS1. A list of these genes is provided in supplemental Table 4. Hypergeometric test P < 3.782e-50. (J) Heat map showing expression log2 fold change in (MEIS1-Cr vs NT) MOLM13 cells of those 99 target genes (HOXA9/MEIS1/SAFB). (K) Heat map showing expression log2 fold change in (MEIS1-Cr vs NT) MOLM13 cells of those 151 target genes (HOXA9/MEIS1). (H,J,K) The relationship between the coloring and expression values is shown in the bar (right). The top 10 genes from up- or downregulated gene lists are shown in the plot. DEG, differentially expressed genes.
Figure 5.
Figure 5.
NOTCH1 and CEBPδ are targets of the H9SB repressive complex. (A) The Venn diagram shows the overlap between genes commonly dysregulated upon HOXA9 and SAFB perturbation in MOLM13 cells (green) and genes that are linked to H9SB co-occupied genomic regions in primary AML cells and MOLM13 cell line (gray). A list of these genes is provided in supplemental Table 4. Hypergeometric test P < 2.115e-56. (B) GO analyses for target genes responded to HOXA9 or SAFB perturbation in MOLM13 cells and are common in primary AML cells and MOLM13 cells. The gene ratio is plotted on the x-axis. The colors on the bar represent the significant P value. A bar that represents the color code is shown on the right side of the plot. (C) Genome browser tracks demonstrate the enrichment of HOXA9 (blue) and SAFB (red) at the representative NOTCH1 locus in the Hg38 genome obtained from CUT&RUN sequencing in MOLM13 cells. The lower 2 tracks show the RNA-seq data and the expression of NOTCH1 to be upregulated in HOXA9-Cr (overlain blue) and SAFB-Cr (overlain red) compared with that in the NT control (gray). (D) Apoptosis in MOLM13-NOTCH1-ICN or MOLM13-MSCV-control cells was measured using annexin V– and 7AAD-positive cells by flow cytometry. Plots are representative of 3 biological independent replicates. (E) Competition assay between green fluorescent protein (GFP)–positive NOTCH1-ICN or murine stem cell virus (MSCV) control vector expressing MOLM13 cells. Equal numbers of GFP-positive cells were seeded at day 0, and the GFP percentage was measured 3 and 5 days later via flow cytometry. The values were normalized to the average percent from EV control and plotted as a line graph. Data shown are the averages of 3 biological replicates ± SD. (F) Colony-forming assay of GFP positive MOLM13-NOTCH1-ICN or MOLM13-MSCV-control cells. The bar graph shows the average value of 3 independent experiments ± SD. (G) Gene set enrichment analysis for H9SB commonly regulated genes (n = 2440) enriches for NOTCH signature. (H) Genome browser track representation of another exemplar locus (CEBPδ). Track details are as described for panel C. (I) Western blot showing the expression of CEBPδ in MOLM13 cells upon doxycycline treatment for 2 days. β-Tubulin was used as a loading control. (J) Cumulative cell growth of MOLM13 cells in CEBPδ overexpressing cells ± doxycycline. The experiment shown here is an average of 3 independent replicates obtained from 2 independent clones. Error bars represent ± SD. Statistical significance was calculated using 2-way ANOVA with multiple comparisons (95% CI) against EV-Dox, (EV-Dox-CEBPD-Dox at day 11, ∗∗∗∗P < .0001; EV-No Dox-CEBPD-No Dox at day 11, ∗∗P = .009). (K) Colony-forming assay of MOLM13-CEBPδ or MOLM13-control cells ± doxycycline. Photomicrographs showing representative plates (top). The scatter plot shows 3 independent experiments in duplicates, showing median ± SD (bottom). Statistical significance was calculated using 2-way ANOVA with multiple comparisons (95% CI) EV-Dox-CEBPD-Dox, ∗∗∗∗P < .0001. (L) Correlation between HOXA9 and NOTCH1 mRNA expression in human AML primary samples (n = 165, TCGA data set). (M) Correlation between HOXA9 and CEBPδ mRNA expression in human AML primary samples (n = 165, TCGA data set).
Figure 6.
Figure 6.
H9SB forms a repressive complex on chromatin with NuRD and HP1γ. (A) Volcano plot displaying the label-free quantitative MS result of HOXA9 and SAFB immunoprecipitation by RIME in MOLM13 cells. The plot shows the log2 ratio of averaged peptide MS intensities between HOXA9-IP vs IgG (left) or SAFB IP vs IgG (right) samples (x-axis), plotted against the negative log10P values (y-axis) calculated across the triplicate data sets. Student t test, n = 3 technical replicates. The dashed black line marks 1.5 log FC. Chromatin-associated proteins enriched in HOXA9 or SAFB pulldowns are marked as red dots. The complete list of SAFB-HOXA9 commonly enriched proteins is given in supplemental Table 1. (B) Bar graph displays the enrichment (label-free quantification [LFQ] values) of NuRD complex members (MTA2 and GATAD2A) or heterochromatin protein HP1γ in HOXA9 or SAFB or IgG immunoprecipitated samples. The data shown here are intensities from LFQ values obtained via mass spectrometric analyses of all replicates for IgG (n = 3), SAFB (n = 3), and HOXA9 (n = 2) pull downs, average ± SD. The program does not plot for zero values. (C) Western blots showing HOXA9 interaction with SAFB, MTA2, and GATAD2A via coimmunoprecipitation of endogenous HOXA9 pulldown in MOLM13 cells. (D) Heat maps of HOXA9, SAFB, MTA2, GATAD2A, and HP1γ signal (relative to Input) on H9SB co-occupied genomic regions measured by the CUT&RUN method in MOLM13 cells. The y-axis represents individual regions centered at H9SB-bound genomic regions (± 10 kilobases). Regions were sorted based on the increasing distance to TSS. The relationship between coloring and signal intensity is shown in the bar (bottom of the plot). (E) Exemplar loci demonstrating co-occurrence of NuRD, HP1γ, and repressive histone modifications with H9SB that correlated with derepression of the associated genes upon H9SB perturbation are shown in the genome browser track on selected loci S100A8 in the Hg38 genome, obtained from CUT&RUN sequencing in MOLM13 cells. The upper 2 tracks show the transcripts signal obtained from RNA-seq in MOLM13 cells after HOXA9 (blue) or SAFB (pink) perturbation. Transcripts signal for HOXA9- or SAFB-CRISPR samples are shown relative to the nontargeting control (gray). (F) Venn diagram showing the overlap of high-confident NuRD (GATAD2A + MTA2) and HP1γ peaks with H9SB-cobound genomic regions in MOLM13 cells. The numbers represent the genomic regions. The differentiation-associated target genes of the H9SB-repressive complex that were also upregulated upon H9SB perturbation are highlighted; the top box shows gene targets of HOXA9/SAFB/NuRD; the lower box shows gene targets of HOXA9/SAFB/NuRD/HP1γ. (G) Heat maps show genomic coenrichment of HOXA9 and SAFB in primary AML cells (n = 5). NuRD and HP1γ co-occupancy as determined by the intersection of NuRD (MTA2 and GATAD2A) and Hp1γ peaks with H9SB cobound peaks obtained in the same AML cells by CUT&RUN. Because of limited material availability, only selected antibodies were used for samples 4 and 5 for CUT&RUN experiments. The relationship between coloring and signal intensity is shown in the bar at the side of the plot. (H) The genome browser track shows the peak colocalization of HOXA9, SAFB, and NuRD complex (MTA2 and GATAD2A); HP1γ on selected loci S100A8 (left) and CEBPD/SPIDR (right) in the Hg38 genome, obtained from CUT&RUN sequencing in primary AML cells. (I) The average signal of MTA2 (left) and HP1γ (right) (intensity on the y-axis as normalized read count) centered at H9SB-cobound regions determined using CUT&RUN in MOLM13 cells with or without SAFB knockdown using shRNA. (J) The average signal of H3K27Ac (left) and BRD4 (right) (intensity on the y-axis as normalized read count) centered at H9SB-cobound regions determined using CUT&RUN in MOLM13 cells with or without SAFB knockdown using shRNA. (K) The genome browser track shows the reduction in the enrichment of NuRD complex (MTA2 and GATAD2A) and HP1γ after SFAB knockdown in MOLM13 cells. Lower tracks show the gained enrichment of BRD4 and H3K27Ac after SFAB knockdown in MOLM13 cells. Selected loci CEBPD/SPIDR in the Hg38 genome, the signal obtained from CUT&RUN sequencing.
Figure 6.
Figure 6.
H9SB forms a repressive complex on chromatin with NuRD and HP1γ. (A) Volcano plot displaying the label-free quantitative MS result of HOXA9 and SAFB immunoprecipitation by RIME in MOLM13 cells. The plot shows the log2 ratio of averaged peptide MS intensities between HOXA9-IP vs IgG (left) or SAFB IP vs IgG (right) samples (x-axis), plotted against the negative log10P values (y-axis) calculated across the triplicate data sets. Student t test, n = 3 technical replicates. The dashed black line marks 1.5 log FC. Chromatin-associated proteins enriched in HOXA9 or SAFB pulldowns are marked as red dots. The complete list of SAFB-HOXA9 commonly enriched proteins is given in supplemental Table 1. (B) Bar graph displays the enrichment (label-free quantification [LFQ] values) of NuRD complex members (MTA2 and GATAD2A) or heterochromatin protein HP1γ in HOXA9 or SAFB or IgG immunoprecipitated samples. The data shown here are intensities from LFQ values obtained via mass spectrometric analyses of all replicates for IgG (n = 3), SAFB (n = 3), and HOXA9 (n = 2) pull downs, average ± SD. The program does not plot for zero values. (C) Western blots showing HOXA9 interaction with SAFB, MTA2, and GATAD2A via coimmunoprecipitation of endogenous HOXA9 pulldown in MOLM13 cells. (D) Heat maps of HOXA9, SAFB, MTA2, GATAD2A, and HP1γ signal (relative to Input) on H9SB co-occupied genomic regions measured by the CUT&RUN method in MOLM13 cells. The y-axis represents individual regions centered at H9SB-bound genomic regions (± 10 kilobases). Regions were sorted based on the increasing distance to TSS. The relationship between coloring and signal intensity is shown in the bar (bottom of the plot). (E) Exemplar loci demonstrating co-occurrence of NuRD, HP1γ, and repressive histone modifications with H9SB that correlated with derepression of the associated genes upon H9SB perturbation are shown in the genome browser track on selected loci S100A8 in the Hg38 genome, obtained from CUT&RUN sequencing in MOLM13 cells. The upper 2 tracks show the transcripts signal obtained from RNA-seq in MOLM13 cells after HOXA9 (blue) or SAFB (pink) perturbation. Transcripts signal for HOXA9- or SAFB-CRISPR samples are shown relative to the nontargeting control (gray). (F) Venn diagram showing the overlap of high-confident NuRD (GATAD2A + MTA2) and HP1γ peaks with H9SB-cobound genomic regions in MOLM13 cells. The numbers represent the genomic regions. The differentiation-associated target genes of the H9SB-repressive complex that were also upregulated upon H9SB perturbation are highlighted; the top box shows gene targets of HOXA9/SAFB/NuRD; the lower box shows gene targets of HOXA9/SAFB/NuRD/HP1γ. (G) Heat maps show genomic coenrichment of HOXA9 and SAFB in primary AML cells (n = 5). NuRD and HP1γ co-occupancy as determined by the intersection of NuRD (MTA2 and GATAD2A) and Hp1γ peaks with H9SB cobound peaks obtained in the same AML cells by CUT&RUN. Because of limited material availability, only selected antibodies were used for samples 4 and 5 for CUT&RUN experiments. The relationship between coloring and signal intensity is shown in the bar at the side of the plot. (H) The genome browser track shows the peak colocalization of HOXA9, SAFB, and NuRD complex (MTA2 and GATAD2A); HP1γ on selected loci S100A8 (left) and CEBPD/SPIDR (right) in the Hg38 genome, obtained from CUT&RUN sequencing in primary AML cells. (I) The average signal of MTA2 (left) and HP1γ (right) (intensity on the y-axis as normalized read count) centered at H9SB-cobound regions determined using CUT&RUN in MOLM13 cells with or without SAFB knockdown using shRNA. (J) The average signal of H3K27Ac (left) and BRD4 (right) (intensity on the y-axis as normalized read count) centered at H9SB-cobound regions determined using CUT&RUN in MOLM13 cells with or without SAFB knockdown using shRNA. (K) The genome browser track shows the reduction in the enrichment of NuRD complex (MTA2 and GATAD2A) and HP1γ after SFAB knockdown in MOLM13 cells. Lower tracks show the gained enrichment of BRD4 and H3K27Ac after SFAB knockdown in MOLM13 cells. Selected loci CEBPD/SPIDR in the Hg38 genome, the signal obtained from CUT&RUN sequencing.
Figure 7.
Figure 7.
NuRD and HP1γ inactivation phenocopy H9SB at the functional and transcriptional level. (A) Growth kinetics of MOLM13 cells treated with panobinostat (Pano; 4 nM), chaetocin (Ch) (40 nM) alone, or in combination. The data are shown as the averages of biological replicates (n = 3) ± SD. Two-way ANOVA test, ∗P < .01 comparing NT vs treatments at 72 hours. (B) The bar graph shows the differentiation measured with CD11b-CD15 surface expression in MOLM13 cells after treatment with Pano (4 nM), Ch (40 nM) alone, or their combination, over the time course. Data shown are the averages of 3 biological replicates ± SD. Two-way ANOVA test, ∗P < .001. (C) The histogram shows flow cytometric analyses of annexin V–positive MOLM13 cells 72 hours after treatment with Pano (4 nM), Ch (40 nM) alone, or their combination. Representative plots of 3 independent biological replicates are shown. (D) qRT-PCR expression levels of selected target genes in MOLM13 cells treated with drugs alone or in combination for 48 hours. The data shown are representative of 3 independent biological replicates. (E) Growth kinetics of OCIAML3 cells treated with Pano (4 nM), Ch (40 nM) alone, or their combination. Fifty thousand cells were seeded followed by daily counting. The data are shown as the averages of 3 biological replicates ± SD. Statistical significance calculated using the 2-way ANOVA test, ∗P < .01. (F) The bar graph shows differentiation measured by CD11b-CD15 surface expression in OCIAML3 cells after treatment with Pano (4 nM), Ch (40 nM) alone, or their combination, for the time course. Data shown are the averages of 3 biological replicates ± SD. Statistical significance calculated using the 2-way ANOVA test, ∗∗P < .001. (G) The histogram shows flow cytometric analyses of annexin V–positive OCIAML3 cells 72 hours after treatment with Pano (4 nM), Ch (40 nM) alone, or their combination. Representative plots of 3 independent biological replicates are shown. (H) qRT-PCR expression levels of selected target genes in OCIAML3 cells treated with drugs alone or in combination for 48 hours. The data shown here are representative of 3 independent biological replicates. (I) Percent viability determined via annexin V/7AAD staining in primary AML cells after treatment with a combination of Pano (4 nM) + Ch (40 nM) or dimethyl sulfoxide (DMSO). (J) qRT-PCR expression levels of selected target genes in primary AML cells treated with drugs in combination or DMSO for 48 hours. The data shown here are the averages of triplicates of quantitative PCR values.
Figure 7.
Figure 7.
NuRD and HP1γ inactivation phenocopy H9SB at the functional and transcriptional level. (A) Growth kinetics of MOLM13 cells treated with panobinostat (Pano; 4 nM), chaetocin (Ch) (40 nM) alone, or in combination. The data are shown as the averages of biological replicates (n = 3) ± SD. Two-way ANOVA test, ∗P < .01 comparing NT vs treatments at 72 hours. (B) The bar graph shows the differentiation measured with CD11b-CD15 surface expression in MOLM13 cells after treatment with Pano (4 nM), Ch (40 nM) alone, or their combination, over the time course. Data shown are the averages of 3 biological replicates ± SD. Two-way ANOVA test, ∗P < .001. (C) The histogram shows flow cytometric analyses of annexin V–positive MOLM13 cells 72 hours after treatment with Pano (4 nM), Ch (40 nM) alone, or their combination. Representative plots of 3 independent biological replicates are shown. (D) qRT-PCR expression levels of selected target genes in MOLM13 cells treated with drugs alone or in combination for 48 hours. The data shown are representative of 3 independent biological replicates. (E) Growth kinetics of OCIAML3 cells treated with Pano (4 nM), Ch (40 nM) alone, or their combination. Fifty thousand cells were seeded followed by daily counting. The data are shown as the averages of 3 biological replicates ± SD. Statistical significance calculated using the 2-way ANOVA test, ∗P < .01. (F) The bar graph shows differentiation measured by CD11b-CD15 surface expression in OCIAML3 cells after treatment with Pano (4 nM), Ch (40 nM) alone, or their combination, for the time course. Data shown are the averages of 3 biological replicates ± SD. Statistical significance calculated using the 2-way ANOVA test, ∗∗P < .001. (G) The histogram shows flow cytometric analyses of annexin V–positive OCIAML3 cells 72 hours after treatment with Pano (4 nM), Ch (40 nM) alone, or their combination. Representative plots of 3 independent biological replicates are shown. (H) qRT-PCR expression levels of selected target genes in OCIAML3 cells treated with drugs alone or in combination for 48 hours. The data shown here are representative of 3 independent biological replicates. (I) Percent viability determined via annexin V/7AAD staining in primary AML cells after treatment with a combination of Pano (4 nM) + Ch (40 nM) or dimethyl sulfoxide (DMSO). (J) qRT-PCR expression levels of selected target genes in primary AML cells treated with drugs in combination or DMSO for 48 hours. The data shown here are the averages of triplicates of quantitative PCR values.

Comment in

References

    1. Dohner H, Weisdorf DJ, Bloomfield CD. Acute myeloid leukemia. N Engl J Med. 2015;373(12):1136–1152. - PubMed
    1. Papaemmanuil E, Gerstung M, Bullinger L, et al. Genomic classification and prognosis in acute myeloid leukemia. N Engl J Med. 2016;374(23):2209–2221. - PMC - PubMed
    1. Andreeff M, Ruvolo V, Gadgil S, et al. HOX expression patterns identify a common signature for favorable AML. Leukemia. 2008;22(11):2041–2047. - PMC - PubMed
    1. De Braekeleer E, Douet-Guilbert N, Basinko A, Le Bris MJ, Morel F, De Braekeleer M. Hox gene dysregulation in acute myeloid leukemia. Future Oncol. 2014;10(3):475–495. - PubMed
    1. Debernardi S, Lillington DM, Chaplin T, et al. Genome-wide analysis of acute myeloid leukemia with normal karyotype reveals a unique pattern of homeobox gene expression distinct from those with translocation-mediated fusion events. Genes Chromosomes Cancer. 2003;37(2):149–158. - PubMed

Publication types

MeSH terms