. 2022 Dec 27;41(13):111883.
doi: 10.1016/j.celrep.2022.111883.

IGF1 deficiency integrates stunted growth and neurodegeneration in Down syndrome

Affiliations

IGF1 deficiency integrates stunted growth and neurodegeneration in Down syndrome

Paula Araya et al. Cell Rep. .

Abstract

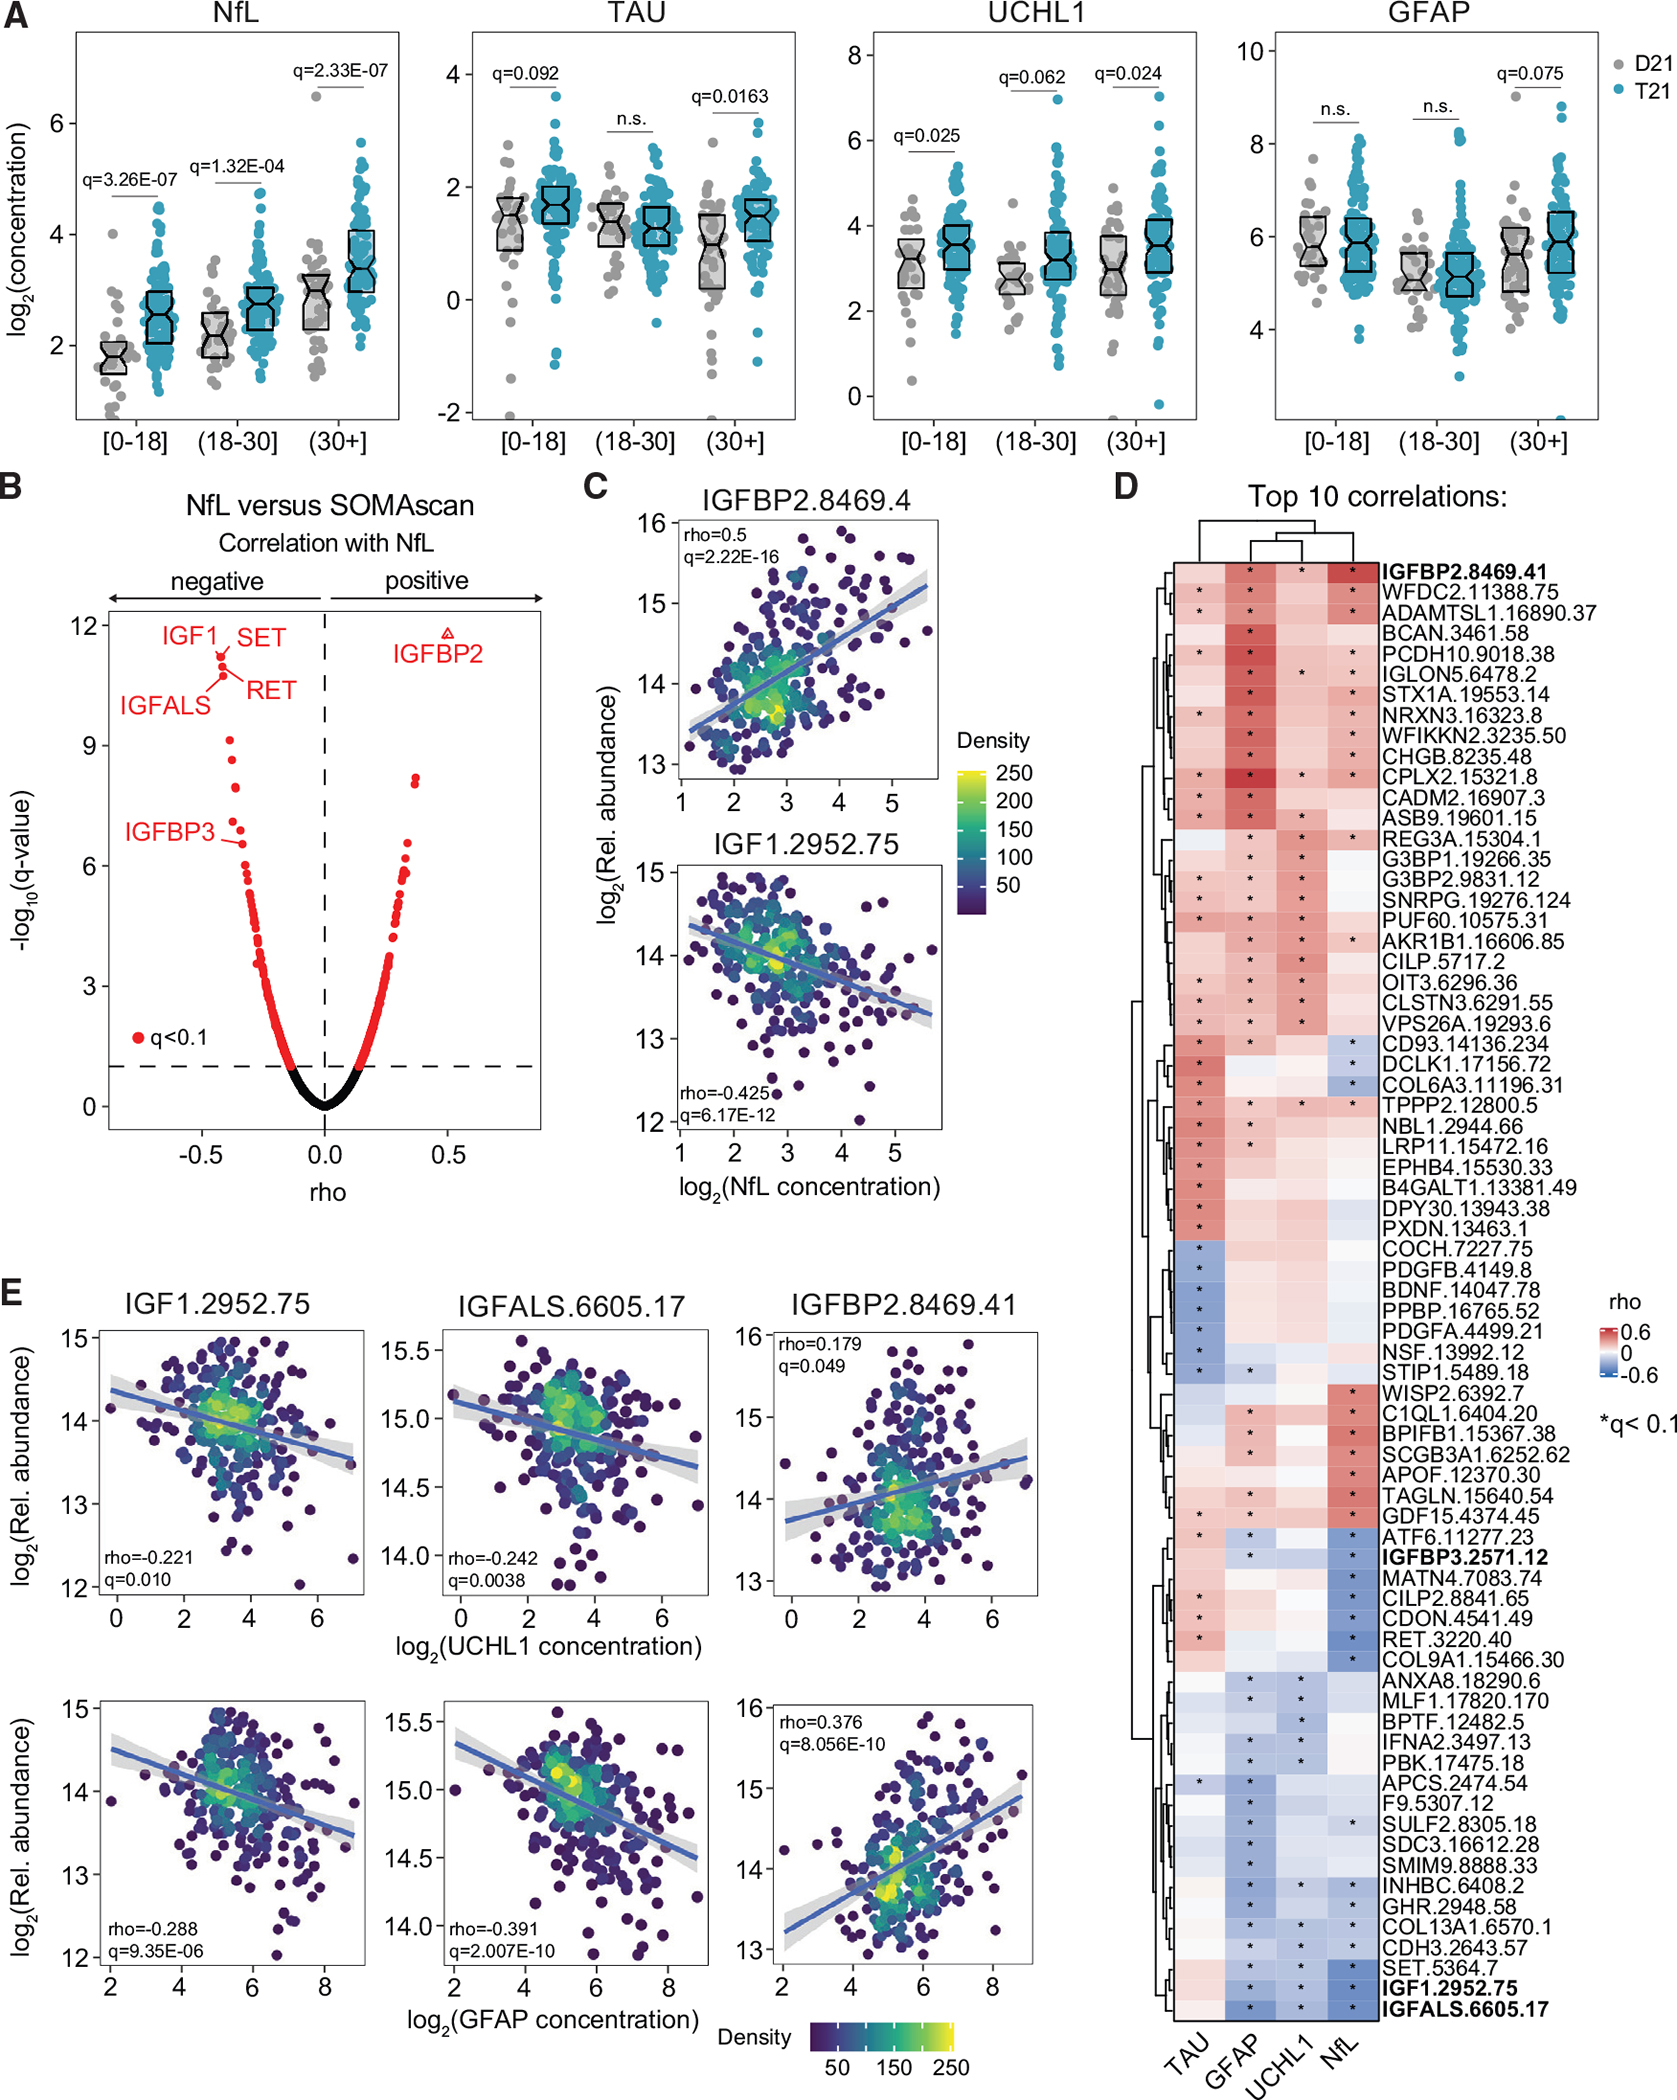
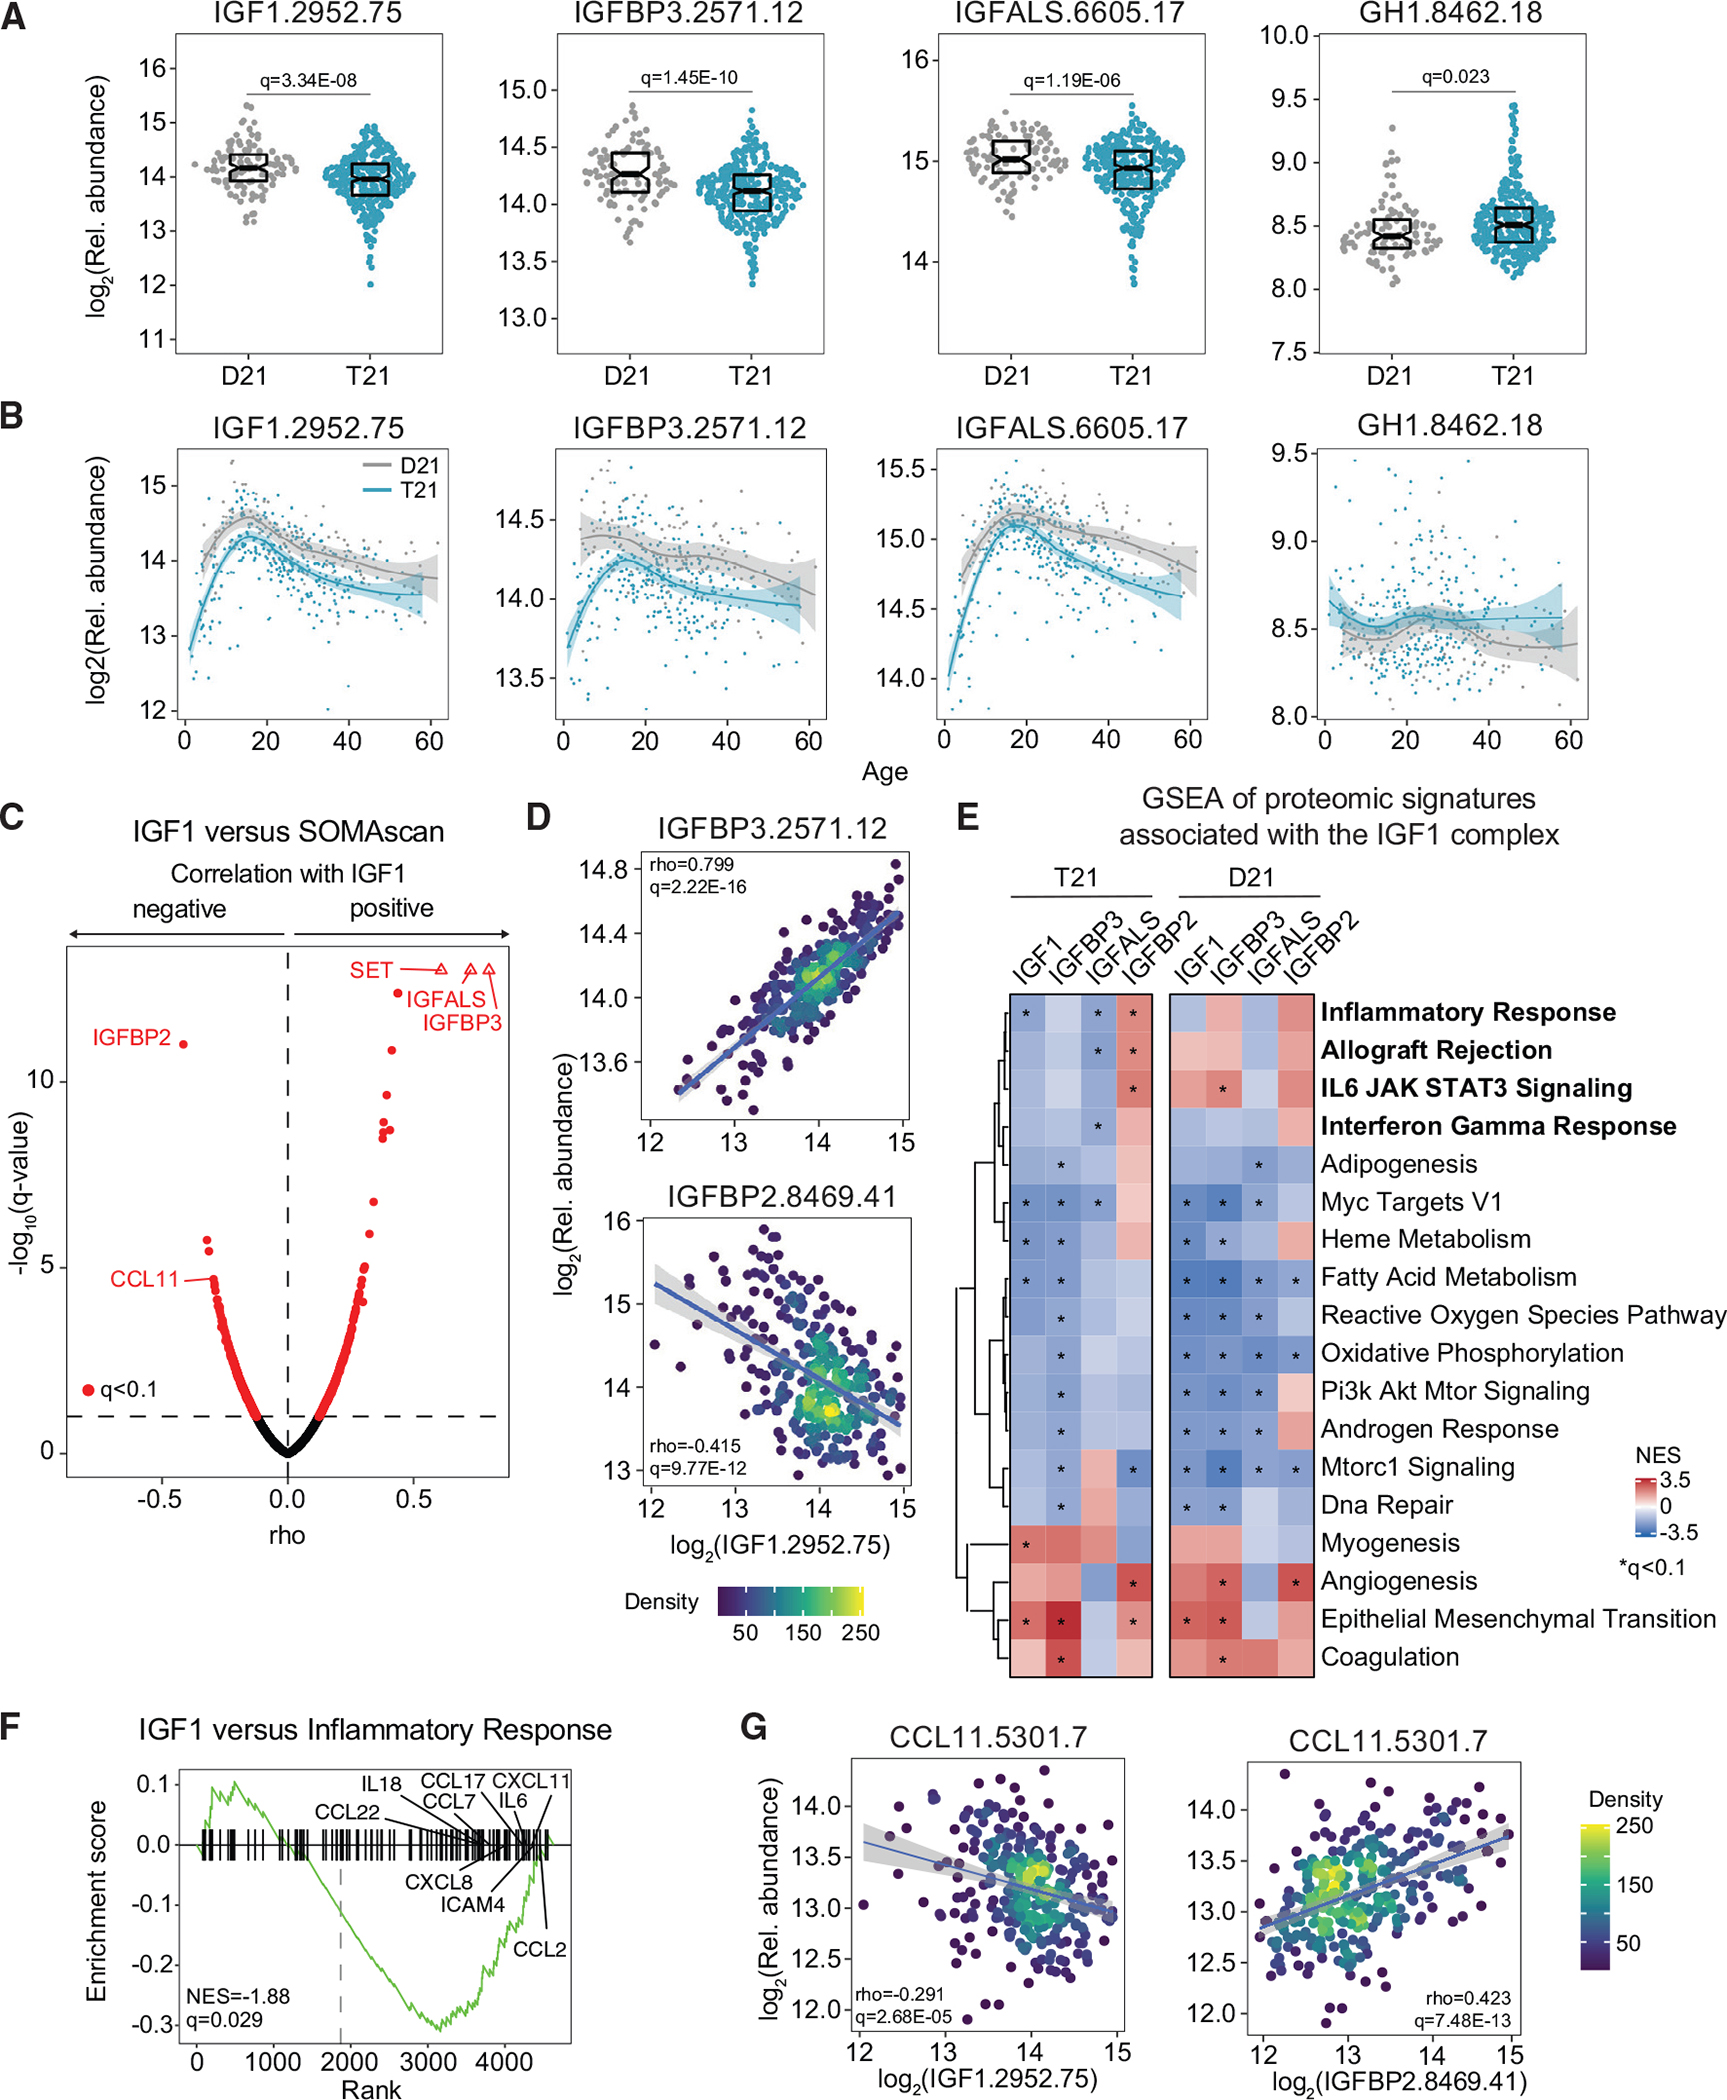
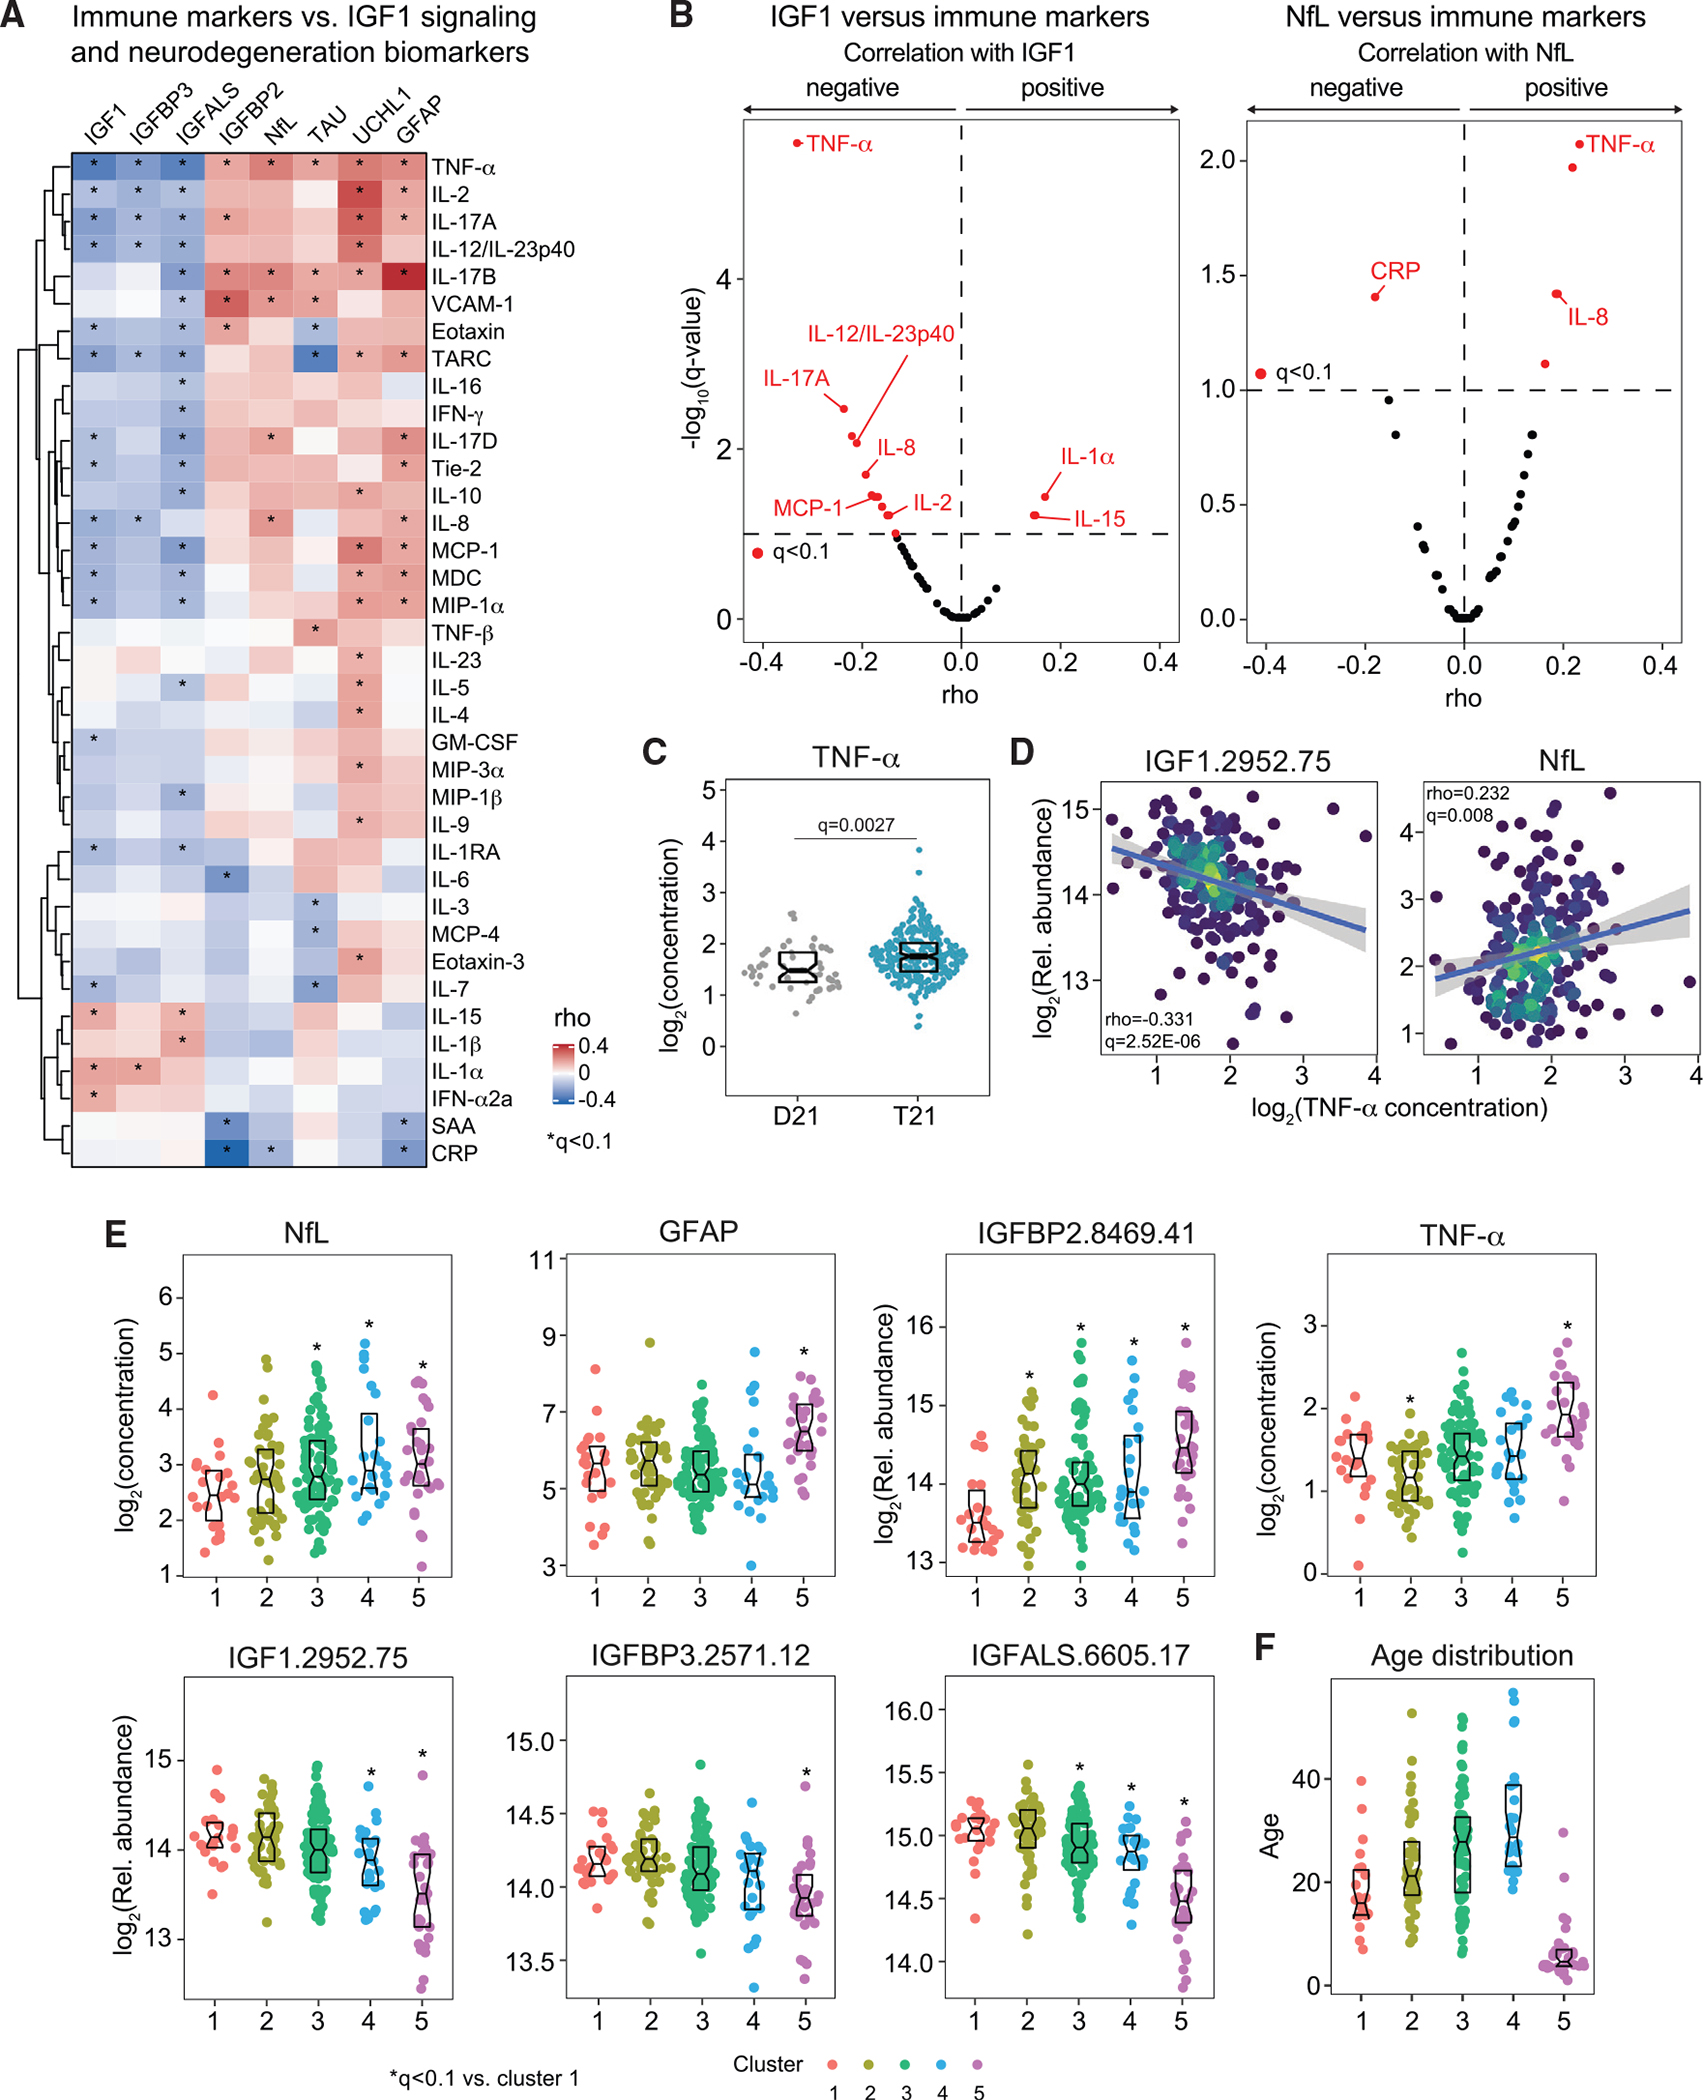
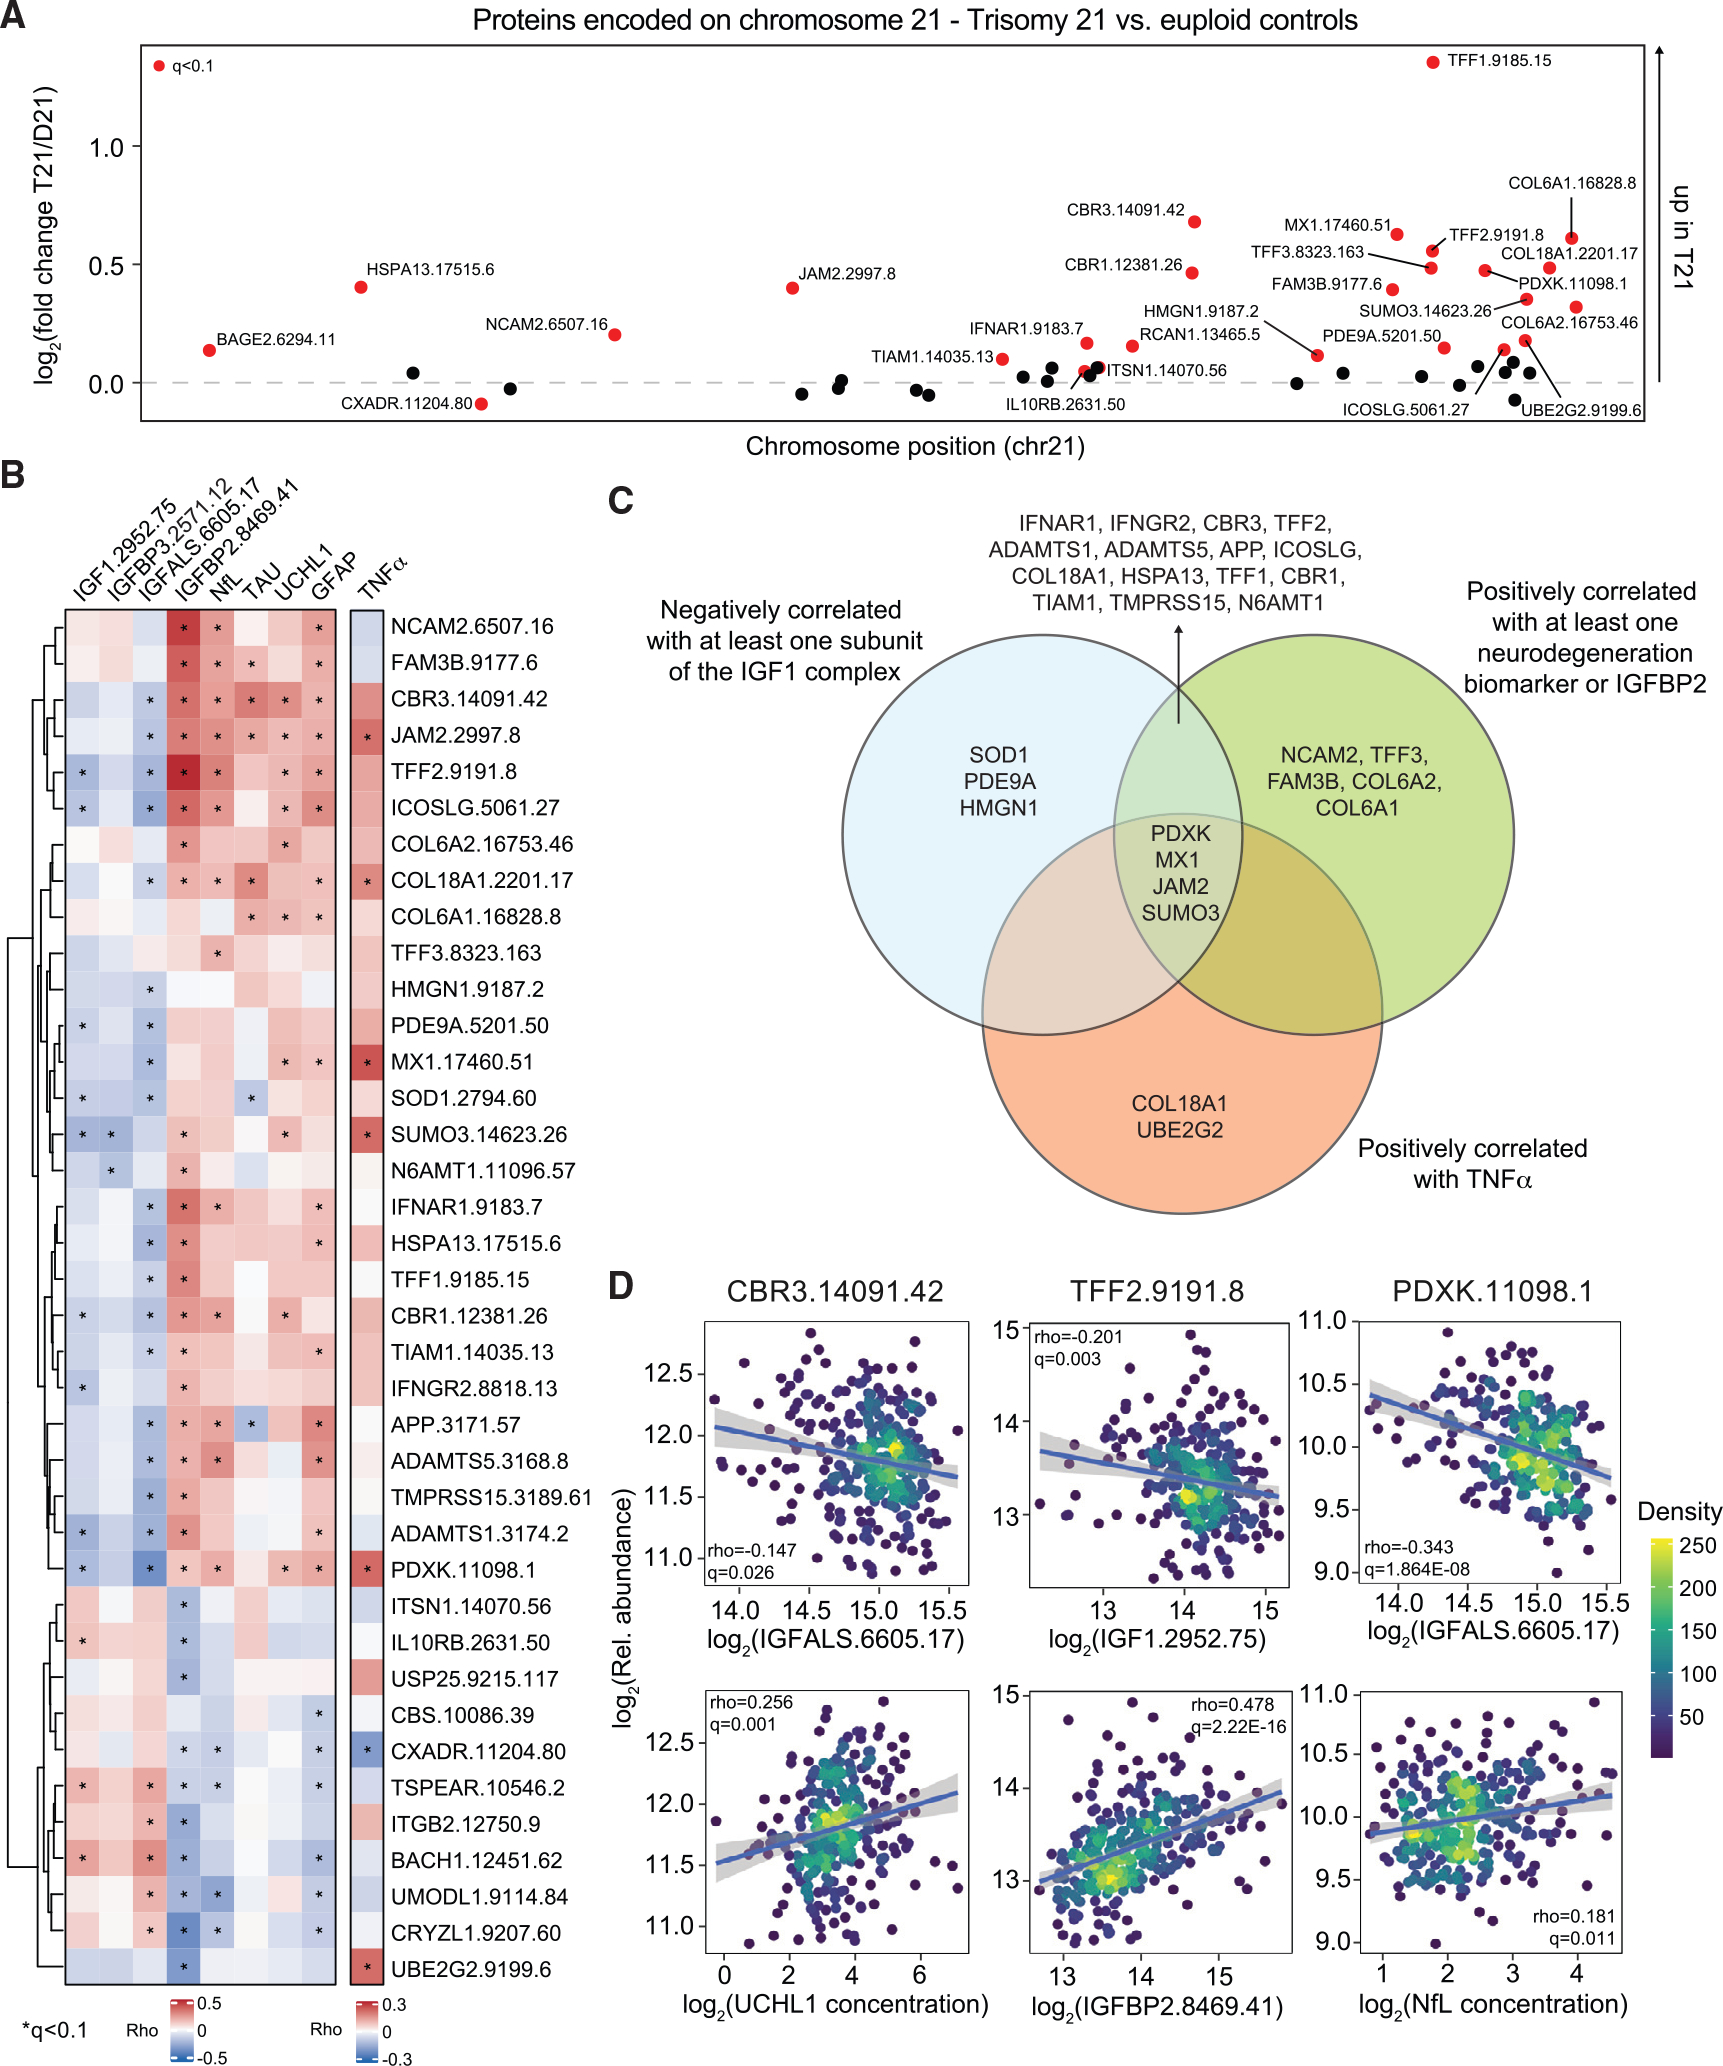
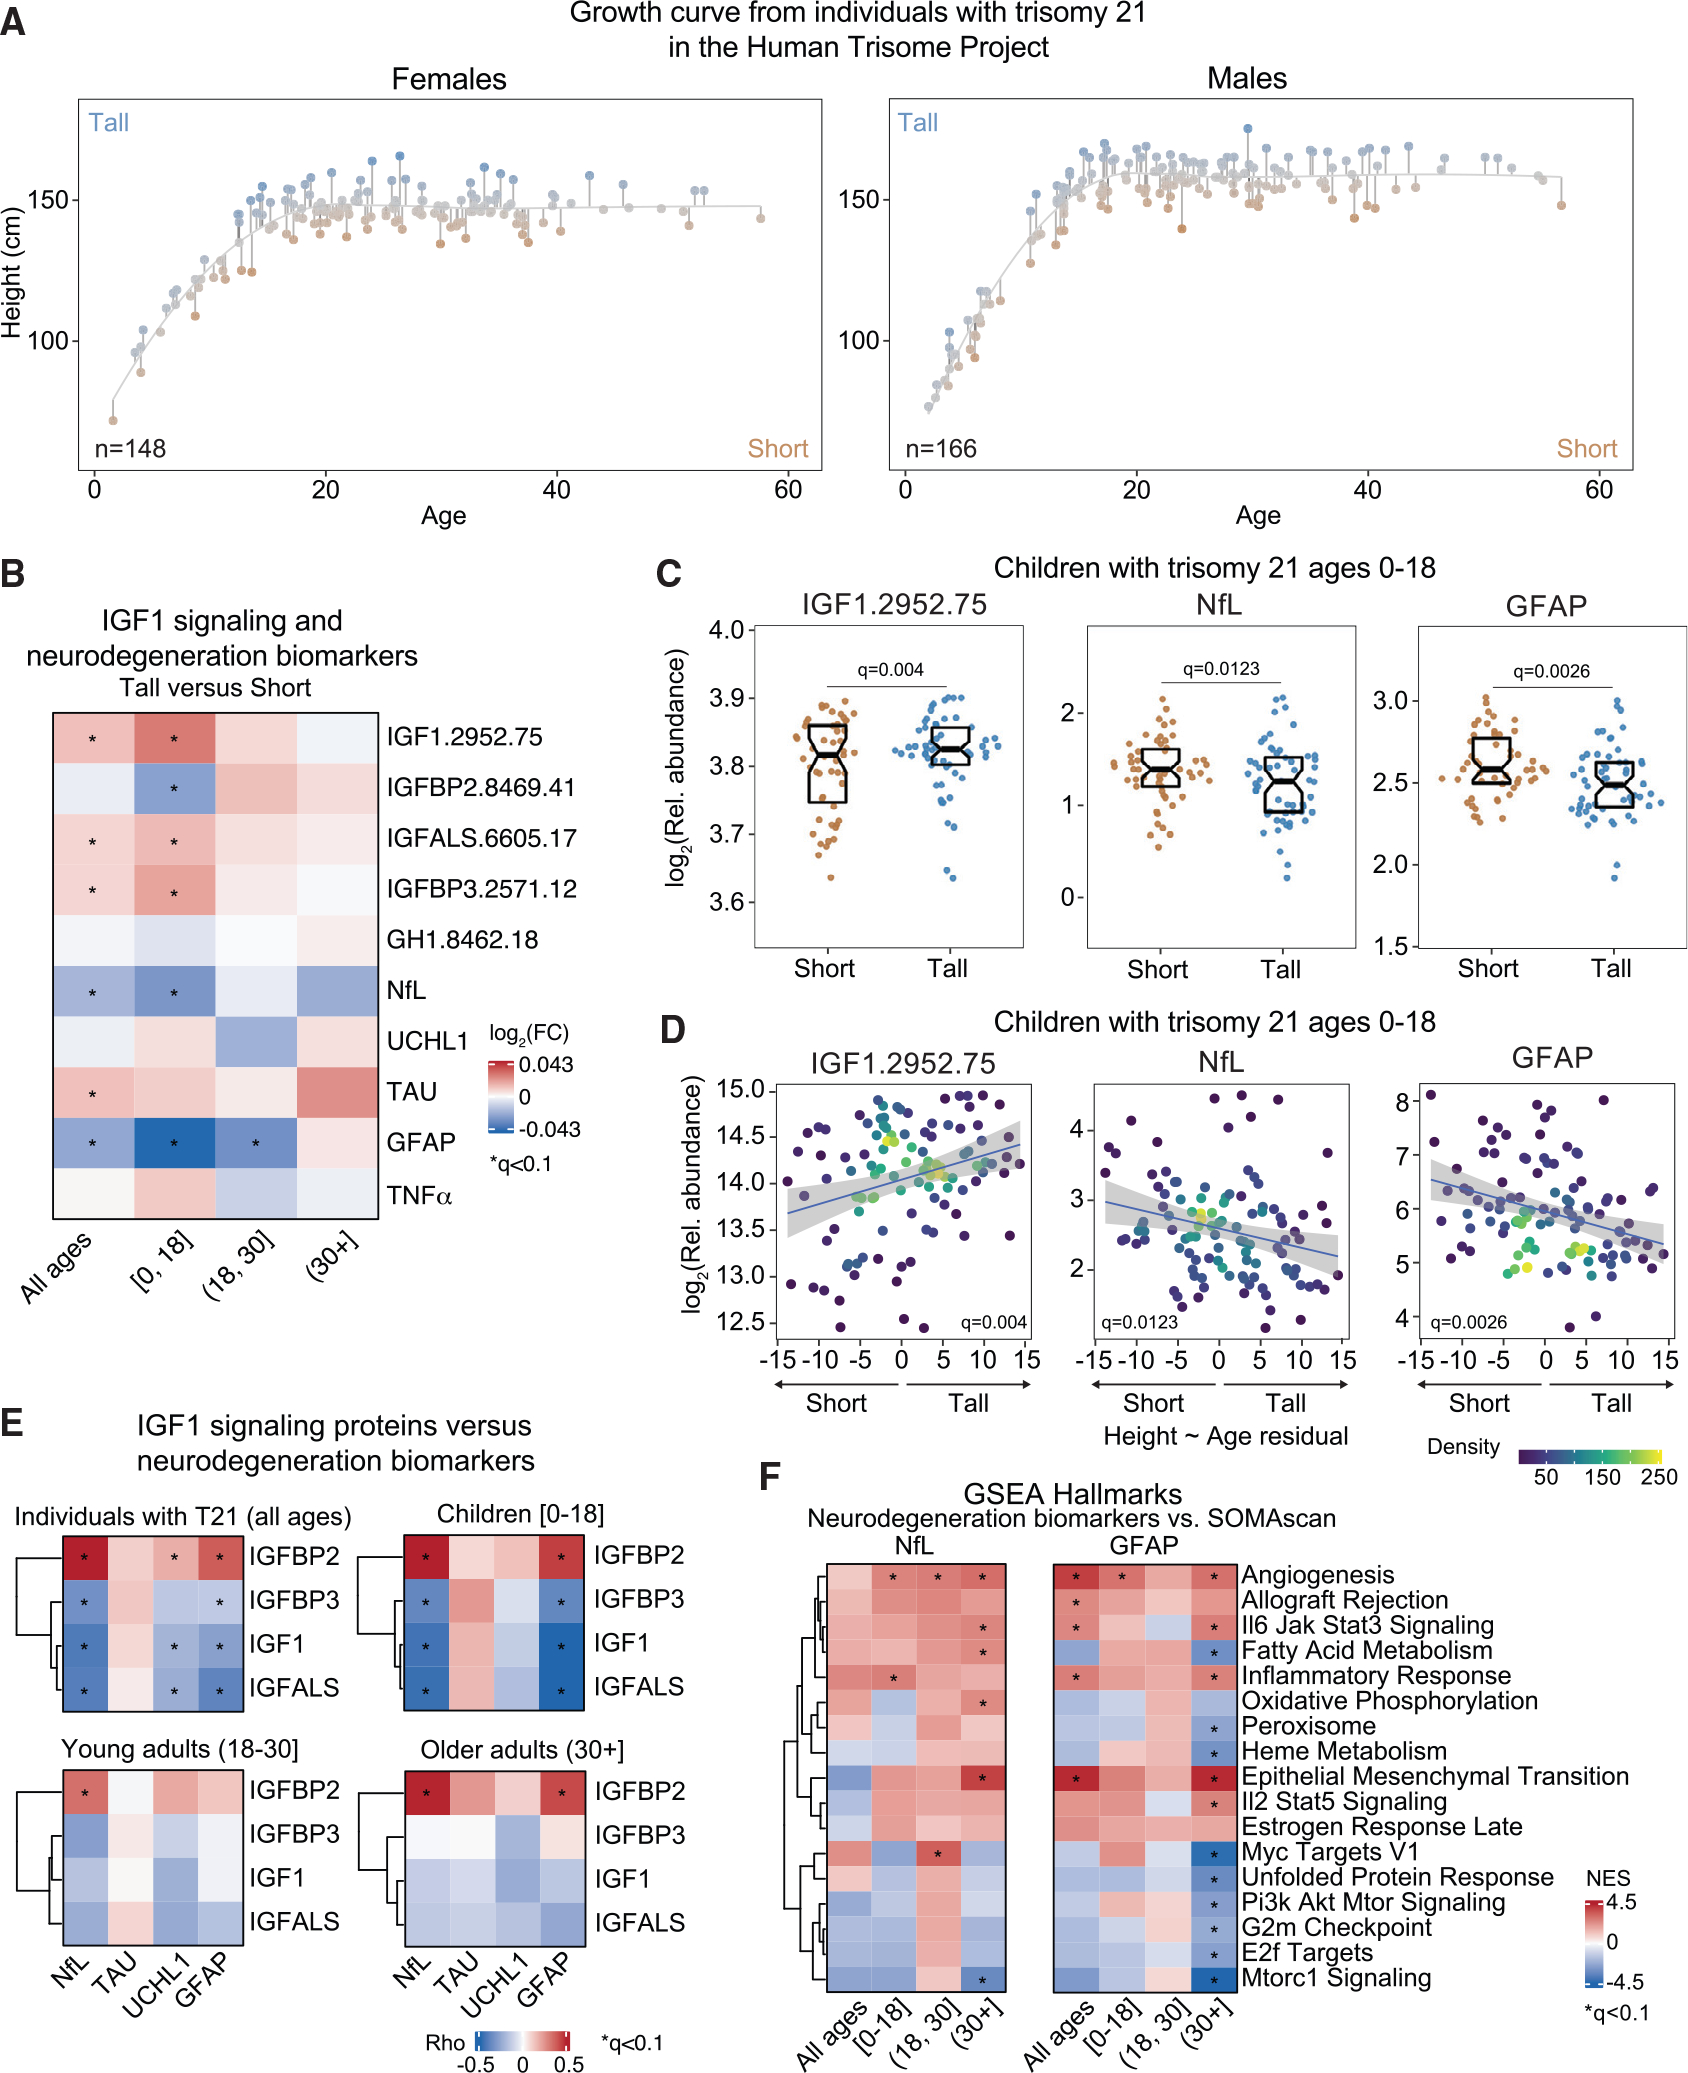
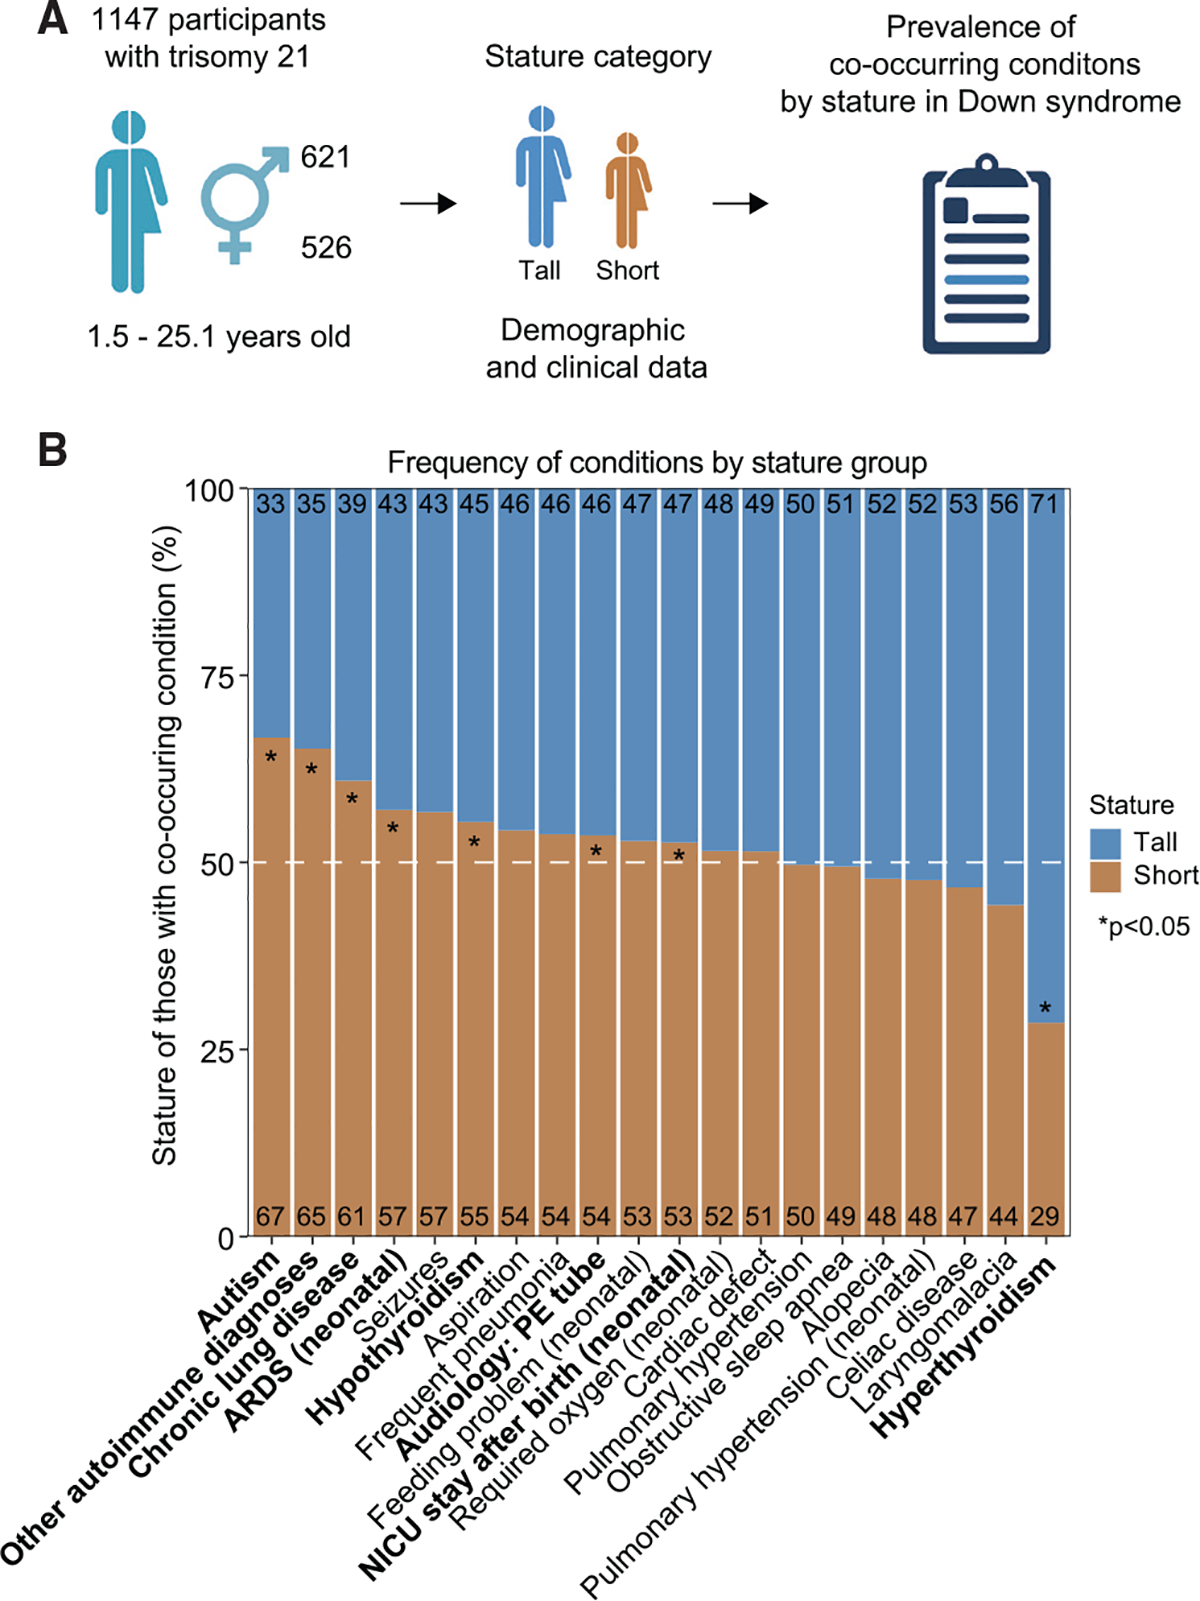
Down syndrome (DS), the genetic condition caused by trisomy 21 (T21), is characterized by stunted growth, cognitive impairment, and increased risk of diverse neurological conditions. Although signs of lifelong neurodegeneration are well documented in DS, the mechanisms underlying this phenotype await elucidation. Here we report a multi-omics analysis of neurodegeneration and neuroinflammation biomarkers, plasma proteomics, and immune profiling in a diverse cohort of more than 400 research participants. We identified depletion of insulin growth factor 1 (IGF1), a master regulator of growth and brain development, as the top biosignature associated with neurodegeneration in DS. Individuals with T21 display chronic IGF1 deficiency downstream of growth hormone production, associated with a specific inflammatory profile involving elevated tumor necrosis factor alpha (TNF-α). Shorter children with DS show stronger IGF1 deficiency, elevated biomarkers of neurodegeneration, and increased prevalence of autism and other conditions. These results point to disruption of IGF1 signaling as a potential contributor to stunted growth and neurodegeneration in DS.

Keywords: Alzheimer’s disease; CP: Developmental biology; CP: Neuroscience; autism; growth hormone; inflammation; insulin growth factor; mecasermin; neuroinflammation.


Conflict of interest statement

Declaration of interests J.M.E. has provided consulting services for Elli Lily and Co. and Gilead Sciences Inc. and serves on the advisory board of Perha Pharmaceuticals and on the editorial board of Cell Reports.

Figures

Figure 1.
Figure 1.. Proteomic biosignatures of neurodegeneration in DS associated with IGF1 deficiency
Levels of neurodegeneration/neuroinflammation biomarkers were measured in plasma samples from 419 research participants, 316 of them with trisomy 21 (T21), versus 103 age- and sex-matched euploid controls (D21). (A) Sina plots displaying levels of the indicated biomarkers at different age brackets. Data are presented as sina plots, with boxes indicating median and interquartile range. Differences between groups were determined with a multivariable linear regression with age, sex, and source as covariables with Benjamini-Hochberg (BH) correction of p values. Significance is defined by q < 0.1. (B) Volcano plot for Spearman correlations between circulating NfL levels and plasma proteins. (C) Scatterplots for levels of IGFBP2 (top) and IGF1 (bottom) correlated with NfL levels among individuals with T21. Values shown represent Spearman rho values. Points are colored by density. Lines represent a simple linear regression with 95% confidence interval. (D) Heatmap representing the top 10 proteins that are significantly correlated, positively or negatively, with the indicated biomarkers. Values displayed represent Spearman rho values. (E) Scatterplots for levels of IGF1, IGFALS, and IGFBP2 correlated with levels of UCHL1 (top) and GFAP (bottom) among individuals with T21. Other details are as described in (C). See also Figure S1 and Tables S1 and S2.
Figure 2.
Figure 2.. Individuals with DS display chronic IGF1 deficiency downstream of GH1 production
Factors in the GH1/IGF1 signaling pathway were measured in plasma samples from 419 research participants, 316 of them with T21, versus 103 age- and sex-matched euploid controls (D21). (A) Sina plots displaying levels of IGF1, IGFBP3, IGFALS, and GH1 in individuals with and without T21. Data are presented as sina plots, with boxes indicating median and interquartile range. Differences between groups were determined with a multivariable linear regression with age, sex, and source as covariables with BH correction of p values. (B) LOESS age trajectory plots for IGF1, IGFBP3, IGFALS, and GH1 in individuals with and without T21. (C) Volcano plot of Spearman correlations between circulating levels of IGF1 and plasma proteins in individuals with T21. (D) Scatterplots for levels of IGFBP3 (top) and IGFBP2 (bottom) versus IGF1 among individuals with T21. Values shown represent Spearman rho. The q values were calculated with the BH method. Points are colored by density. Lines represent a simple linear regression with 95% confidence interval. (E) Pathways significantly enriched by normalized enrichment score (NES) from weighted gene set enrichment analysis (GSEA) of proteins that are significantly positively and negatively correlated with IGF1 in individuals with and without T21. (F) Enrichment plot of the hallmark inflammatory response gene set negatively correlated with IGF1 levels in people with DS. (G) Scatterplots for levels of CCL11 (eotaxin) protein correlated with levels of IGF1 (left) and IGFBP2 (right) among individuals with T21. Details are as in (D). See also Figure S2 and Table S3.
Figure 3.
Figure 3.. IGF1 deficiency is associated with a specific inflammatory profile in DS
54 inflammatory factors were measured in plasma samples from 309 research participants, 259 of them with T21, versus 50 age- and sex-matched euploid controls (D21) for whom matched measurements of IGF1 signaling factors and neurodegeneration markers were available. (A) Heatmap displaying correlations in circulating levels of inflammatory markers adjusted by age, sex, and source that are significantly associated, positively or negatively, with IGF1, IGFBP3, IGFALS, IGFBP2, and four neurodegeneration/neuroinflammation biomarkers. Values displayed represent Spearman rho values, and asterisks indicate a significant correlation after multiple hypothesis correction with the method (q < 0.1). (B) Volcano plots for rho values from Spearman correlations between circulating IGF1 (left) and NfL (right) levels versus circulating levels of inflammatory factors in individuals with T21 after adjustment for age, sex, and source. (C) Sina plots displaying levels of TNF-α in individuals with and without T21. Boxes indicate median and interquartile range. Differences between groups were determined with a multivariable linear regression with age, sex, and source as covariables, with BH correction of p values. (D) Scatterplots displaying adjusted values for levels of IGF1 and NfL correlated with levels of TNF-α among individuals with DS. Values shown represent rho values from Spearman correlations and q values calculated with the BH method. Points are colored by density. Lines represent a simple linear regression with 95% confidence interval. (E and F) Sina plots displaying distributions of the indicated proteins (E) and ages (F) across the five molecular clusters identified among 259 participants with T21. Asterisks indicate q < 0.1 for Mann-Whitney tests of each cluster against cluster 1. Boxes represent medians and interquartile ranges. See also Figure S3 and Table S4.
Figure 4.
Figure 4.. Interplay between overexpression of chr21 proteins, IGF1 deficiency, and elevated markers of neurodegeneration in DS
Levels of proteins encoded on chromosome (chr21) were measured in plasma samples from 419 research participants, 316 of them with T21, versus 103 age- and sex-matched euploid controls (D21). (A) Manhattan plot of chr21, displaying the results of proteomics analysis by karyotype as estimated by multivariable linear model for log2(fold change T21/D21) with adjustment for age, sex, and source as covariables. Proteins passing the statistical cutoff (q < 0.1) are highlighted in red. (B) Heatmap indicating the proteins encoded on chr21 that are significantly correlated, positively or negatively, with the IGF1 ternary complex and IGFBP2 proteins, the four neurodegeneration/neuroinflammation biomarkers, and TNF-α, adjusted by age, sex, and source as covariables. Values displayed represent Spearman rho values. (C) Venn diagram displaying the overlaps in proteins encoded on chr21 that are negatively or positively correlated with various factors as described in (B). (D) Scatterplots displaying adjusted values for levels of select proteins encoded on chr21 (CBR3, TFF2, and PDXK) versus factors involved in IGF1 signaling and neurodegeneration/neuroinflammation biomarkers among individuals with T21. Values shown represent Spearman rho values and q values. Points are colored by density. Lines represent a simple linear regression with 95% confidence interval. See also Figure S4 and Table S5.
Figure 5.
Figure 5.. Shorter children with DS display stronger IGF1 deficiency and elevated markers of neurodegeneration
Relationship between stature with GH1/IGF1 signaling and neurodegeneration was explored in 314 individuals with Down syndrome (DS). (A) Growth curve showing the height versus age LOESS curve from females (n = 148) and males (n = 166) with DS in the Human Trisome Project cohort. Short or tall stature was assigned to each participant based on whether the distance between the participant’s height and the line from the height ~ age LOESS regression (residual) was positive or negative. (B) Heatmap representing differences in levels of GH1/IGF1 signaling proteins, the indicated neurodegeneration/neuroinflammation biomarkers, and TNF-α per unit of residual value from the height ~ age LOESS regression in individuals with T21. Values displayed are the log2 fold change of concentration levels per unit of residual, and asterisks indicate a significant correlation after multiple hypothesis correction with the BH method (q < 0.1). (C) Sina plots showing the levels of IGF1, NfL, and GFAP in short versus tall children (0–18) with T21 (short, n = 50–51; tall, n = 55–56). Data are presented as sina plots, with boxes indicating median and interquartile range. Differences between groups were determined as in (B). (D) Scatterplots for levels of IGF1, NfL, and GFAP versus the residuals from the height ~ age LOESS regression in children with DS. Points are colored by density. Lines represent a simple linear regression with 95% confidence interval. (E) Heatmap representing the correlation between four neurodegeneration/neuroinflammation biomarkers and IGF1 signaling proteins. Values displayed represent Spearman rho values. (F) Pathways significantly enriched by NES from weighted GSEA of proteins that are significantly positively and negatively correlated with NfL and GFAP at specific age brackets in individuals with T21. See also Figure S5 and Table S6.
Figure 6.
Figure 6.. Shorter children with DS exhibit increased incidence of specific co-occurring conditions
(A) Associations between stature and co-occurring conditions were defined in a cohort of 1,147 research participants with DS aged 1.5–25.1 years. Demographics and clinical data were analyzed by stature group as shown in Figure S6. (B) Bar plots showing the distribution of the indicated co-occurring conditions in individuals with T21 by stature category. History of autism, other autoimmune diagnoses, chronic lung disease, neonatal acute respiratory distress syndrome (ARDS), hypothyroidism (including Hashimoto’s disease), audiology pressure-equalizing (PE) tubes, and neonatal intensive care unit (NICU) stay after birth were more common in shorter children. Hyperthyroidism, including Graves’ disease, was more common in taller children. Asterisks indicate a significant difference using two-sided Fisher’s exact tests; *p < 0.05. See also Figure S6 and Table S1.

References

    1. de Graaf G, Buckley F, and Skotko BG (2017). Estimation of the number of people with Down syndrome in the United States. Genet. Med. 19, 439–447. 10.1038/gim.2016.127. - DOI - PubMed
    1. Antonarakis SE, Skotko BG, Rafii MS, Strydom A, Pape SE, Bianchi DW, Sherman SL, and Reeves RH (2020). Down syndrome. Nat. Rev. Dis. Primers 6, 9. 10.1038/s41572-019-0143-7. - DOI - PMC - PubMed
    1. Hasle H, Friedman JM, Olsen JH, and Rasmussen SA (2016). Low risk of solid tumors in persons with Down syndrome. Genet. Med. 18, 1151–1157. 10.1038/gim.2016.23. - DOI - PubMed
    1. Alexander M, Petri H, Ding Y, Wandel C, Khwaja O, and Foskett N (2016). Morbidity and medication in a large population of individuals with Down syndrome compared to the general population. Dev. Med. Child Neurol. 58, 246–254. 10.1111/dmcn.12868. - DOI - PubMed
    1. Chicoine B, Rivelli A, Fitzpatrick V, Chicoine L, Jia G, and Rzhetsky A (2021). Prevalence of common disease conditions in a large cohort of individuals with down syndrome in the United States. J. Patient. Cent. Res. Rev. 8, 86–97. 10.17294/2330-0698.1824. - DOI - PMC - PubMed

Publication types

MeSH terms

Supplementary concepts